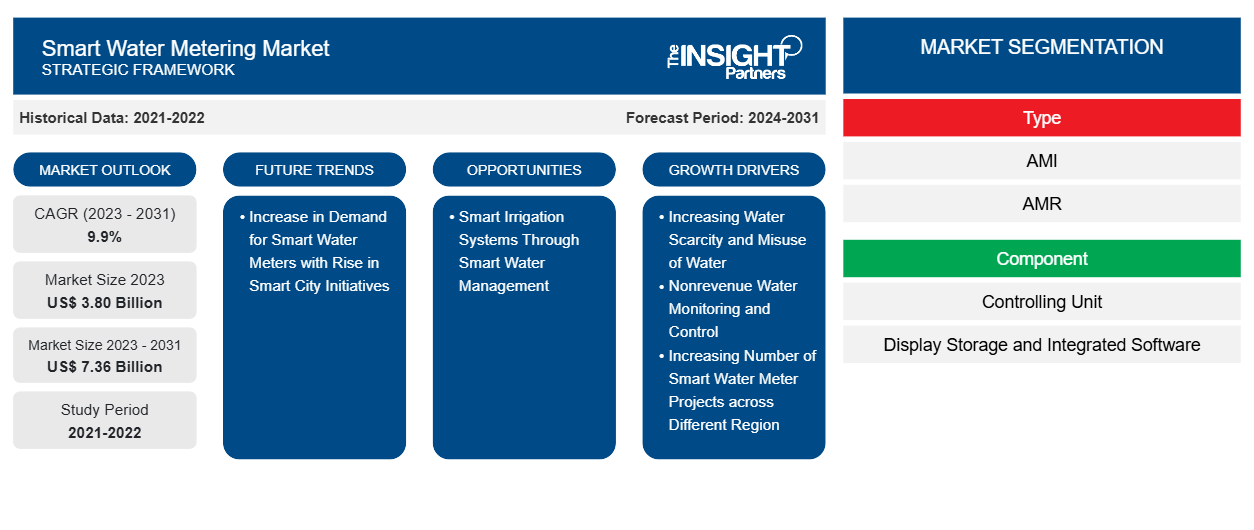
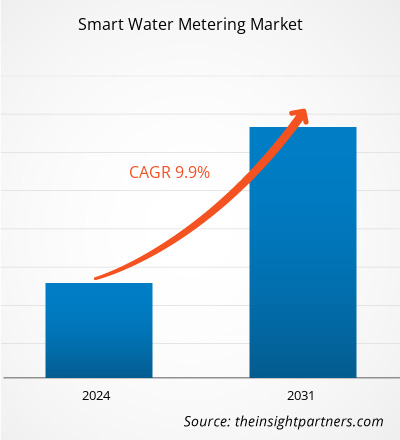
من المتوقع أن يصل حجم سوق عدادات المياه الذكية إلى 7.36 مليار دولار أمريكي بحلول عام 2031 من 3.80 مليار دولار أمريكي في عام 2023. ومن المتوقع أن يسجل السوق معدل نمو سنوي مركب بنسبة 9.9٪ خلال الفترة 2023-2031. ومن المرجح أن يظل زيادة الطلب على عدادات المياه الذكية مع زيادة مبادرات المدن الذكية اتجاهًا رئيسيًا في السوق خلال الفترة المتوقعة.
تحليل سوق عدادات المياه الذكية
تساعد العديد من المبادرات الحكومية سوق قياس المياه الذكي على الازدهار في السيناريو الحالي. على سبيل المثال، نفذت عدة أجزاء من أمريكا الشمالية بنجاح عدادات المياه الذكية بمساعدة التمويل الحكومي. كما أطلقت العديد من سلطات المدن في جميع أنحاء المنطقة العديد من المشاريع لتثبيت أو تحديث البنية التحتية الحالية لعدادات المياه الذكية. في نوفمبر 2021، أعلنت مدينة ويلمر في تكساس عن إطلاق مشروع تحديث عدادات المياه الذكية بقيمة 880.780 دولارًا أمريكيًا لتحديث البنية التحتية لخدمات المياه في المدينة. الهدف الرئيسي من هذا المشروع هو السماح للعملاء السكنيين بالوصول إلى بيانات استخدام المياه في الوقت الفعلي وتحسين الكفاءة التشغيلية. يساعد هذا أيضًا في قراءات عدادات المياه الأكثر دقة إلى جانب الفواتير الدقيقة لمقدمي خدمات نقل المياه والمستخدمين النهائيين.
نظرة عامة على سوق عدادات المياه الذكية
يعتمد مزودو المياه وشركات المياه باستمرار على تقنيات مختلفة لتوفير كمية كافية من المياه لكل منطقة. كما يساعد ذلك في تقليل التكاليف التشغيلية وإدارة الأصول وتعزيز الحفاظ عليها. من بين المستخدمين النهائيين، يتبنى القطاع السكني في البلدان المتقدمة والاقتصادات النامية عدادات المياه المتقدمة تقنيًا لمراقبة وفحص نمط استهلاك المياه. كما تسهل عدادات المياه الذكية المناطق السكنية من خلال منع تسرب الأنابيب ومحاولات العبث والتدفق العكسي، مما يقلل من فقدان المياه والخسائر المرتبطة بها. يقوم القطاع الصناعي بتحديث أنظمة المياه الخاصة به بعدادات المياه الذكية حيث تساعد هذه العدادات في فهم كمية المياه المخصصة لهم، وكمية المياه المزودة في النهاية، وكمية المياه التي يتم تحصيلها في نهاية الفترة. يمكن لعداد المياه الذكي اكتشاف عدم الكفاءة والأنماط في استهلاك المياه. تحتوي هذه العدادات على أجهزة استشعار إنترنت الأشياء التي تتبع استخدام كل مستهلك للمياه بشكل منتظم. يمكن مراقبة البيانات التي تولدها مجموعة المستشعرات بشكل أكبر، مما يسمح للمرافق والعملاء بفهم عادات استهلاكهم بشكل أفضل وتحديد المناطق التي يستخدمون فيها المياه الزائدة. هذا يقلل من حالات الاستهلاك المفرط للمياه والهدر. لتقليل فواتير المياه غير المدرة للدخل، تقوم الصناعات بشكل متزايد باقتناء عدادات المياه الذكية، مما يتيح للسوق التوسع.
قم بتخصيص هذا التقرير ليناسب متطلباتك
ستحصل على تخصيص لأي تقرير - مجانًا - بما في ذلك أجزاء من هذا التقرير، أو تحليل على مستوى الدولة، وحزمة بيانات Excel، بالإضافة إلى الاستفادة من العروض والخصومات الرائعة للشركات الناشئة والجامعات
سوق قياس المياه الذكي:
- احصل على أهم اتجاهات السوق الرئيسية لهذا التقرير.ستتضمن هذه العينة المجانية تحليلاً للبيانات، بدءًا من اتجاهات السوق وحتى التقديرات والتوقعات.
محركات وفرص سوق عدادات المياه الذكية
مراقبة ومراقبة المياه غير المدرة للدخل
المياه غير المدرة للدخل هي التناقض بين كمية المياه المنتجة وكمية المياه التي يتم تحصيلها من العملاء. يحدث فقدان المياه من المصدر إلى الوجهة لأسباب مختلفة، بما في ذلك التسربات (الخسارة المادية) وأخطاء القياس والتلاعب والسرقة (الخسائر الظاهرة). تتزايد المياه غير المدرة للدخل بمعدل أسي، مما يؤدي إلى ندرة المياه وغيرها من المخاوف. في المتوسط، وفقًا للبحث، فإن سرقة المياه أو الاستغلال غير القانوني مسؤول عن 8٪ من المياه غير المدرة للدخل في أمريكا الشمالية على أساس سنوي. وفقًا لبحث حديث أجرته الجمعية الدولية للمياه (IWA)، يبلغ هدر المياه العالمي حوالي 346 مليون متر مكعب يوميًا أو 126 مليار متر مكعب سنويًا في شبكات توزيع المياه في طريقها إلى العملاء. تُعرف هذه الخسائر أيضًا باسم NRW، وتبلغ حوالي 39 مليار دولار أمريكي سنويًا كمتوسط تكلفة المياه في أمريكا الشمالية. أدى متطلب استكشاف أخطاء المياه غير المدرة للدخل إلى الحاجة إلى تطوير العديد من التقنيات، مثل عدادات المياه الذكية، والتي تمت الموافقة عليها عمومًا من قبل حكومات مختلفة. يسجل عداد المياه الذكي بيانات كل ساعة عن التسريبات أو الخسائر، بالإضافة إلى وقت وتاريخ حدوثها. كما يتيح النظام للمشغل مراجعة البيانات التي تم الحصول عليها في الموقع أو من أي منصة. تتضمن العديد من عدادات المياه الذكية أجهزة إنذار لتقليل احتمالية سرقة خطوط الأنابيب أو التلاعب بها. تساعد أنظمة التحذير هذه في توليد الدخل من موقع المستخدمين النهائيين. إن الطلب المتزايد على مراقبة المياه غير المدرة للدخل والتحكم فيها والحد منها يدفع الشركات في الصناعة إلى الابتكار وتصميم تقنيات قوية، مما يدفع نمو سوق عدادات المياه الذكية.
أنظمة الري الذكية من خلال إدارة المياه الذكية
الري الذكي أو الزراعة الذكية قطاع مزدهر في أمريكا الشمالية وأوروبا بسبب حقيقة أن المناطق لديها أراضي زراعية كافية. ومع ذلك، فإنها تفتقر إلى العمالة البشرية والوقت اللازم للشكل التقليدي للزراعة. تنطوي الزراعة الذكية أو أنظمة الري الذكية على استخدام العديد من أجهزة الاستشعار، ومسجلات البيانات، وأنظمة الاتصالات جنبًا إلى جنب مع منصات البيانات التي يمكن للمشغل من خلالها مراجعة الإجراءات بسهولة. فيما يتعلق بالاتجاهات المذكورة أعلاه في صناعة الزراعة بين دول أمريكا الشمالية وأوروبا والارتفاع في أسعار أجهزة الاستشعار الفردية، ومسجلات البيانات، والمكونات الأخرى، ينفذ المزارعون أو المنظمات الزراعية عدادات المياه الذكية على الأراضي. يمكن دمج تقنية القياس الذكي في أنظمة الري لمراقبة وإدارة استهلاك المياه للمناظر الطبيعية والزراعة. يمكن أن تساعد أجهزة التحكم وأجهزة الاستشعار الذكية في الري المستخدمين على تحسين استخدامهم للمياه وتجنب إهدار المياه. يمكن أن يؤدي هذا إلى الحفاظ على المياه بشكل كبير في المناطق حيث يعتبر الري مستهلكًا رئيسيًا للمياه. بالإضافة إلى ذلك، تفيد عدادات المياه الذكية المزارعين أو المنظمات الزراعية من خلال ربط جميع المكونات الفردية في وحدة واحدة، مما يقلل بدوره من التكاليف الأولية للشركة. تسهل العدادات على المزارعين أو المنظمات الزراعية تحسين إدارة الطاقة واستخدام المياه والحفاظ على المياه وتوفير التكاليف في النهاية. تتمثل مزايا عدادات المياه الذكية في الري أو الزراعة في استشعار كمية المياه المطلوبة ورش الكمية المطلوبة. إنها تقلل الوقت وتقلل من العمالة البشرية وتعزز الدقة، مما يؤدي إلى إنتاجية محاصيل عالية الجودة. إن التقدم التكنولوجي في الحفاظ على المياه يفيد بشكل كبير صناعة الزراعة في دول مثل الولايات المتحدة وكندا والمكسيك وألمانيا وفرنسا والمملكة المتحدة وإيطاليا وأستراليا وغيرها. ومن المتوقع أن يعزز التبني الكبير للتقنيات الذكية في الري نمو سوق قياس المياه الذكية في السنوات القادمة.
تقرير تحليل تجزئة سوق عدادات المياه الذكية
إن القطاعات الرئيسية التي ساهمت في اشتقاق تحليل سوق عدادات المياه الذكية هي النوع والمكون والمستخدم النهائي ونوع العداد.
- بناءً على النوع، ينقسم سوق قياس المياه الذكي إلى AMR وAMI. احتل قطاع قارئ العدادات التلقائي حصة سوقية أكبر في عام 2023.
- بناءً على المكونات، ينقسم السوق إلى وحدات تحكم؛ وشاشات العرض والتخزين والبرامج المتكاملة؛ وغيرها. استحوذت شريحة شاشات العرض والتخزين والبرامج المتكاملة على أكبر حصة سوقية في عام 2023.
- من حيث المستخدم النهائي، ينقسم سوق قياس المياه الذكي إلى سكني وصناعي. احتل القطاع السكني حصة سوقية أكبر في عام 2023.
- بحسب نوع العداد، يتم تقسيم السوق إلى عداد بالموجات فوق الصوتية، وعداد كهرومغناطيسي، وعداد كهروميكانيكي. احتل قطاع عداد الموجات فوق الصوتية أكبر حصة في سوق قياس المياه الذكية في عام 2023.
تحليل حصة سوق عدادات المياه الذكية حسب المنطقة الجغرافية
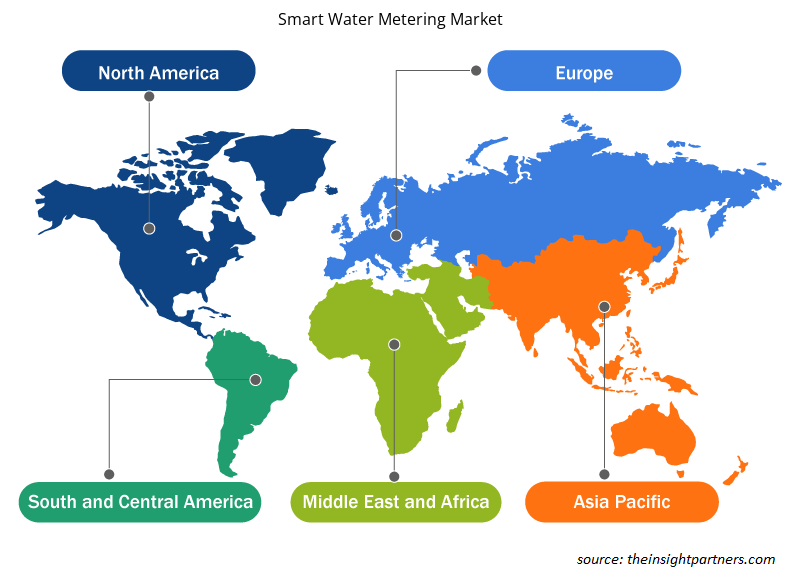
ينقسم النطاق الجغرافي لتقرير سوق قياس المياه الذكي بشكل أساسي إلى خمس مناطق: أمريكا الشمالية، وآسيا والمحيط الهادئ، وأوروبا، والشرق الأوسط وأفريقيا، وأمريكا الجنوبية والوسطى.
استحوذت أمريكا الشمالية على حصة سوقية كبيرة في عام 2023. وتضم أمريكا الشمالية الولايات المتحدة وكندا والمكسيك. تعد الولايات المتحدة دولة متقدمة من حيث تبني التكنولوجيا الحديثة ومستوى المعيشة وتطوير البنية التحتية وغيرها. كما وصلت مخاوف القدرة على تحمل التكاليف فيما يتعلق بتطوير البنية التحتية للمياه إلى مرحلة حرجة. تدير وكالة حماية البيئة الأمريكية (EPA) برنامجين لصندوق الدولة الدوار - صندوق الدولة الدوار للمياه النظيفة (CWSRF) وصندوق الدولة الدوار لمياه الشرب (DWSRF). بالإضافة إلى ذلك، يتم تمويل DWSRF بشكل مشترك من قبل الحكومات الفيدرالية وحكومات الولايات بنسبة 80٪ و 20٪ على التوالي.
لقد ركز مستثمرو صناعة المياه على الترقيات الانتهازية - في المقام الأول لدعم تركيب العدادات الذكية وجمع البيانات وتصورها بدلاً من تحسين الشبكة بالكامل. وتواصل حكومات المنطقة اتخاذ التدابير اللازمة للحد من استخدام المياه بشكل مستمر والخضوع للتحديث واستبدال عدادات المياه القديمة بعدادات مياه ذكية متطورة، وهو ما أصبح اتجاهاً رئيسياً في أمريكا الشمالية.
رؤى إقليمية حول سوق عدادات المياه الذكية
لقد قام المحللون في Insight Partners بشرح الاتجاهات والعوامل الإقليمية المؤثرة على سوق عدادات المياه الذكية طوال فترة التوقعات بشكل شامل. يناقش هذا القسم أيضًا قطاعات سوق عدادات المياه الذكية والجغرافيا في جميع أنحاء أمريكا الشمالية وأوروبا ومنطقة آسيا والمحيط الهادئ والشرق الأوسط وأفريقيا وأمريكا الجنوبية والوسطى.
- احصل على البيانات الإقليمية المحددة لسوق قياس المياه الذكية
نطاق تقرير سوق عدادات المياه الذكية
| سمة التقرير | تفاصيل |
|---|---|
| حجم السوق في عام 2023 | 3.80 مليار دولار أمريكي |
| حجم السوق بحلول عام 2031 | 7.36 مليار دولار أمريكي |
| معدل النمو السنوي المركب العالمي (2023 - 2031) | 9.9% |
| البيانات التاريخية | 2021-2022 |
| فترة التنبؤ | 2024-2031 |
| القطاعات المغطاة | حسب النوع
|
| المناطق والدول المغطاة | أمريكا الشمالية
|
| قادة السوق وملفات تعريف الشركات الرئيسية |
|
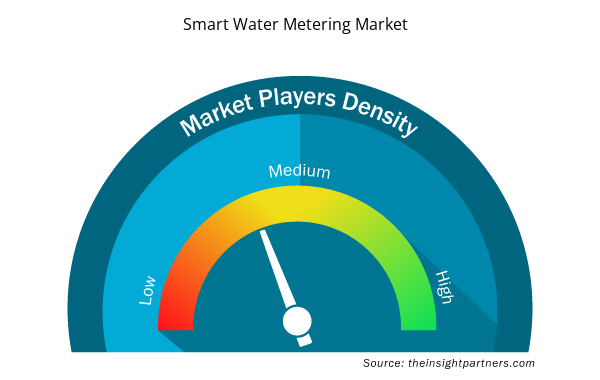
كثافة اللاعبين في السوق: فهم تأثيرها على ديناميكيات الأعمال
يشهد سوق عدادات المياه الذكية نموًا سريعًا، مدفوعًا بالطلب المتزايد من المستخدم النهائي بسبب عوامل مثل تفضيلات المستهلكين المتطورة والتقدم التكنولوجي والوعي المتزايد بفوائد المنتج. ومع ارتفاع الطلب، تعمل الشركات على توسيع عروضها والابتكار لتلبية احتياجات المستهلكين والاستفادة من الاتجاهات الناشئة، مما يؤدي إلى زيادة نمو السوق.
تشير كثافة اللاعبين في السوق إلى توزيع الشركات أو المؤسسات العاملة في سوق أو صناعة معينة. وهي تشير إلى عدد المنافسين (اللاعبين في السوق) الموجودين في مساحة سوق معينة نسبة إلى حجمها أو قيمتها السوقية الإجمالية.
الشركات الرئيسية العاملة في سوق قياس المياه الذكية هي:
- شركة أراد المحدودة
- شركة بادجر ميتر
- شركة بميتر المحدودة
- مؤسسة ديهل وشركاه
- شركة ايترون
- كامستروب ايه اس
إخلاء المسؤولية : الشركات المذكورة أعلاه ليست مرتبة بأي ترتيب معين.
- احصل على نظرة عامة على أهم اللاعبين الرئيسيين في سوق عدادات المياه الذكية
أخبار سوق عدادات المياه الذكية والتطورات الأخيرة
يتم تقييم سوق قياس المياه الذكي من خلال جمع البيانات النوعية والكمية بعد البحث الأولي والثانوي، والتي تتضمن منشورات الشركات المهمة وبيانات الجمعيات وقواعد البيانات. فيما يلي بعض التطورات في سوق قياس المياه الذكي:
- قامت شركة المياه في جميع أنحاء المكسيك بنشر حل AMI من Xylem في عام 2011. بالإضافة إلى ذلك، في عام 2022، قامت الشركة بنشر تحليلات Sensus الإضافية المستضافة على السحابة وعدادات المياه السكنية عبر شبكة الاتصالات FlexNet لجمع بيانات ضغط المياه. (المصدر: Sensus USA Inc، بيان صحفي، يوليو 2022)
- أعلنت شركة Neptune Technology Group Inc. عن إطلاق عدادات المياه بالموجات فوق الصوتية MACH 10 للتطبيقات التجارية والصناعية (C&I) امتدادًا لأجهزة MACH 10 السكنية والمتوسطة التي تعمل في جميع أنحاء أمريكا الشمالية. (المصدر: Neptune Technology Group Inc.، بيان صحفي، يونيو 2022)
تقرير سوق عدادات المياه الذكية: التغطية والنتائج المتوقعة
يوفر تقرير "حجم سوق قياس المياه الذكية والتوقعات (2021-2031)" تحليلاً مفصلاً للسوق يغطي المجالات التالية:
- حجم سوق قياس المياه الذكي وتوقعاته على المستويات العالمية والإقليمية والوطنية لجميع قطاعات السوق الرئيسية التي يغطيها النطاق
- اتجاهات سوق قياس المياه الذكية، بالإضافة إلى ديناميكيات السوق مثل العوامل المحركة والقيود والفرص الرئيسية
- تحليل مفصل لـ PEST و SWOT
- تحليل سوق قياس المياه الذكي يغطي اتجاهات السوق الرئيسية والإطار العالمي والإقليمي والجهات الفاعلة الرئيسية واللوائح والتطورات الأخيرة في السوق
- تحليل المشهد الصناعي والمنافسة الذي يغطي تركيز السوق، وتحليل خريطة الحرارة، واللاعبين البارزين، والتطورات الأخيرة لسوق قياس المياه الذكية
- ملفات تعريف الشركة التفصيلية
- التحليل التاريخي (سنتان)، السنة الأساسية، التوقعات (7 سنوات) مع معدل النمو السنوي المركب
- تحليل PEST و SWOT
- حجم السوق والقيمة / الحجم - عالميًا وإقليميًا وقطريًا
- الصناعة والمنافسة
- مجموعة بيانات Excel


- Latent TB Detection Market
- Social Employee Recognition System Market
- Nuclear Decommissioning Services Market
- Blood Collection Devices Market
- Health Economics and Outcome Research (HEOR) Services Market
- Fishing Equipment Market
- Quantitative Structure-Activity Relationship (QSAR) Market
- Truck Refrigeration Market
- Biopharmaceutical Contract Manufacturing Market
- Glycomics Market

Report Coverage
Revenue forecast, Company Analysis, Industry landscape, Growth factors, and Trends

Segment Covered
This text is related
to segments covered.

Regional Scope
North America, Europe, Asia Pacific, Middle East & Africa, South & Central America

Country Scope
This text is related
to country scope.
الأسئلة الشائعة
The smart water metering market was valued at US$ 3.80 billion in 2023 and is projected to reach US$ 7.36 billion by 2031; it is expected to grow at a CAGR of 9.9% during 2023–2031.
Increasing water scarcity, misuse of water and nonrevenue water monitoring and control and increasing number of smart water meter projects across different region are the driving factors impacting the smart water metering market.
Europe is anticipated to grow with the highest CAGR over the forecast period 2024-2031.
The key players, holding majority shares, in smart water metering market includes Badger Meter Inc, Sensus USA Inc., Itron Inc., Mueller Water Products Inc., and Kamstrup AS.
Increase in demand for smart water meters with rise in smart city initiatives is the future trends of the smart water metering market.
The Europe held the largest market share in 2023, followed by North America.
The List of Companies - Smart Water Metering Market
- Kamstrup AS
- Mueller Water Products Inc
- Badger Meter Inc
- Itron Inc
- Neptune Technology Group Inc
- Arad Ltd
- Sensus USA Inc
- WAVIoT Integrated Systems LLC
- Bmeters SRL
- Diehl Stiftung & Co KG
The Insight Partners performs research in 4 major stages: Data Collection & Secondary Research, Primary Research, Data Analysis and Data Triangulation & Final Review.
- Data Collection and Secondary Research:
As a market research and consulting firm operating from a decade, we have published and advised several client across the globe. First step for any study will start with an assessment of currently available data and insights from existing reports. Further, historical and current market information is collected from Investor Presentations, Annual Reports, SEC Filings, etc., and other information related to company’s performance and market positioning are gathered from Paid Databases (Factiva, Hoovers, and Reuters) and various other publications available in public domain.
Several associations trade associates, technical forums, institutes, societies and organization are accessed to gain technical as well as market related insights through their publications such as research papers, blogs and press releases related to the studies are referred to get cues about the market. Further, white papers, journals, magazines, and other news articles published in last 3 years are scrutinized and analyzed to understand the current market trends.
- Primary Research:
The primarily interview analysis comprise of data obtained from industry participants interview and answers to survey questions gathered by in-house primary team.
For primary research, interviews are conducted with industry experts/CEOs/Marketing Managers/VPs/Subject Matter Experts from both demand and supply side to get a 360-degree view of the market. The primary team conducts several interviews based on the complexity of the markets to understand the various market trends and dynamics which makes research more credible and precise.
A typical research interview fulfils the following functions:
- Provides first-hand information on the market size, market trends, growth trends, competitive landscape, and outlook
- Validates and strengthens in-house secondary research findings
- Develops the analysis team’s expertise and market understanding
Primary research involves email interactions and telephone interviews for each market, category, segment, and sub-segment across geographies. The participants who typically take part in such a process include, but are not limited to:
- Industry participants: VPs, business development managers, market intelligence managers and national sales managers
- Outside experts: Valuation experts, research analysts and key opinion leaders specializing in the electronics and semiconductor industry.
Below is the breakup of our primary respondents by company, designation, and region:

Once we receive the confirmation from primary research sources or primary respondents, we finalize the base year market estimation and forecast the data as per the macroeconomic and microeconomic factors assessed during data collection.
- Data Analysis:
Once data is validated through both secondary as well as primary respondents, we finalize the market estimations by hypothesis formulation and factor analysis at regional and country level.
- Macro-Economic Factor Analysis:
We analyse macroeconomic indicators such the gross domestic product (GDP), increase in the demand for goods and services across industries, technological advancement, regional economic growth, governmental policies, the influence of COVID-19, PEST analysis, and other aspects. This analysis aids in setting benchmarks for various nations/regions and approximating market splits. Additionally, the general trend of the aforementioned components aid in determining the market's development possibilities.
- Country Level Data:
Various factors that are especially aligned to the country are taken into account to determine the market size for a certain area and country, including the presence of vendors, such as headquarters and offices, the country's GDP, demand patterns, and industry growth. To comprehend the market dynamics for the nation, a number of growth variables, inhibitors, application areas, and current market trends are researched. The aforementioned elements aid in determining the country's overall market's growth potential.
- Company Profile:
The “Table of Contents” is formulated by listing and analyzing more than 25 - 30 companies operating in the market ecosystem across geographies. However, we profile only 10 companies as a standard practice in our syndicate reports. These 10 companies comprise leading, emerging, and regional players. Nonetheless, our analysis is not restricted to the 10 listed companies, we also analyze other companies present in the market to develop a holistic view and understand the prevailing trends. The “Company Profiles” section in the report covers key facts, business description, products & services, financial information, SWOT analysis, and key developments. The financial information presented is extracted from the annual reports and official documents of the publicly listed companies. Upon collecting the information for the sections of respective companies, we verify them via various primary sources and then compile the data in respective company profiles. The company level information helps us in deriving the base number as well as in forecasting the market size.
- Developing Base Number:
Aggregation of sales statistics (2020-2022) and macro-economic factor, and other secondary and primary research insights are utilized to arrive at base number and related market shares for 2022. The data gaps are identified in this step and relevant market data is analyzed, collected from paid primary interviews or databases. On finalizing the base year market size, forecasts are developed on the basis of macro-economic, industry and market growth factors and company level analysis.
- Data Triangulation and Final Review:
The market findings and base year market size calculations are validated from supply as well as demand side. Demand side validations are based on macro-economic factor analysis and benchmarks for respective regions and countries. In case of supply side validations, revenues of major companies are estimated (in case not available) based on industry benchmark, approximate number of employees, product portfolio, and primary interviews revenues are gathered. Further revenue from target product/service segment is assessed to avoid overshooting of market statistics. In case of heavy deviations between supply and demand side values, all thes steps are repeated to achieve synchronization.
We follow an iterative model, wherein we share our research findings with Subject Matter Experts (SME’s) and Key Opinion Leaders (KOLs) until consensus view of the market is not formulated – this model negates any drastic deviation in the opinions of experts. Only validated and universally acceptable research findings are quoted in our reports.
We have important check points that we use to validate our research findings – which we call – data triangulation, where we validate the information, we generate from secondary sources with primary interviews and then we re-validate with our internal data bases and Subject matter experts. This comprehensive model enables us to deliver high quality, reliable data in shortest possible time.
 احصل على عينة مجانية لهذا التقرير