سوق مرشحات السيارات – السائقين والاتجاهات والفرص وإحصاءات النمو | 2031
البيانات التاريخية : 2021-2022 | سنة الأساس : 2023 | فترة التنبؤ : 2023-2031حجم سوق فلاتر السيارات وتوقعاته (2021-2031)، والحصة العالمية والإقليمية، والاتجاهات، وتحليل فرص النمو. يغطي التقرير: النوع (فلتر الوقود، فلتر زيت المحرك، فلتر هواء المحرك، فلتر هواء المقصورة، فلتر هواء سائل التبريد، فلتر زيت التوجيه)؛ نوع المركبة (سيارة ركاب، مركبة تجارية خفيفة، مركبة تجارية ثقيلة)، والموقع الجغرافي.
- تاريخ التقرير : Jan 2026
- رمز التقرير : TIPRE00003605
- الفئة : السيارات والنقل
- الحالة : البيانات الصادرة
- تنسيقات التقارير المتاحة :


- عدد الصفحات : 150
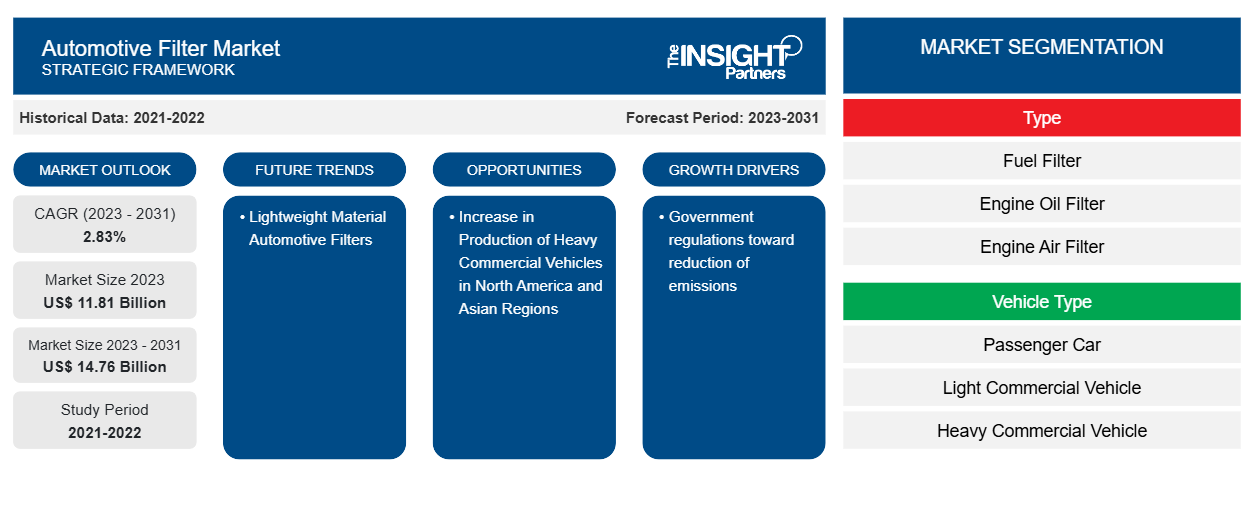
من المتوقع أن يصل حجم سوق مرشحات السيارات إلى 14.76 مليار دولار أمريكي بحلول عام 2031 من 11.81 مليار دولار أمريكي في عام 2023. ومن المتوقع أن يسجل السوق معدل نمو سنوي مركب بنسبة 2.83٪ في الفترة 2023-2031.إن زيادة اللوائح الحكومية بالإضافة إلى الاستثمار الكبير من قبل الشركات المصنعة للفلاتر الرائدة في مجال تقليل الانبعاثات يدفع نمو سوق فلاتر السيارات في السيناريو الحالي.
تحليل سوق فلاتر السيارات
تم توقيع اتفاقية التجارة الحرة لأمريكا الشمالية (NAFTA) بين الولايات المتحدة وكندا والمكسيك. وقد خفضت هذه الاتفاقية غالبية الحواجز الجمركية وغير الجمركية للتجارة الحرة والاستثمار بين هذه الدول الثلاث. كما ساعدت الاتفاقية في زيادة مستوى التجارة والاستثمار عبر دول أمريكا الشمالية. أمريكا الشمالية هي اقتصاد متطور للغاية ويتمتع الأفراد بدخل مرتفع بسبب ارتفاع دخل الفرد في البلاد. تتمتع الولايات المتحدة وكندا بكثافة عالية من المركبات التجارية. وفيما يتعلق بالدخل المرتفع المتاح بين المستخدمين النهائيين، أدت اتفاقية التجارة الحرة لأمريكا الشمالية بين الولايات المتحدة وكندا والمكسيك إلى أن تشهد المناطق ارتفاعًا كبيرًا في المركبات التجارية. ومن المتوقع أن يؤدي الارتفاع المستمر في الشاحنات والمقطورات والحافلات وغيرها من المركبات الثقيلة إلى تحفيز الطلب على فلاتر السيارات في دول أمريكا الشمالية.
نظرة عامة على سوق فلاتر السيارات
من المتوقع أن يشهد سوق فلاتر السيارات العالمية نموًا واعدًا خلال الفترة المتوقعة من 2023 إلى 2031. ومع زيادة الدخل المتاح، يشهد قطاع السيارات الفاخرة نموًا مذهلاً في المبيعات، وهو أحد العوامل الرئيسية التي تدفع نمو السوق. بالإضافة إلى هذه العوامل، من المتوقع أيضًا أن يؤدي العدد المتزايد من اللوائح الصارمة ومتطلبات الامتثال إلى دفع الطلب.
قم بتخصيص هذا التقرير ليناسب متطلباتك
ستحصل على تخصيص لأي تقرير - مجانًا - بما في ذلك أجزاء من هذا التقرير، أو تحليل على مستوى الدولة، وحزمة بيانات Excel، بالإضافة إلى الاستفادة من العروض والخصومات الرائعة للشركات الناشئة والجامعات
سوق فلاتر السيارات: رؤى استراتيجية
- احصل على أهم اتجاهات السوق الرئيسية لهذا التقرير.ستتضمن هذه العينة المجانية تحليلاً للبيانات، بدءًا من اتجاهات السوق وحتى التقديرات والتوقعات.
محركات وفرص سوق فلاتر السيارات
اللوائح الحكومية الرامية إلى الحد من الانبعاثات
تم تطوير وتصميم مرشحات السيارات لتقييد دخول جزيئات الأوساخ الدقيقة مثل أبخرة العادم وحبوب اللقاح والبكتيريا وغيرها إلى مكربن السيارات والمحرك. يعمل تطبيق هذه المرشحات على تقليل الملوثات الجوية التي تنبعث من محركات السيارات، مما يؤدي إلى إطالة عمر خدمة السيارة وتقليل تكلفة الصيانة. تفرض هيئات الانبعاثات والحكومات في جميع أنحاء العالم قوانين انبعاثات صارمة للمركبات التي تطلق غازات خطرة مثل أول أكسيد الكربون (CO) وأكسيد النيتروجين (NOx) والهيدروكربونات (HC) وغيرها. على سبيل المثال، قامت وكالة حماية البيئة (EPA) في الولايات المتحدة بتعديل المعايير مثل معايير الاقتصاد في استهلاك الوقود للمركبات التجارية الخفيفة والبرنامج الوطني لانبعاثات الغازات المسببة للاحتباس الحراري (GHG).
بالإضافة إلى ذلك، يشعر السائقون في الوقت الحاضر بتأثير ارتفاع أسعار النفط كل يوم عند المضخة، مما أدى إلى ارتفاع أسعار البنزين بشكل كبير وتزايدت الدعوة إلى حلول فعالة لتقليل استهلاك الوقود. طورت بعض الشركات الرائدة في تصنيع المرشحات حلولاً فريدة وواسعة النطاق تعتمد على الختم لتقليل الانبعاثات في المركبات الخدمية ومركبات الركاب. على سبيل المثال، طورت شركة Freudenberg Filtration Technologies SE & Co. KG تقنيات الترشيح التي تساهم في تقليل انبعاثات ثاني أكسيد الكربون بشكل فعال من خلال مرشحات الهواء الاصطناعي بالكامل لمدخل المحرك micronAir والتي تساعد في حماية الموارد القيمة. علاوة على ذلك، تؤدي خسائر الضغط المتزايدة لمرشحات هواء مدخل المحرك إلى زيادة الطلب على الطاقة بنفس الناتج ومع زيادة مقاومة المرشح بسبب رواسب الغبار، يزداد أيضًا استهلاك الوقود وانبعاثات ثاني أكسيد الكربون . وبالتالي، توفر وسائط الترشيح عالية الأداء وفلتر هواء المحرك خصائص ترشيح رائعة وقيم كفاءة في استخدام الطاقة والتي تضمن أيضًا تقليل الانبعاثات من المركبات.
تقرير تحليل تجزئة سوق مرشحات السيارات
إن القطاعات الرئيسية التي ساهمت في اشتقاق تحليل سوق مرشحات السيارات هي النوع ونوع السيارة.
- بناءً على النوع، يتم تقسيم سوق مرشحات السيارات إلى مرشح الوقود، وفلتر زيت المحرك، وفلتر هواء المحرك، وفلتر هواء المقصورة، وفلتر هواء سائل التبريد، وفلتر زيت التوجيه. احتلت شريحة مرشح هواء المحرك حصة سوقية أكبر في عام 2023.
- بناءً على نوع السيارة، يتم تصنيف سوق مجموعة نقل الحركة الكهربائية إلى سيارات الركاب والمركبات التجارية الخفيفة والمركبات التجارية الثقيلة. احتل قطاع سيارات الركاب الحصة الأكبر من السوق في عام 2023.
تحليل سوق فلاتر السيارات حسب المنطقة الجغرافية
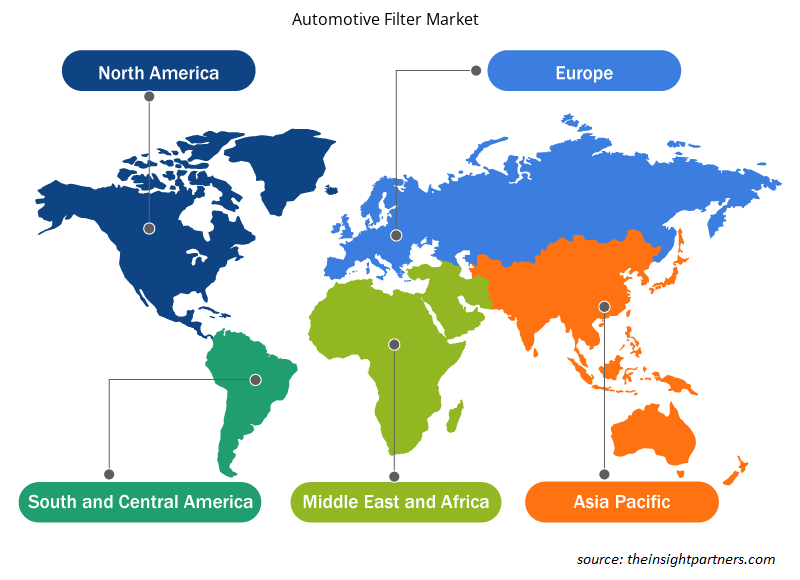
يتم تقسيم النطاق الجغرافي لتقرير سوق مرشح السيارات بشكل أساسي إلى خمس مناطق: أمريكا الشمالية وأوروبا وآسيا والمحيط الهادئ والشرق الأوسط وأفريقيا وأمريكا الجنوبية.
في منطقة آسيا والمحيط الهادئ، تعد الصين أكبر سوق نظرًا لسوقها الرائد في مجال السيارات. كما أن مبيعات مكونات السيارات المتزايدة ستدفع الطلب على فلاتر السيارات. كما أن التبني التكنولوجي المتزايد والطلب المتزايد على استخدام المقطورات والعربات المتنقلة غير المزودة بمحركات من شأنه أن يسرع نمو سوق فلاتر السيارات. وعلاوة على ذلك، فإن الطلب على المركبات الآلية في منطقة آسيا والمحيط الهادئ، جنبًا إلى جنب مع زيادة إنتاج سيارات الركاب والمركبات التجارية في الصين ودول أخرى، من شأنه أن يمكن مصنعي فلاتر السيارات من زيادة حضورهم في هذه المنطقة.
رؤى إقليمية حول سوق فلاتر السيارات
لقد قام المحللون في Insight Partners بشرح الاتجاهات والعوامل الإقليمية المؤثرة على سوق فلاتر السيارات طوال فترة التوقعات بشكل شامل. يناقش هذا القسم أيضًا قطاعات سوق فلاتر السيارات والجغرافيا في جميع أنحاء أمريكا الشمالية وأوروبا ومنطقة آسيا والمحيط الهادئ والشرق الأوسط وأفريقيا وأمريكا الجنوبية والوسطى.
- احصل على البيانات الإقليمية المحددة لسوق مرشحات السيارات
نطاق تقرير سوق مرشحات السيارات
| سمة التقرير | تفاصيل |
|---|---|
| حجم السوق في عام 2023 | 11.81 مليار دولار أمريكي |
| حجم السوق بحلول عام 2031 | 14.76 مليار دولار أمريكي |
| معدل النمو السنوي المركب العالمي (2023 - 2031) | 2.83% |
| البيانات التاريخية | 2021-2022 |
| فترة التنبؤ | 2023-2031 |
| القطاعات المغطاة | حسب النوع
|
| المناطق والدول المغطاة | أمريكا الشمالية
|
| قادة السوق وملفات تعريف الشركات الرئيسية |
|
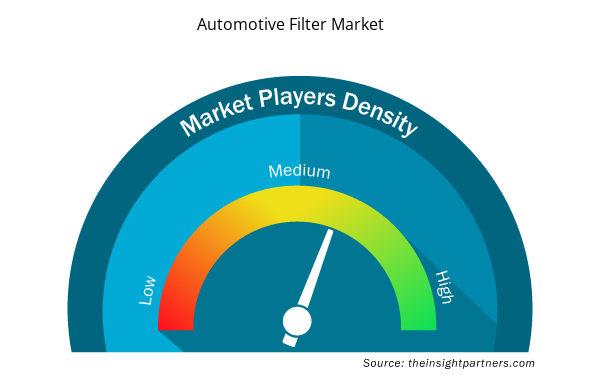
كثافة اللاعبين في سوق فلاتر السيارات: فهم تأثيرها على ديناميكيات الأعمال
يشهد سوق مرشحات السيارات نموًا سريعًا، مدفوعًا بالطلب المتزايد من المستخدم النهائي بسبب عوامل مثل تفضيلات المستهلك المتطورة والتقدم التكنولوجي والوعي المتزايد بفوائد المنتج. ومع ارتفاع الطلب، تعمل الشركات على توسيع عروضها والابتكار لتلبية احتياجات المستهلكين والاستفادة من الاتجاهات الناشئة، مما يؤدي إلى زيادة نمو السوق.
تشير كثافة اللاعبين في السوق إلى توزيع الشركات أو المؤسسات العاملة في سوق أو صناعة معينة. وهي تشير إلى عدد المنافسين (اللاعبين في السوق) الموجودين في مساحة سوق معينة نسبة إلى حجمها أو قيمتها السوقية الإجمالية.
الشركات الرئيسية العاملة في سوق فلتر السيارات هي:
- مرشح AL
- شركة ايه سي ديلكو
- شركة دينسو
- شركة دونالدسون المحدودة
- Freudenberg Filtration Technologies SE & Co. KG، K&N Engineering, Inc.
- شركة مان+هوميل المحدودة
إخلاء المسؤولية : الشركات المذكورة أعلاه ليست مرتبة بأي ترتيب معين.
- احصل على نظرة عامة على أهم اللاعبين الرئيسيين في سوق مرشحات السيارات
أخبار سوق فلاتر السيارات والتطورات الأخيرة
يتم تقييم سوق مرشحات السيارات من خلال جمع البيانات النوعية والكمية بعد البحث الأولي والثانوي، والتي تتضمن منشورات الشركات المهمة وبيانات الجمعيات وقواعد البيانات. فيما يلي قائمة بالتطورات في سوق مرشحات السيارات والاستراتيجيات:
- في أبريل 2024، قدمت شركة Ahlstrom تقنية جديدة لوسائط الترشيح ثنائية الطبقات، متاحة عالميًا، تمثل قفزة للأمام في الترشيح وهي الحل الأمثل للامتثال لاحتياجات السوق المستقبلية. يوفر التصميم ثنائي الطبقات ما يصل إلى ضعف سعة الاحتفاظ بالغبار مقارنة بالتصميم أحادي الطبقة، حيث تخدم كل طبقة غرضًا مميزًا لتحسين الاحتفاظ الكلي للجسيمات في عمق المادة. (المصدر: DJI، بيان صحفي/موقع الشركة/النشرة الإخبارية)
- في أبريل 2023، تقدم شركة Ahlstrom مجموعة جديدة من حلول الترشيح المتجددة والمستدامة لتطبيقات السيارات. Ahlstrom ECO™ هي تقنية تدعم متطلبات الاستدامة المتزايدة لسوق النقل العالمي وتقدم خيارًا جديدًا لمصنعي المرشحات. (المصدر: Flyability، بيان صحفي/موقع الشركة على الويب/النشرة الإخبارية)
تقرير سوق فلاتر السيارات - التغطية والنتائج المتوقعة
يوفر تقرير "حجم سوق مرشحات السيارات والتوقعات (2021-2031)" تحليلاً مفصلاً للسوق يغطي المجالات التالية:
- حجم السوق والتوقعات على المستويات العالمية والإقليمية والوطنية لجميع قطاعات السوق الرئيسية التي يغطيها النطاق
- ديناميكيات السوق مثل المحركات والقيود والفرص الرئيسية
- الاتجاهات المستقبلية الرئيسية
- تحليل مفصل لقوى بورتر الخمس
- تحليل السوق العالمي والإقليمي الذي يغطي اتجاهات السوق الرئيسية واللاعبين الرئيسيين واللوائح والتطورات الأخيرة في السوق
- تحليل المشهد الصناعي والمنافسة الذي يغطي تركيز السوق، وتحليل خريطة الحرارة، واللاعبين البارزين، والتطورات الأخيرة
- ملفات تعريف تفصيلية للشركة مع تحليل SWOT

نافين خبيرٌ متمرسٌ في أبحاث السوق والاستشارات، يتمتع بخبرةٍ تزيد عن 9 سنوات في مشاريع مُخصصة ومُشتركة واستشارية. يشغل حاليًا منصب نائب الرئيس المساعد، وقد نجح في إدارة أصحاب المصلحة عبر سلسلة قيمة المشاريع، وألّف أكثر من 100 تقرير بحثي وأكثر من 30 مهمة استشارية. يمتد نطاق عمله ليشمل مشاريع صناعية وحكومية، مساهمًا بشكل كبير في نجاح العملاء واتخاذ القرارات القائمة على البيانات.
نافين حاصلٌ على شهادة في هندسة الإلكترونيات والاتصالات من جامعة فرجينيا التقنية، كارناتاكا، وشهادة ماجستير في إدارة الأعمال في التسويق والعمليات من جامعة مانيبال. وهو عضوٌ نشطٌ في معهد مهندسي الكهرباء والإلكترونيات (IEEE) لمدة 9 سنوات، حيث شارك في مؤتمراتٍ وندواتٍ تقنية، وتطوّع على مستوى الأقسام والمناطق. قبل منصبه الحالي، عمل مستشارًا استراتيجيًا مساعدًا في IndustryARC، ومستشارًا للخوادم الصناعية في شركة هيوليت باكارد (HP Global).
- التحليل التاريخي (سنتان)، سنة الأساس، التوقعات (7 سنوات) مع معدل النمو السنوي المركب
- تحليل PEST و SWOT
- حجم السوق والقيمة / الحجم - عالمي، إقليمي، بلد
- الصناعة والمنافسة
- مجموعة بيانات إكسل
التقارير الحديثة
شهادات العملاء
تقرير سوق أنظمة SCADA من Insight Partners شامل، ويقدم رؤى قيّمة حول الاتجاهات الحالية والتوقعات المستقبلية. تميّز الفريق باحترافية عالية وسرعة في الاستجابة ودعم مستمر طوال الوقت. نحن راضون جدًا ونوصي بشدة بخدماتهم.
ران كيديم شريك, شركة ريالي تكنولوجيز المحدودةطلبتُ تقريرًا عن سوق برمجيات محدد، وأعدّه الفريق في غضون أيام قليلة. كانت المعلومات ذات صلة وثيقة وعرضها جيد. ثم طلبتُ بعض التعديلات والإضافات على التقرير. وكان الفريق متجاوبًا للغاية، وحصلتُ على التقرير النهائي في أقل من أسبوع.
جان هيرفيه جين رئيس مجلس الإدارة, فيوتشر أناليتيكاعملنا مع شركة "إنسايت بارتنرز" لإجراء دراسة سوقية وتوقعات مهمة. زودونا برؤى واضحة حول الفرص والمخاطر، مما ساعدنا في صياغة خططنا. كانت أبحاثهم سهلة الاستخدام ومبنية على بيانات دقيقة، مما ساعدنا على اتخاذ قرارات ذكية وواثقة. نوصي بهم بشدة.
بيوش ناجبال نائب الرئيس الأول, شعاع عالي عالميقدّمت شركة Insight Partners أبحاثًا سوقية ثاقبة ومنظمة جيدًا بخبرة واسعة في هذا المجال. تميّز فريقهم بالاحترافية وسرعة الاستجابة طوال الوقت. وسهّل موقعهم الإلكتروني سهل الاستخدام الوصول إلى تقارير القطاع. نوصي بهم بشدة لخدمات بحثية موثوقة وعالية الجودة.
يوكيهيكو أداتشي المدير التنفيذي, ديب بلو، ذ.م.م.هذه أول مرة أشتري فيها تقرير سوق من The Insight Partners. رغم أنني كنت مترددًا في البداية، إلا أنني زرت موقعهم الإلكتروني وشعرت براحة أكبر للمخاطرة وشراء تقرير السوق. أنا راضٍ تمامًا عن جودة التقرير وخدمة العملاء. كانت لديّ عدة أسئلة وتعليقات حول التقرير الأولي، ولكن بعد بضع محادثات عبر البريد الإلكتروني مع محللهم، أعتقد أن لديّ تقريرًا يمكنني استخدامه كمدخل لعملية التخطيط الاستراتيجي لدينا. شكرًا جزيلاً لكم على تخصيص وقتكم الإضافي وجعل هذه التجربة إيجابية. سأوصي بخدماتكم للآخرين بالتأكيد، وستكونون أول من ألجأ إليه عندما نحتاج إلى المزيد من بيانات السوق.
جون سوزوكي الرئيس والرئيس التنفيذي وعضو مجلس الإدارة, بي كيه تكنولوجيزأود أن أقدّر دعمكم واحترافيتكم في الاستجابة لطلبي للحصول على معلومات بشأن سوق التشخيص المخبري للأمراض المعدية في نيجيريا. كما أُقدّر صبركم وتوجيهكم، واستعدادكم لتقديم خصم، مما مكّننا في النهاية من إتمام الصفقة. أتطلع إلى التعامل مع "ذا إنسايت بارتنرز" مستقبلًا، كل ذلك بفضل الانطباع الذي تركتموه لديّ نتيجةً لهذا اللقاء الأول.
الدكتور تشيجيوك أونيا المدير الإداري, شركة باينكريست للرعاية الصحية المحدودةسبب الشراء
- اتخاذ قرارات مدروسة
- فهم ديناميكيات السوق
- تحليل المنافسة
- رؤى العملاء
- توقعات السوق
- تخفيف المخاطر
- التخطيط الاستراتيجي
- مبررات الاستثمار
- تحديد الأسواق الناشئة
- تحسين استراتيجيات التسويق
- تعزيز الكفاءة التشغيلية
- مواكبة التوجهات التنظيمية


 احصل على عينة مجانية ل - سوق فلاتر السيارات