تزوير السوق – المحركات والاتجاهات والفرص وإحصاءات النمو | 2031
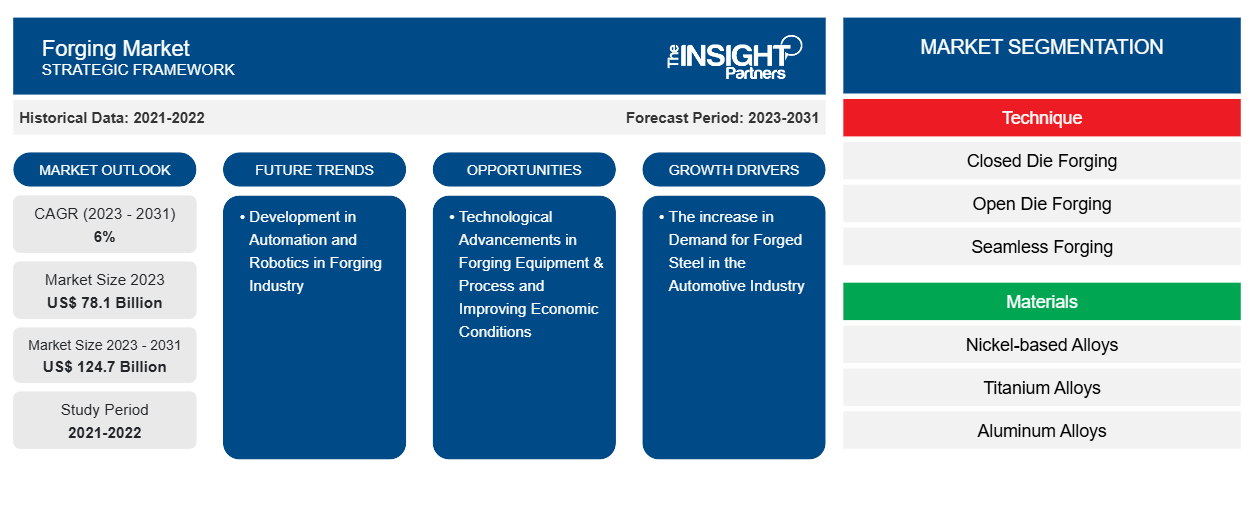
البيانات التاريخية : 2021-2022 | سنة الأساس : 2023 | فترة التنبؤ : 2023-2031حجم سوق التشكيل وتوقعاته (2021-2031)، والحصة العالمية والإقليمية، والاتجاهات، وفرص النمو. يغطي التقرير: حسب التقنية (التشكيل بالقالب المغلق، والتشكيل بالقالب المفتوح، والتشكيل بدون لحام)، والمواد (سبائك النيكل، وسبائك التيتانيوم، وسبائك الألومنيوم، وسبائك الصلب، وغيرها)، والصناعة (السيارات، والفضاء، والسكك الحديدية، والمعدات الثقيلة، وطاقة الرياح)، والجغرافيا.
- تاريخ التقرير : Mar 2026
- رمز التقرير : TIPRE00017201
- الفئة : التصنيع والبناء
- الحالة : البيانات الصادرة
- تنسيقات التقارير المتاحة :


- عدد الصفحات : 150
من المتوقع أن يصل حجم سوق التشكيل إلى 124.7 مليار دولار أمريكي بحلول عام 2031 من 78.1 مليار دولار أمريكي في عام 2023. ومن المتوقع أن يسجل السوق معدل نمو سنوي مركب بنسبة 6٪ خلال الفترة 2023-2031. إن زيادة الاستثمار في توليد الطاقة المتجددة وزيادة الطلب من صناعات الطيران والسيارات والبناء هي بعض العوامل التي تدفع سوق التشكيل.
تحليل سوق التشكيل
يشهد سوق التشكيل بالطرق العالمي نموًا متواضعًا بسبب الطلب المتزايد من صناعات السيارات والفضاء. وقد أدى ارتفاع حركة الركاب الجوية إلى توسع قطاع الطيران، مما عزز تصنيع أجزاء الطيران المزورة. كما تستثمر الحكومات المختلفة في جميع أنحاء العالم بشكل متزايد في مشاريع طاقة الرياح، مما يؤدي إلى زيادة الطلب على مكونات طاقة الرياح المزورة. ومع ذلك، فإن توافر البدائل الرخيصة والتكاليف المرتفعة تقيد توسع سوق التشكيل بالطرق إلى حد ما.
نظرة عامة على سوق التشكيل
مع تزايد عدد السكان والتصنيع، يرتفع الطلب على الطاقة على المستوى العالمي. وقد أدى ارتفاع استهلاك الطاقة إلى تعزيز الحاجة إلى الاستثمار في محطات توليد الطاقة وتطوير البنية الأساسية، مما أدى إلى زيادة الطلب على المكونات المزورة مثل التركيبات والشفاه والصمامات والمسامير والأوعية والصواميل. حققت صناعة التشكيل مكانة مهمة في الاقتصاد الصناعي العالمي من خلال إنتاج مكونات ذات مزايا فريدة يصعب تكرارها. جعلت قوة وموثوقية ومتانة المكونات المزورة منها الخيار المفضل في مجموعة متنوعة من التطبيقات الصناعية حيث تكون عمر التعب ومتانة الكسر أمرًا بالغ الأهمية لسلامة الأشخاص والمعدات.
قم بتخصيص هذا التقرير ليناسب متطلباتك
ستحصل على تخصيص لأي تقرير - مجانًا - بما في ذلك أجزاء من هذا التقرير، أو تحليل على مستوى الدولة، وحزمة بيانات Excel، بالإضافة إلى الاستفادة من العروض والخصومات الرائعة للشركات الناشئة والجامعات
سوق التشكيل: رؤى استراتيجية
-
احصل على أهم اتجاهات السوق الرئيسية لهذا التقرير.ستتضمن هذه العينة المجانية تحليلاً للبيانات، بدءًا من اتجاهات السوق وحتى التقديرات والتوقعات.
محركات وفرص سوق الصياغة
تزايد الطلب على الفولاذ المزور في صناعة السيارات
إن المتانة والموثوقية والقوة التي تتمتع بها المسبوكات الفولاذية تجعلها الخيار المفضل في صناعة السيارات. يعد الفولاذ المقاوم للصدأ والسبائك والفولاذ الكربوني من بين أنواع الفولاذ المستخدمة على نطاق واسع في صناعة السيارات لإنتاج مكونات مختلفة مثل قضبان التوصيل وأذرع التحكم وأذرع الروك وأعمدة الكرنك وأعمدة الكامات ونهايات قضبان التعادل ومفاصل التوجيه. يمكن لعملية تشكيل الفولاذ إنتاج أجزاء سيارات بأشكال شبه شبكية، ولا تتطلب المزيد من التشغيل من خلال طريقة القالب المغلق، وبالتالي توفير المال والوقت. كما يمكن استخدام طريقة التشكيل بالقالب المغلق لتخصيص جميع أنواع مكونات السيارات المصنوعة من سبائك الفولاذ، مثل فولاذ ASTM4140 وفولاذ AISI 1045. تُستخدم تقنيات تشكيل الفولاذ بالقالب المغلق في الغالب لتصنيع أجزاء السيارات لمختلف المركبات التجارية والركاب والمسبوكات الفولاذية خفيفة الوزن للسيارات الكهربائية ( EVs ). وبالتالي، فإن الاستخدام المتزايد للفولاذ المزور في صناعة السيارات يقود سوق التشكيل.
تحسين الظروف الاقتصادية والتقدم التكنولوجي في معدات وعمليات التشكيل
في الصناعات سريعة التطور، يتزايد الطلب على المنتجات المزورة المعقدة والمبتكرة. وقد لفتت عملية التشكيل بالقالب المغلق الآلي انتباه موردي المعدات نحو تطوير معدات التشكيل وعمليات التشكيل الجديدة. وفي تطبيقات الطيران التجاري، تستطيع آلات التشكيل الجديدة هذه تشكيل أجزاء كبيرة جدًا من سبائك النيكل والتيتانيوم. وفي الوقت الحالي، تتمتع الأتمتة في الصناعة بتأثير إيجابي معتدل على نمو سوق التشكيل بالقالب المغلق، ولكن من المتوقع أن يزداد خلال فترة التنبؤ.
وتشارك الشركات العاملة في هذا السوق في توفير عمليات تشكيل مرنة وقابلة للتكيف للحفاظ على المنافسة المتزايدة في سوق تشكيل المعادن. وعلاوة على ذلك، تشهد الصناعات النهائية مثل النفط والغاز وبناء السفن والسيارات وتوليد الطاقة والفضاء والبناء نموًا كبيرًا في دول مثل الهند والصين لمنتجات التشكيل بالقوالب المغلقة. وبالتالي، من المتوقع أن توفر الظروف الاقتصادية المحسنة والابتكارات التكنولوجية المستمرة في تقنيات التشكيل فرصًا في سوق التشكيل بالقوالب خلال فترة التنبؤ.
تحليل تجزئة تقرير سوق التشكيل
إن القطاعات الرئيسية التي ساهمت في استخلاص تحليل سوق التشكيل هي التقنية والمواد والصناعة.
- بناءً على التقنية، تم تقسيم سوق التشكيل إلى تشكيل مغلق، وتشكيل مفتوح، وتشكيل سلس. احتل قطاع التشكيل المغلق الحصة الأكبر في السوق في عام 2023.
- وفقًا للمواد، تم تقسيم سوق التشكيل إلى سبائك النيكل وسبائك التيتانيوم وسبائك الألومنيوم وسبائك الصلب وغيرها. احتل قطاع سبائك الصلب أكبر حصة في السوق في عام 2023.
- بحسب الصناعة، يتم تقسيم السوق إلى السيارات والفضاء والسكك الحديدية والمعدات الثقيلة وطاقة الرياح. سيطر قطاع السيارات على السوق في عام 2023.
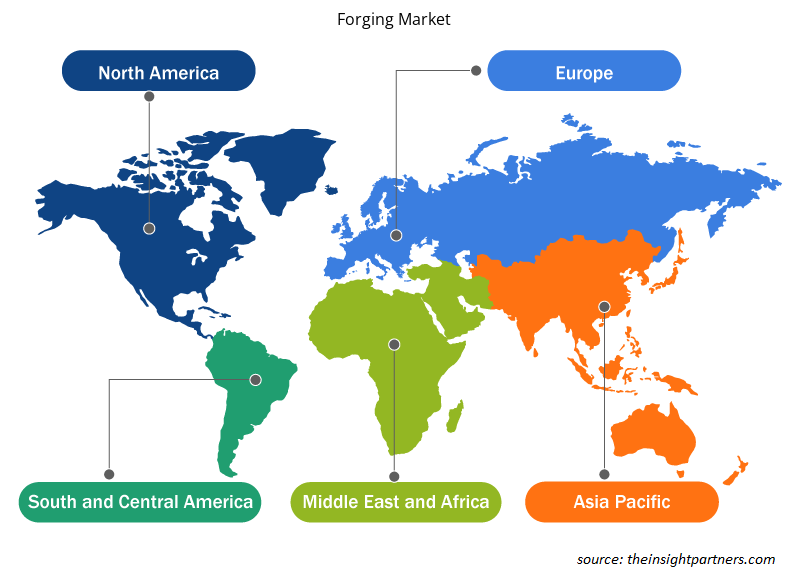
تحليل حصة سوق التشكيل حسب المنطقة الجغرافية
يتم تصنيف النطاق الجغرافي لتقرير سوق التشكيل بشكل أساسي إلى خمس مناطق: أمريكا الشمالية وأوروبا ومنطقة آسيا والمحيط الهادئ والشرق الأوسط وأفريقيا وأمريكا الجنوبية والوسطى.
سيطرت منطقة آسيا والمحيط الهادئ على سوق التشكيل بالطرق في عام 2023. يتم تقسيم سوق التشكيل بالطرق في منطقة آسيا والمحيط الهادئ إلى أستراليا والصين واليابان والهند وكوريا الجنوبية وبقية منطقة آسيا والمحيط الهادئ. من المتوقع أن يؤدي الطلب المتزايد على المكونات المعدنية المزورة من التطبيقات بما في ذلك السكك الحديدية والبناء وتوليد الطاقة والفضاء والسيارات إلى تغذية نمو سوق التشكيل بالطرق خلال فترة التنبؤ. تعد الصين المستهلك والمصنع الرئيسي للتشكيل بالطرق المعدنية في منطقة آسيا والمحيط الهادئ. تصدر الصين عددًا كبيرًا من المنتجات المزورة إلى الدول الأمريكية والأوروبية. يعد وجود العديد من الجمعيات في الصين التي تعمل على نمو عملية التشكيل بالطرق أحد العوامل الرئيسية التي تساهم في نمو سوق التشكيل بالطرق. علاوة على ذلك، بسبب ضغوط السوق والحكومة، تسعى صناعة التشكيل بالطرق في الصين إلى إنتاج تشكيلات بالطرق بدقة أعلى وكفاءة أعلى ورقمنة أكثر انتشارًا ووزنًا أخف واستهلاكًا أقل للطاقة. لوحظت العديد من الإنجازات الممتازة مؤخرًا في البحث والتطوير والتصنيع لآلات التشكيل بالطرق، وتطبيق المحاكاة، وتطبيق تكنولوجيا المعلومات وخاصة التشكيل بالطرق الدقيق.
رؤى إقليمية حول سوق التشكيل
لقد قام المحللون في Insight Partners بشرح الاتجاهات والعوامل الإقليمية المؤثرة على سوق التشكيل بالطرق طوال فترة التوقعات بشكل شامل. يناقش هذا القسم أيضًا قطاعات سوق التشكيل بالطرق والجغرافيا في جميع أنحاء أمريكا الشمالية وأوروبا ومنطقة آسيا والمحيط الهادئ والشرق الأوسط وأفريقيا وأمريكا الجنوبية والوسطى.
- احصل على البيانات الإقليمية المحددة لسوق التشكيل
نطاق تقرير سوق التشكيل
| سمة التقرير | تفاصيل |
|---|---|
| حجم السوق في عام 2023 | 78.1 مليار دولار أمريكي |
| حجم السوق بحلول عام 2031 | 124.7 مليار دولار أمريكي |
| معدل النمو السنوي المركب العالمي (2023 - 2031) | 6% |
| البيانات التاريخية | 2021-2022 |
| فترة التنبؤ | 2023-2031 |
| القطاعات المغطاة |
حسب التقنية
|
| المناطق والدول المغطاة |
أمريكا الشمالية
|
| قادة السوق وملفات تعريف الشركات الرئيسية |
|
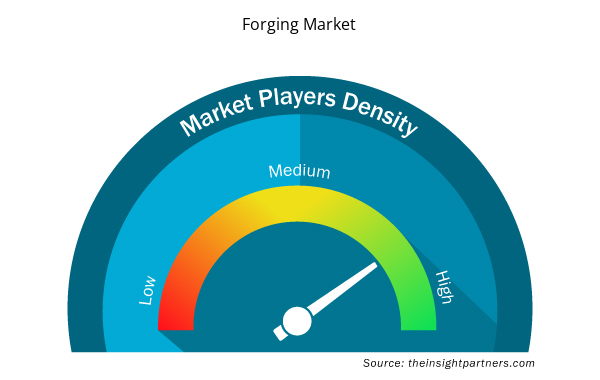
كثافة اللاعبين في سوق الصياغة: فهم تأثيرها على ديناميكيات الأعمال
يشهد سوق التشكيل بالطرق نموًا سريعًا، مدفوعًا بالطلب المتزايد من جانب المستخدم النهائي بسبب عوامل مثل تفضيلات المستهلكين المتطورة والتقدم التكنولوجي والوعي المتزايد بفوائد المنتج. ومع ارتفاع الطلب، تعمل الشركات على توسيع عروضها والابتكار لتلبية احتياجات المستهلكين والاستفادة من الاتجاهات الناشئة، مما يؤدي إلى زيادة نمو السوق.
تشير كثافة اللاعبين في السوق إلى توزيع الشركات أو المؤسسات العاملة في سوق أو صناعة معينة. وهي تشير إلى عدد المنافسين (اللاعبين في السوق) الموجودين في مساحة سوق معينة نسبة إلى حجمها أو قيمتها السوقية الإجمالية.
الشركات الرئيسية العاملة في سوق التشكيل هي:
- شركة ألكوا
- مجموعة كل المعادن والحديد
- شركة سي اف اس للآلات المحدودة
- فيسيب سبا
- بهارات فورج المحدودة
- شركة أليجيني للتكنولوجيا
إخلاء المسؤولية : الشركات المذكورة أعلاه ليست مرتبة بأي ترتيب معين.
- احصل على نظرة عامة على أهم اللاعبين الرئيسيين في سوق التشكيل
أخبار سوق التشكيل والتطورات الأخيرة
يتم تقييم سوق التشكيل بالطرق من خلال جمع البيانات النوعية والكمية بعد البحث الأولي والثانوي، والتي تتضمن منشورات الشركات المهمة وبيانات الجمعيات وقواعد البيانات. فيما يلي بعض التطورات في سوق التشكيل بالطرق:
- في أبريل 2024، وقعت شركة Ramkrishna Forgings اتفاقية توريد مع أكبر شركة مصنعة للسيارات الكهربائية للركاب في الولايات المتحدة. ومن خلال هذه الصفقة، ستقوم الشركة بتوريد مكونات مجموعة نقل الحركة والظهور لأول مرة كمورد في سوق السيارات الكهربائية في الولايات المتحدة.
- في فبراير 2024، أعلنت شركة US Forged Rings عن استثمار بقيمة 700 مليون دولار أمريكي في صناعة طاقة الرياح البحرية لبناء منشأة لتصنيع الأبراج ومصنع لتشكيل الصلب. ومن خلال هذا التطوير، ستعزز الشركة مكانتها في السوق.
تغطية تقرير سوق التشكيل والنتائج المتوقعة
يوفر تقرير "حجم سوق التشكيل والتوقعات (2021-2031)" تحليلاً مفصلاً للسوق يغطي المجالات التالية:
- حجم سوق الصياغة والتوقعات على المستويات العالمية والإقليمية والوطنية لجميع قطاعات السوق الرئيسية التي يغطيها النطاق
- صياغة اتجاهات السوق بالإضافة إلى ديناميكيات السوق مثل المحركات والقيود والفرص الرئيسية
- تحليل مفصل لقوى PEST/Porter الخمس وSWOT
- تحليل سوق التشكيل المعدني الذي يغطي اتجاهات السوق الرئيسية والإطار العالمي والإقليمي والجهات الفاعلة الرئيسية واللوائح والتطورات الأخيرة في السوق
- تحليل المشهد الصناعي والمنافسة الذي يغطي تركيز السوق، وتحليل خريطة الحرارة، واللاعبين البارزين، والتطورات الأخيرة لسوق التشكيل
- ملفات تعريف الشركة التفصيلية

نيفيديتا خبيرة أبحاث مُتميزة، تتمتع بخبرة تزيد عن 9 سنوات في أبحاث السوق واستشارات الأعمال. تشغل حاليًا منصب مديرة مشاريع في مجال تكنولوجيا المعلومات والاتصالات لدى شركة "ذا إنسايت بارتنرز"، وتتمتع بخبرة واسعة في إدارة وتنفيذ مهام الأبحاث المُجمعة والمُخصصة والقائمة على الاشتراكات والاستشارات في مختلف قطاعات التكنولوجيا.
بفضل سجلها الحافل في تقديم تحليلات قائمة على البيانات ورؤى عملية، ساهمت نيفيديتا بشكل رئيسي في العديد من المشاريع الحيوية. يشمل عملها تنفيذ المشاريع من البداية إلى النهاية، بدءًا من فهم أهداف العملاء، وتحليل اتجاهات السوق، وصولًا إلى استخلاص التوصيات الاستراتيجية. وقد تعاونت على نطاق واسع مع شركات رائدة في مجال تكنولوجيا المعلومات والاتصالات، مما ساعدها على تحديد فرص السوق ومواكبة تحولات القطاع.
تحمل نيفيديتا ماجستير إدارة أعمال في الإدارة من شركة "آي إم إس" في دهرادون. قبل انضمامها إلى "ذا إنسايت بارتنرز"، اكتسبت خبرة قيّمة في شركتي "ماركتس آند ماركتس" و"فيوتشر ماركت إنسايتس" في بونا، حيث شغلت مناصب بحثية مُختلفة وبنت أساسًا قويًا في تحليل القطاع والتفاعل مع العملاء.
- التحليل التاريخي (سنتان)، سنة الأساس، التوقعات (7 سنوات) مع معدل النمو السنوي المركب
- تحليل PEST و SWOT
- حجم السوق والقيمة / الحجم - عالمي، إقليمي، بلد
- الصناعة والمنافسة
- مجموعة بيانات إكسل
التقارير الحديثة
شهادات العملاء
تقرير سوق أنظمة SCADA من Insight Partners شامل، ويقدم رؤى قيّمة حول الاتجاهات الحالية والتوقعات المستقبلية. تميّز الفريق باحترافية عالية وسرعة في الاستجابة ودعم مستمر طوال الوقت. نحن راضون جدًا ونوصي بشدة بخدماتهم.
ران كيديم شريك, شركة ريالي تكنولوجيز المحدودةطلبتُ تقريرًا عن سوق برمجيات محدد، وأعدّه الفريق في غضون أيام قليلة. كانت المعلومات ذات صلة وثيقة وعرضها جيد. ثم طلبتُ بعض التعديلات والإضافات على التقرير. وكان الفريق متجاوبًا للغاية، وحصلتُ على التقرير النهائي في أقل من أسبوع.
جان هيرفيه جين رئيس مجلس الإدارة, فيوتشر أناليتيكاعملنا مع شركة "إنسايت بارتنرز" لإجراء دراسة سوقية وتوقعات مهمة. زودونا برؤى واضحة حول الفرص والمخاطر، مما ساعدنا في صياغة خططنا. كانت أبحاثهم سهلة الاستخدام ومبنية على بيانات دقيقة، مما ساعدنا على اتخاذ قرارات ذكية وواثقة. نوصي بهم بشدة.
بيوش ناجبال نائب الرئيس الأول, شعاع عالي عالميقدّمت شركة Insight Partners أبحاثًا سوقية ثاقبة ومنظمة جيدًا بخبرة واسعة في هذا المجال. تميّز فريقهم بالاحترافية وسرعة الاستجابة طوال الوقت. وسهّل موقعهم الإلكتروني سهل الاستخدام الوصول إلى تقارير القطاع. نوصي بهم بشدة لخدمات بحثية موثوقة وعالية الجودة.
يوكيهيكو أداتشي المدير التنفيذي, ديب بلو، ذ.م.م.هذه أول مرة أشتري فيها تقرير سوق من The Insight Partners. رغم أنني كنت مترددًا في البداية، إلا أنني زرت موقعهم الإلكتروني وشعرت براحة أكبر للمخاطرة وشراء تقرير السوق. أنا راضٍ تمامًا عن جودة التقرير وخدمة العملاء. كانت لديّ عدة أسئلة وتعليقات حول التقرير الأولي، ولكن بعد بضع محادثات عبر البريد الإلكتروني مع محللهم، أعتقد أن لديّ تقريرًا يمكنني استخدامه كمدخل لعملية التخطيط الاستراتيجي لدينا. شكرًا جزيلاً لكم على تخصيص وقتكم الإضافي وجعل هذه التجربة إيجابية. سأوصي بخدماتكم للآخرين بالتأكيد، وستكونون أول من ألجأ إليه عندما نحتاج إلى المزيد من بيانات السوق.
جون سوزوكي الرئيس والرئيس التنفيذي وعضو مجلس الإدارة, بي كيه تكنولوجيزأود أن أقدّر دعمكم واحترافيتكم في الاستجابة لطلبي للحصول على معلومات بشأن سوق التشخيص المخبري للأمراض المعدية في نيجيريا. كما أُقدّر صبركم وتوجيهكم، واستعدادكم لتقديم خصم، مما مكّننا في النهاية من إتمام الصفقة. أتطلع إلى التعامل مع "ذا إنسايت بارتنرز" مستقبلًا، كل ذلك بفضل الانطباع الذي تركتموه لديّ نتيجةً لهذا اللقاء الأول.
الدكتور تشيجيوك أونيا المدير الإداري, شركة باينكريست للرعاية الصحية المحدودةسبب الشراء
- اتخاذ قرارات مدروسة
- فهم ديناميكيات السوق
- تحليل المنافسة
- رؤى العملاء
- توقعات السوق
- تخفيف المخاطر
- التخطيط الاستراتيجي
- مبررات الاستثمار
- تحديد الأسواق الناشئة
- تحسين استراتيجيات التسويق
- تعزيز الكفاءة التشغيلية
- مواكبة التوجهات التنظيمية


 احصل على عينة مجانية ل - سوق التشكيل