استراتيجيات سوق عسل مانوكا، أفضل اللاعبين، فرص النمو، التحليل والتنبؤ بحلول عام 2028
البيانات التاريخية : | سنة الأساس : | فترة التنبؤ :توقعات سوق عسل مانوكا حتى عام ٢٠٢٨ - تأثير كوفيد-١٩ والتحليل العالمي حسب الطبيعة (عضوي وتقليدي)، والنوع (UMF ٥+/MGO ٨٣ ملغ/كغ (جزء في المليون)، UMF ١٠+/MGO ٢٦٣ ملغ/كغ (جزء في المليون)، UMF ١٥+/MGO ٥١٤ ملغ/كغ (جزء في المليون)، UMF ٢٠+/MGO ٨٢٩ ملغ/كغ (جزء في المليون))، وقنوات التوزيع (المتاجر الكبرى/الهايبر ماركت، متاجر التجزئة، المتاجر الإلكترونية، وغيرها)
- تاريخ التقرير : Apr 2026
- رمز التقرير : TIPRE00020682
- الفئة : المأكولات والمشروبات
- الحالة : قادم
- تنسيقات التقارير المتاحة :


- عدد الصفحات : 150
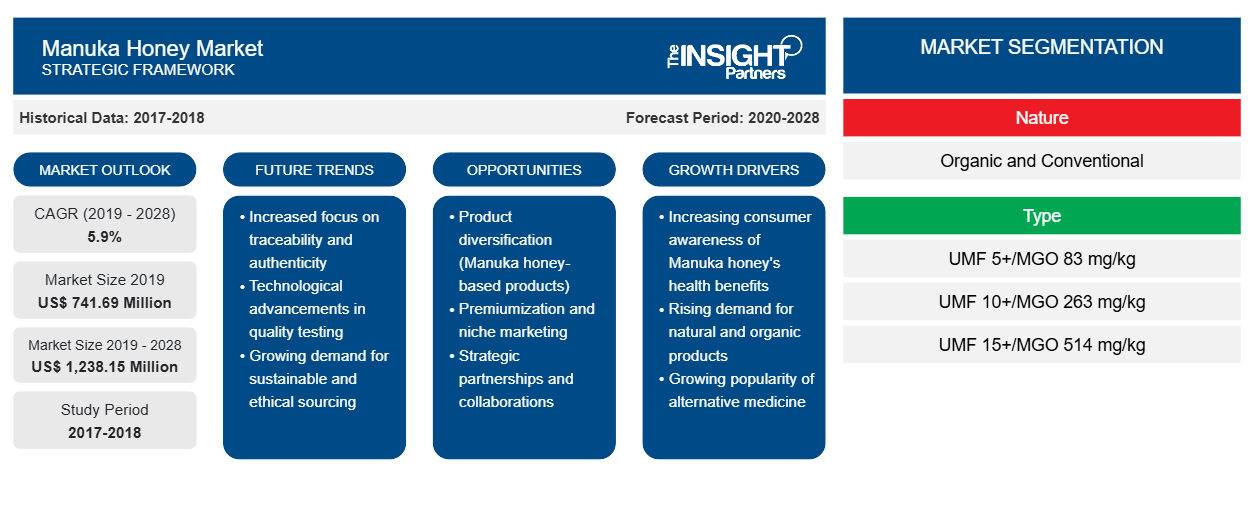
بلغت قيمة سوق عسل مانوكا 741.69 مليون دولار أمريكي في عام 2019، ومن المتوقع أن ينمو بمعدل نمو سنوي مركب نسبته 5.9٪ من عام 2020 إلى عام 2028.
يُصنع عسل مانوكا من رحيق شجرة المانوكا ولا يُنتج إلا في أستراليا ونيوزيلندا. المكون النشط الرئيسي في عسل مانوكا هو ميثيل جليوكسال . وهو مركب عضوي مضاد للبكتيريا يمكن استخدامه في الطب وفي الفوائد الصحية اليومية. إن نمط حياة المستهلك المتغير، والمخاوف الصحية المتزايدة، وتكاليف الرعاية الصحية المتزايدة، والتفضيل المتزايد لأسلوب حياة صحي ونشط هي العوامل الرئيسية التي تدفع الطلب على عسل مانوكا .
من المتوقع أن ينمو سوق عسل مانوكا في أمريكا الشمالية بأعلى معدل نمو سنوي مركب خلال الفترة المتوقعة. إن النمو السريع في احتياجات الأطفال للوجبات الخفيفة والزيادة في استهلاك الأطعمة الغنية بالعناصر الغذائية يغذي نمو سوق عسل مانوكا في أمريكا الشمالية. يستخدم عسل مانوكا في صنع ألواح الوجبات الخفيفة التي توفر الشركات وصفاتها. على سبيل المثال، تقدم Comvita وصفة ألواح مانوكا السحرية الحلوة والمالحة . تعد الولايات المتحدة سوقًا رئيسيًا لعسل مانوكا في منطقة أمريكا الشمالية، تليها كندا والمكسيك. يؤدي زيادة تركيز المستهلك على الحفاظ على اللياقة البدنية وتنظيم وزن الجسم إلى زيادة الطلب على المنتجات الغذائية الطبيعية، مما يدفع نمو سوق عسل مانوكا . إن وجود منافذ البيع بالتجزئة الحديثة مثل السوبر ماركت والهايبر ماركت في الولايات المتحدة وكندا يصب في صالح سوق عسل مانوكا في هذه البلدان.
قم بتخصيص هذا التقرير ليناسب متطلباتك
ستحصل على تخصيص لأي تقرير - مجانًا - بما في ذلك أجزاء من هذا التقرير، أو تحليل على مستوى الدولة، وحزمة بيانات Excel، بالإضافة إلى الاستفادة من العروض والخصومات الرائعة للشركات الناشئة والجامعات
سوق عسل مانوكا : رؤى استراتيجية
-
احصل على أهم اتجاهات السوق الرئيسية لهذا التقرير.ستتضمن هذه العينة المجانية تحليلاً للبيانات، بدءًا من اتجاهات السوق وحتى التقديرات والتوقعات.
تأثير فيروس كورونا المستجد (كوفيد-19) على سوق عسل مانوكا
اعتبارًا من مارس 2021، تعد الولايات المتحدة والبرازيل والهند وروسيا وإسبانيا والمملكة المتحدة من بين الدول الأكثر تضررًا من حيث الحالات المؤكدة والوفيات المبلغ عنها. لقد أثر فيروس كورونا المستجد على الاقتصادات والصناعات في مختلف البلدان بسبب عمليات الإغلاق وحظر السفر وإغلاق الشركات. تعد صناعة الأغذية والمشروبات واحدة من القطاعات المهمة التي تعاني من اضطرابات شديدة مثل انقطاع سلسلة التوريد وإغلاق مصانع الإنتاج وما إلى ذلك بسبب هذا التفشي. تعد الدول الآسيوية المركز العالمي للأغذية والمشروبات، وهي من بين أكبر موردي المواد الخام لمختلف الصناعات. يؤثر إغلاق المصانع والمصانع المختلفة في هذه البلدان على سلاسل التوريد العالمية ويؤثر سلبًا على التصنيع وجداول التسليم ومبيعات السلع المختلفة. أعلنت العديد من الشركات بالفعل عن تأخيرات محتملة في تسليم المنتجات وانخفاض في المبيعات المستقبلية لمنتجاتها. بالإضافة إلى ذلك، تعمل حظر السفر العالمي الذي فرضته دول في أوروبا وآسيا وأمريكا الشمالية على قمع فرص التعاون والشراكة التجارية. ومن ثم، فقد أدت هذه العوامل إلى الحد من نمو صناعة الأغذية والمشروبات، والأسواق الأخرى المرتبطة بهذه الصناعة.
رؤى السوق
زيادة استخدام عسل مانوكا في الصناعة الطبية
يعمل الباحثون والصيادلة في جميع أنحاء العالم على اكتشاف إمكانات عسل مانوكا في التركيبات الصيدلانية بسبب الوظائف المحسنة وقابلية تطبيق عسل مانوكا . تم فهم أهمية المنتجات العضوية في أعقاب المشكلات الصحية المزعجة إلى جانب الوعي المتزايد بشأن الشهادات العضوية والتفضيل للمنتجات عالية الجودة. تجعل الخصائص المضادة للبكتيريا لعسل مانوكا منه مكونًا مثاليًا للأدوية. علاوة على ذلك، يتم استخدامه كمرهم طبيعي لجميع أنواع الإصابات وقد تم الاعتراف به كمقاتل فيروسي في عصر مقاومة المضادات الحيوية التقليدية. تتوفر المنتجات الطبية لعسل مانوكا في شكل أنابيب وأقراص وكبسولات وجيل ناعم وحلوى صمغية وغيرها. يمكن لهذه المنتجات الطبية علاج العديد من المشكلات الصحية، مثل الوقاية من حب الشباب والجيوب الأنفية والتهاب الحلق وعلاج مجموعة واسعة من الجروح الجراحية والمزمنة. تشمل المزايا الأخرى لعسل مانوكا تطهير الالتهابات وإزالة البقع على الجلد والمساعدة في التئام الجروح والخدوش وتخفيف آلام المعدة وتعزيز جهاز المناعة وتوفير الطاقة وتحسين الهضم.
ربما يكون عسل مانوكا هو أكثر المنتجات الطبية تحفيزًا والتي تستخدم في المستشفيات لعلاج التهابات الجلد وشفاء الجروح، وخاصة تلك التي لا تستجيب للعلاجات القياسية مثل البكتيريا المقاومة للمضادات الحيوية. تعد مقاومة المضادات الحيوية المتزايدة حاليًا واحدة من أكثر مشكلات الصحة البشرية انتشارًا في العالم. إن نمط حياة المستهلك المتغير، والمخاوف الصحية المتزايدة، وزيادة تكاليف الرعاية الصحية، والتفضيل المتزايد لأسلوب حياة صحي ونشط هي العوامل الرئيسية التي تدفع الطلب على عسل مانوكا . لذلك، من المتوقع أن يؤدي الاستخدام القوي لعسل مانوكا في جميع الظروف الصحية تقريبًا إلى جانب تفضيل المستهلك المتزايد للعسل لتحقيق حياة نشطة وخالية من الأمراض، إلى دفع الطلب على عسل مانوكا في الصناعة الطبية في السنوات القادمة.
رؤى المصدر
استنادًا إلى الطبيعة، تم تقسيم سوق عسل مانوكا إلى عضوي وتقليدي. استحوذ القطاع التقليدي على حصة سوقية أكبر في عام 2019، ومن المتوقع أن يسجل القطاع العضوي معدل نمو سنوي مركب أعلى في السوق خلال فترة التوقعات. الزراعة العضوية هي التقنية التي تنطوي على إنتاج عسل مانوكا دون استخدام الأسمدة الاصطناعية أو المبيدات الحشرية أو منظمات النمو على الأراضي الزراعية. يحتوي عسل مانوكا العضوي على جزيء عضوي يسمى ميثيل جليوكسال (MG)، وهو مكون مضاد للبكتيريا. يعزز عسل مانوكا جهاز المناعة من خلال تعزيز مقاومة الالتهابات الشائعة وتعزيز الحروق الخفيفة أو الجروح والتهاب الحلق. زاد معدل الزراعة العضوية لعسل مانوكا مع زيادة مساحة الزراعة والدعم المتزايد من شركة المعالجة. العامل الرئيسي الذي يؤثر على المزارعين لتبني الزراعة العضوية هو التفضيل المتزايد للمنتجات العضوية والصحية. لقد أدى الطلب المتزايد من المستهلكين على عسل مانوكا العضوي إلى تحفيز الشركات والمزارعين على تعزيز الزراعة العضوية، وبالتالي دفع نمو القطاع.
رؤى النوع
بناءً على النوع، تم تقسيم سوق عسل مانوكا إلى UMF 5+/MGO 83 مجم/كجم (جزء في المليون)، وUMF 10+/MGO 263 مجم/كجم (جزء في المليون)، وUMF 15+/MGO 514 مجم/كجم (جزء في المليون)، وUMF 20+/MGO 829 مجم/كجم (جزء في المليون). استحوذت شريحة UMF 15+/MGO 514 مجم/كجم (جزء في المليون) على حصة سوقية أكبر في عام 2019، ومن المتوقع أن تسجل شريحة UMF 20+/MGO 829 مجم/كجم (جزء في المليون) أعلى معدل نمو سنوي مركب في السوق خلال فترة التوقعات. يحتوي عسل مانوكا UMF 15+/MGO 514 مجم/كجم (جزء في المليون) على مستويات لا تقل عن 514 مجم/كجم من MGO (ميثيل جليوكسال). إنه عسل مانوكا نقي ممتاز يوفر فعالية عالية النطاق. يوفر مستوى UMF العالي لتركيز مانوكا نكهة عشبية ولونًا داكنًا لعسل مانوكا UMF 15+/MGO 514 مجم/كجم (جزء في المليون). تقدم الشركات المصنعة عسل مانوكا UMF 15+/MGO 514 مجم/كجم (جزء في المليون)، وهو عسل غير مبستر بالكامل وغير معدّل وراثيًا. كما أنها تتجنب المعالجة الحرارية الزائدة، والتي يمكن أن تلحق الضرر بمستويات UMF وجودة العسل. إن توافر عسل مانوكا UMF 15+/MGO 514 مجم/كجم (جزء في المليون) غير المبستر وغير المعدّل وراثيًا بدون أي إضافات أو مواد حافظة يزيد من شعبية عسل مانوكا UMF 15+/MGO 514 مجم/كجم (جزء في المليون) بين المستهلكين، وبالتالي دفع نمو القطاع.
رؤى حول قنوات التوزيع
بناءً على قناة التوزيع، تم تقسيم سوق عسل مانوكا إلى محلات السوبر ماركت/الهايبر ماركت ومتاجر التجزئة والمتاجر عبر الإنترنت وغيرها. استحوذ قطاع محلات السوبر ماركت/الهايبر ماركت على أكبر حصة سوقية في عام 2019، ومن المتوقع أن يسجل قطاع الإنترنت أعلى معدل نمو سنوي مركب في السوق خلال فترة التوقعات. تتزايد مبيعات عسل مانوكا في محلات السوبر ماركت/الهايبر ماركت بسبب زيادة الإقبال على هذه الأماكن، وخاصة من المشترين من الطبقة المتوسطة. يسهل الإقبال الكبير على محلات السوبر ماركت/الهايبر ماركت على الشركات المصنعة استهداف قاعدة عملائها. كما شجع التوافر الواسع لمنتجات عسل مانوكا من مختلف العلامات التجارية العملاء على شراء عسل مانوكا من محلات السوبر ماركت/الهايبر ماركت.
تشمل الشركات العاملة في سوق عسل مانوكا شركة Arataki Honey، وCapilano Honey Ltd.، وCOMVITA، وKirksbees Honey، وManuka Health، وMidland Holdings، وOha Honey. وتنفذ الشركات الرئيسية عمليات الدمج والاستحواذ، واستراتيجيات البحث والتطوير لتوسيع قاعدة العملاء والحصول على حصة كبيرة في السوق العالمية، مما يسمح لها أيضًا بالحفاظ على اسم علامتها التجارية عالميًا.
تقرير يسلط الضوء على
- اتجاهات الصناعة التقدمية في سوق عسل المانوكا لمساعدة اللاعبين على تطوير استراتيجيات فعالة طويلة الأجل
- استراتيجيات نمو الأعمال التي تتبناها الأسواق المتقدمة والنامية
- التحليل الكمي لسوق عسل المانوكا من عام 2018 إلى عام 2028
- تقدير الطلب العالمي على عسل المانوكا
- تحليل PEST لتوضيح فعالية المشترين والموردين العاملين في الصناعة
- التطورات الأخيرة لفهم سيناريو السوق التنافسي
- اتجاهات السوق وتوقعاتها بالإضافة إلى العوامل التي تدفع وتكبح نمو سوق عسل المانوكا
- المساعدة في عملية اتخاذ القرار من خلال تسليط الضوء على استراتيجيات السوق التي تدعم المصلحة التجارية، مما يؤدي إلى نمو السوق
- حجم سوق عسل المانوكا في مختلف العقد
- نظرة عامة مفصلة وتقسيم السوق، بالإضافة إلى ديناميكيات صناعة عسل المانوكا
- حجم سوق عسل المانوكا في مختلف المناطق مع فرص نمو واعدة
نظرة إقليمية على سوق عسل مانوكا
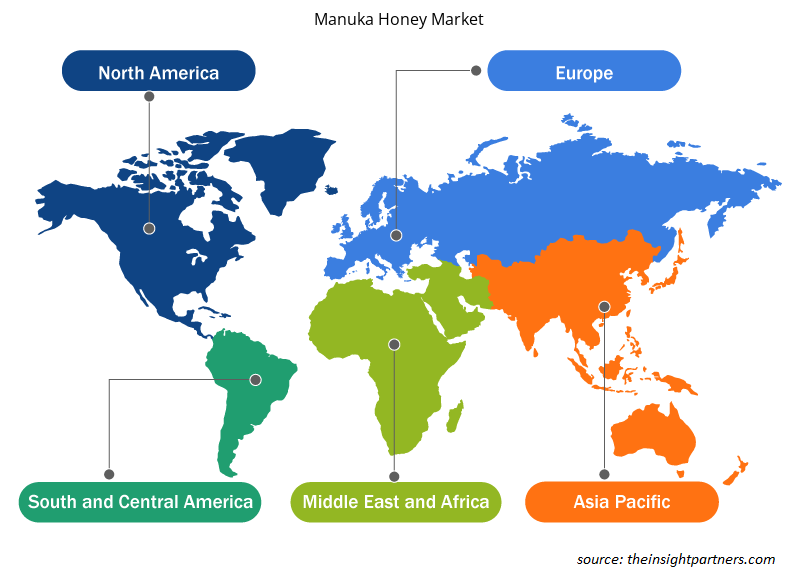
لقد قام المحللون في Insight Partners بشرح الاتجاهات والعوامل الإقليمية المؤثرة على سوق عسل مانوكا طوال فترة التوقعات بشكل شامل. يناقش هذا القسم أيضًا قطاعات سوق عسل مانوكا والجغرافيا في جميع أنحاء أمريكا الشمالية وأوروبا ومنطقة آسيا والمحيط الهادئ والشرق الأوسط وأفريقيا وأمريكا الجنوبية والوسطى.
- احصل على البيانات الإقليمية المحددة لسوق عسل مانوكا
نطاق تقرير سوق عسل مانوكا
| سمة التقرير | تفاصيل |
|---|---|
| حجم السوق في عام 2019 | 741.69 مليون دولار أمريكي |
| حجم السوق بحلول عام 2028 | 1,238.15 مليون دولار أمريكي |
| معدل النمو السنوي المركب العالمي (2019 - 2028) | 5.9% |
| البيانات التاريخية | 2017-2018 |
| فترة التنبؤ | 2020-2028 |
| القطاعات المغطاة |
بالطبيعة
|
| المناطق والدول المغطاة |
أمريكا الشمالية
|
| قادة السوق وملفات تعريف الشركات الرئيسية |
|
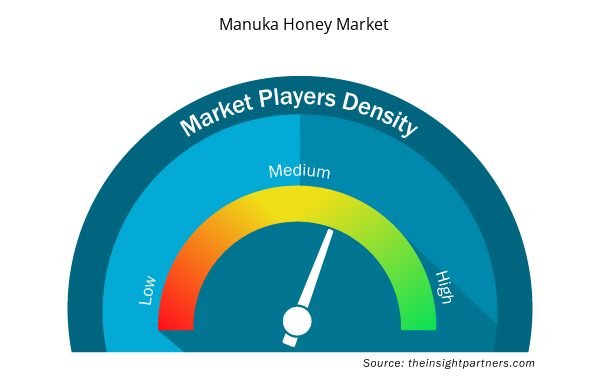
كثافة اللاعبين في سوق عسل مانوكا: فهم تأثيرها على ديناميكيات الأعمال
يشهد سوق عسل مانوكا نموًا سريعًا، مدفوعًا بالطلب المتزايد من جانب المستخدم النهائي بسبب عوامل مثل تفضيلات المستهلكين المتطورة والتقدم التكنولوجي والوعي المتزايد بفوائد المنتج. ومع ارتفاع الطلب، تعمل الشركات على توسيع عروضها والابتكار لتلبية احتياجات المستهلكين والاستفادة من الاتجاهات الناشئة، مما يؤدي إلى زيادة نمو السوق.
تشير كثافة اللاعبين في السوق إلى توزيع الشركات أو المؤسسات العاملة في سوق أو صناعة معينة. وهي تشير إلى عدد المنافسين (اللاعبين في السوق) الموجودين في مساحة سوق معينة نسبة إلى حجمها أو قيمتها السوقية الإجمالية.
الشركات الرئيسية العاملة في سوق عسل مانوكا هي:
- عسل أراتاكي
- شركة كابيلانو للعسل المحدودة
- كومفيتا
- عسل كيركسبيز
- مانوكا هيلث
إخلاء المسؤولية : الشركات المذكورة أعلاه ليست مرتبة بأي ترتيب معين.
- احصل على نظرة عامة على أهم اللاعبين الرئيسيين في سوق عسل مانوكا
سوق عسل مانوكا – من الطبيعة
- عضوي
- عادي
سوق عسل مانوكا – حسب النوع
- UMF 5+/MGO 83 مجم/كجم (جزء في المليون)
- UMF 10+/MGO 263 مجم/كجم (جزء في المليون)
- UMF 15+/MGO 514 مجم/كجم (جزء في المليون)
- UMF 20+/MGO 829 مجم/كجم (جزء في المليون)
سوق عسل مانوكا – حسب قناة التوزيع
- محلات السوبر ماركت/الهايبر ماركت
- متاجر التجزئة
- المتاجر الإلكترونية
- آحرون
نبذة عن الشركة
- عسل أراتاكي
- شركة كابيلانو للعسل المحدودة
- كومفيتا
- عسل كيركسبيز
- مانوكا هيلث
- ميدلاند القابضة
- عسل أوها
- عسل نقي من نيوزيلندا
- شركة ستريملاند للتكنولوجيا البيولوجية المحدودة
- واتسون وأولاده

حابي محلل أبحاث سوق متمرس، يتمتع بخبرة 8 سنوات في قطاع الكيماويات والمواد، بالإضافة إلى خبرته في قطاعي الأغذية والمشروبات والسلع الاستهلاكية. وهو مهندس كيميائي من معهد فيشواكارما للتكنولوجيا (VIT)، وقد اكتسب معرفةً عميقةً في مجالات الكيماويات الصناعية والتخصصية، والدهانات والطلاءات، والورق والتغليف، ومواد التشحيم، والمنتجات الاستهلاكية.
تشمل كفاءات حابي الأساسية تقدير حجم السوق والتنبؤ به، ووضع معايير تنافسية، وتحليل الاتجاهات، والتفاعل مع العملاء، وكتابة التقارير، وتنسيق الفريق، مما يجعله بارعًا في تقديم رؤى عملية ودعم اتخاذ القرارات الاستراتيجية.
- التحليل التاريخي (سنتان)، سنة الأساس، التوقعات (7 سنوات) مع معدل النمو السنوي المركب
- تحليل PEST و SWOT
- حجم السوق والقيمة / الحجم - عالمي، إقليمي، بلد
- الصناعة والمنافسة
- مجموعة بيانات إكسل
التقارير الحديثة
شهادات العملاء
تقرير سوق أنظمة SCADA من Insight Partners شامل، ويقدم رؤى قيّمة حول الاتجاهات الحالية والتوقعات المستقبلية. تميّز الفريق باحترافية عالية وسرعة في الاستجابة ودعم مستمر طوال الوقت. نحن راضون جدًا ونوصي بشدة بخدماتهم.
ران كيديم شريك, شركة ريالي تكنولوجيز المحدودةطلبتُ تقريرًا عن سوق برمجيات محدد، وأعدّه الفريق في غضون أيام قليلة. كانت المعلومات ذات صلة وثيقة وعرضها جيد. ثم طلبتُ بعض التعديلات والإضافات على التقرير. وكان الفريق متجاوبًا للغاية، وحصلتُ على التقرير النهائي في أقل من أسبوع.
جان هيرفيه جين رئيس مجلس الإدارة, فيوتشر أناليتيكاعملنا مع شركة "إنسايت بارتنرز" لإجراء دراسة سوقية وتوقعات مهمة. زودونا برؤى واضحة حول الفرص والمخاطر، مما ساعدنا في صياغة خططنا. كانت أبحاثهم سهلة الاستخدام ومبنية على بيانات دقيقة، مما ساعدنا على اتخاذ قرارات ذكية وواثقة. نوصي بهم بشدة.
بيوش ناجبال نائب الرئيس الأول, شعاع عالي عالميقدّمت شركة Insight Partners أبحاثًا سوقية ثاقبة ومنظمة جيدًا بخبرة واسعة في هذا المجال. تميّز فريقهم بالاحترافية وسرعة الاستجابة طوال الوقت. وسهّل موقعهم الإلكتروني سهل الاستخدام الوصول إلى تقارير القطاع. نوصي بهم بشدة لخدمات بحثية موثوقة وعالية الجودة.
يوكيهيكو أداتشي المدير التنفيذي, ديب بلو، ذ.م.م.هذه أول مرة أشتري فيها تقرير سوق من The Insight Partners. رغم أنني كنت مترددًا في البداية، إلا أنني زرت موقعهم الإلكتروني وشعرت براحة أكبر للمخاطرة وشراء تقرير السوق. أنا راضٍ تمامًا عن جودة التقرير وخدمة العملاء. كانت لديّ عدة أسئلة وتعليقات حول التقرير الأولي، ولكن بعد بضع محادثات عبر البريد الإلكتروني مع محللهم، أعتقد أن لديّ تقريرًا يمكنني استخدامه كمدخل لعملية التخطيط الاستراتيجي لدينا. شكرًا جزيلاً لكم على تخصيص وقتكم الإضافي وجعل هذه التجربة إيجابية. سأوصي بخدماتكم للآخرين بالتأكيد، وستكونون أول من ألجأ إليه عندما نحتاج إلى المزيد من بيانات السوق.
جون سوزوكي الرئيس والرئيس التنفيذي وعضو مجلس الإدارة, بي كيه تكنولوجيزأود أن أقدّر دعمكم واحترافيتكم في الاستجابة لطلبي للحصول على معلومات بشأن سوق التشخيص المخبري للأمراض المعدية في نيجيريا. كما أُقدّر صبركم وتوجيهكم، واستعدادكم لتقديم خصم، مما مكّننا في النهاية من إتمام الصفقة. أتطلع إلى التعامل مع "ذا إنسايت بارتنرز" مستقبلًا، كل ذلك بفضل الانطباع الذي تركتموه لديّ نتيجةً لهذا اللقاء الأول.
الدكتور تشيجيوك أونيا المدير الإداري, شركة باينكريست للرعاية الصحية المحدودةسبب الشراء
- اتخاذ قرارات مدروسة
- فهم ديناميكيات السوق
- تحليل المنافسة
- رؤى العملاء
- توقعات السوق
- تخفيف المخاطر
- التخطيط الاستراتيجي
- مبررات الاستثمار
- تحديد الأسواق الناشئة
- تحسين استراتيجيات التسويق
- تعزيز الكفاءة التشغيلية
- مواكبة التوجهات التنظيمية


 احصل على عينة مجانية ل - سوق عسل مانوكا