نظرة عامة على سوق التنقل الذكي والنمو والاتجاهات والتحليل والتقرير البحثي (2021-2028)
البيانات التاريخية : 2019-2020 | سنة الأساس : 2021 | فترة التنبؤ : 2022-2028توقعات سوق التنقل الذكي حتى عام 2028 - تأثير كوفيد-19 والتحليل العالمي حسب النوع (مشاركة السيارات، مشاركة الشاحنات، مشاركة الدراجات، المترو، وغيرها)، والحلول (تطبيقات الجوال، إدارة مواقف السيارات، إدارة المرور، وغيرها)، والمستخدم النهائي (الأفراد والشركات)
- تاريخ التقرير : Apr 2022
- رمز التقرير : TIPRE00009536
- الفئة : السيارات والنقل
- الحالة : نُشرت
- تنسيقات التقارير المتاحة :


- عدد الصفحات : 155
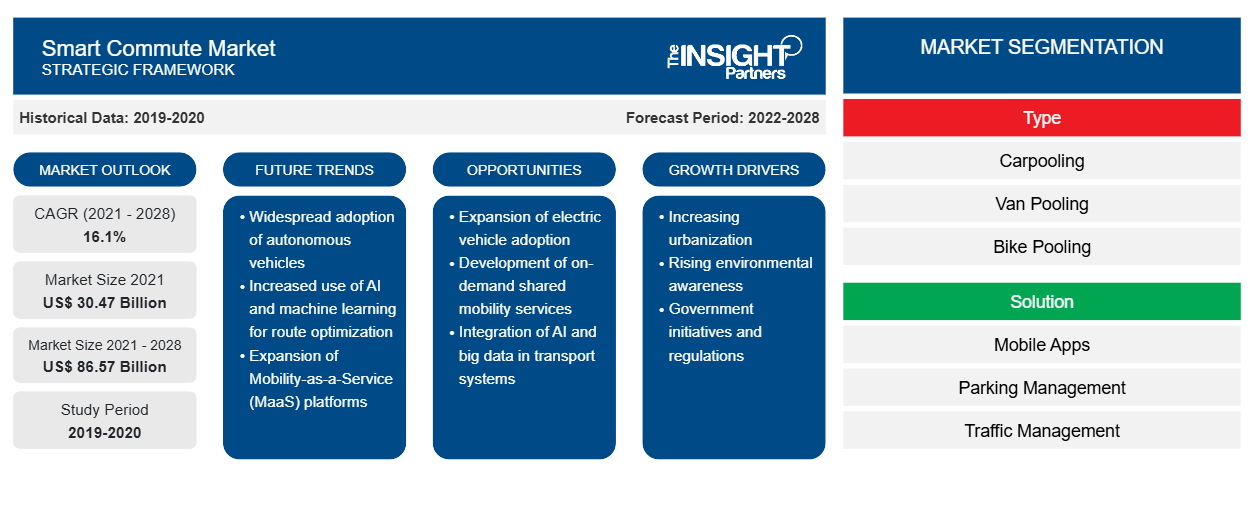
من المتوقع أن ينمو سوق التنقل الذكي من 30,469.49 مليون دولار أمريكي في عام 2021 إلى 86,568.73 مليون دولار أمريكي بحلول عام 2028؛ ومن المتوقع أن ينمو بمعدل نمو سنوي مركب قدره 16.1٪ من عام 2021 إلى عام 2028.
يُعرَّف التنقل الذكي بأنه السفر بانتظام عبر مشاركة السيارات أو مشاركة الشاحنات أو ركوب الدراجات أو الدراجات الهوائية أو ركوب المترو. وقد طورت شركات النقل العام والحكومات وأصحاب المصلحة الآخرون استراتيجية كاملة تأخذ في الاعتبار السفر الذكي وتشاركها مع الجمهور لبناء وسائل نقل أكثر قوة في المناطق الحضرية. يؤثر التنقل الذكي بشكل إيجابي على البيئة من خلال تقليل الازدحام المروري والحد من انبعاثات الغازات المسببة للانحباس الحراري العالمي.
تتوفر خيارات التنقل الصديقة للبيئة مثل مشاركة السيارات، ومشاركة الدراجات ، ومشاركة الحافلات الصغيرة ، وغيرها من خيارات التنقل الصديقة للبيئة من خلال خدمات التنقل الذكية. فهي توفر لموظفي المكاتب خيار نقل لاختيار مسار تنقل أكثر فعالية يقلل من الازدحام المروري ونفقات النقل. ومن العوامل التي تعزز نمو سوق التنقل الذكي العدد المتزايد من سكان المدن، مما يؤدي إلى زيادة معدلات الأجيال. وقد اكتسبت خدمات النقل المشتركة قبولاً عالميًا وتشجعها الحكومات والهيئات البيئية لأنها تساعد في تقليل الانبعاثات. كما أنها تسمح بعدد أقل من السيارات الخاصة، وهو ما من المتوقع أن يغذي نمو سوق التنقل الذكي في السنوات القادمة.
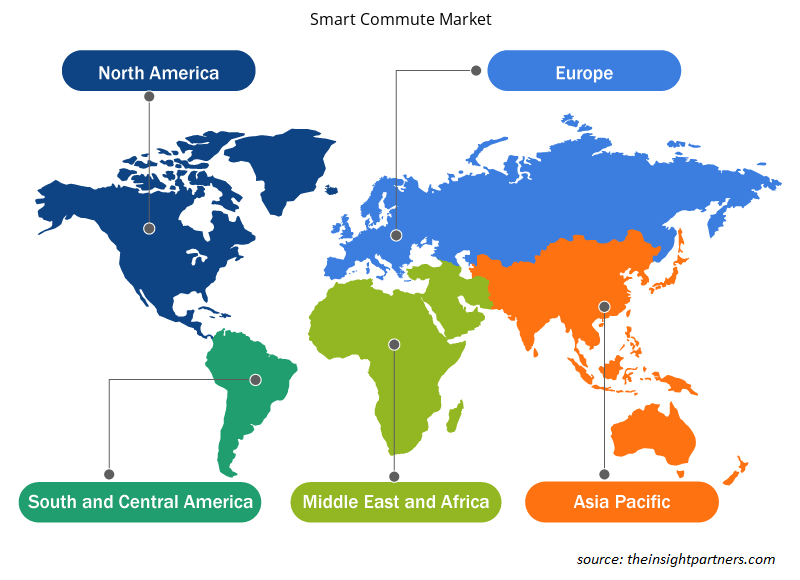
في أمريكا الشمالية، تم تعزيز الحاجة إلى التنقل الذكي من خلال التفضيل المتزايد لخدمات مشاركة السيارات بين ركاب المكاتب والتي من شأنها تخفيف الازدحام المروري ومنع الضرر البيئي. علاوة على ذلك، فإن ارتفاع صناعة السياحة والتقدم التكنولوجي والسياسات الحكومية المواتية هي عوامل أخرى تدفع نمو سوق التنقل الذكي في أمريكا الشمالية . في أوروبا، من المتوقع أن يؤدي ارتفاع اتجاه التنقل كخدمة وزيادة قاعدة مستخدمي خدمات مشاركة الرحلات إلى خلق فرص مربحة للاعبين في السوق.
في أوروبا، وبسبب المخاوف المتزايدة بشأن الانحباس الحراري العالمي، والازدحام المروري، والاعتماد على الطاقة الأجنبية، أصبحت المركبات الذكية أكثر شعبية. وقد أدت ممارسة فرض رسوم المرور على السيارات التي تقل راكباً واحداً، والتي فُرضت في عام 2012، إلى زيادة هائلة في استخدام المركبات الذكية للتنقل من قِبَل المستهلكين الأوروبيين.
قم بتخصيص هذا التقرير ليناسب متطلباتك
ستحصل على تخصيص لأي تقرير - مجانًا - بما في ذلك أجزاء من هذا التقرير، أو تحليل على مستوى الدولة، وحزمة بيانات Excel، بالإضافة إلى الاستفادة من العروض والخصومات الرائعة للشركات الناشئة والجامعات
سوق التنقل الذكي: رؤى استراتيجية
- احصل على أهم اتجاهات السوق الرئيسية لهذا التقرير.ستتضمن هذه العينة المجانية تحليلاً للبيانات، بدءًا من اتجاهات السوق وحتى التقديرات والتوقعات.
:
تأثير جائحة كوفيد-19 على سوق التنقل الذكي
كان لتفشي فيروس كورونا تأثير كبير على قطاع النقل. فقد انخفض الطلب على خدمات مشاركة السيارات والحافلات الصغيرة على مستوى العالم في عام 2020 بسبب فيروس كورونا. وشهد سوق التنقل الذكي في جميع أنحاء العالم انخفاضًا كبيرًا في توليد الإيرادات في عام 2020 مقارنة بعام 2019، ويرجع ذلك جزئيًا إلى عمليات الإغلاق وإحجام العملاء عن استخدام خدمات مشاركة الرحلات حتى بعد رفع اللوائح. تحاول شركات مشاركة الرحلات دائمًا الحفاظ على ثقة السائق والركاب من حيث السلامة والصرف الصحي.
رؤى السوق – سوق التنقل الذكي
الاتجاه المتزايد نحو التنقل كخدمة
إن الأشخاص غير القادرين على شراء سيارة يمكنهم تجربة السفر السلس من خلال خدمات التنقل. ووفقًا لمكتب إحصاءات النقل، فإن متوسط تكلفة امتلاك وتشغيل مركبة يبلغ حوالي 8858 دولارًا، بافتراض 15000 كيلومتر من القيادة سنويًا. تعمل خدمة التنقل كخدمة على تقليل هذه التكاليف للمستخدم من خلال تعظيم استخدام خدمات النقل مثل مشاركة السيارات وطلب الركوب. كما أنها تقلل من الازدحام المروري والانبعاثات الكلية للسيارات في المدن. ونتيجة لذلك، تعمل خدمة مشاركة السيارات وطلب الركوب المدعومة رقميًا على إدارة متطلبات النقل بكفاءة وتوفر بديلاً ملائمًا وصديقًا للبيئة لملكية السيارات الخاصة. وعلاوة على ذلك، وفقًا للإحصاءات، يعيش 55٪ من سكان العالم حاليًا في المدن، وتشير التقديرات إلى أنه بحلول عام 2050، سيعيش حوالي 68٪ من السكان في المدن. إن الوتيرة السريعة للتحضر تؤدي بالفعل إلى ازدحام مروري. قد يكون مفهوم التنقل كخدمة خيارًا أفضل للحد من الازدحام المروري من خلال الاستفادة بشكل أكبر من البنية التحتية للنقل العام والخاص القائمة. من المتوقع أن يؤدي الطلب العاجل على حلول فعالة للتعامل مع حركة المرور في المدن الذكية بطريقة أسرع وأقل تكلفة وأكثر ملاءمة إلى تعزيز نمو سوق التنقل كخدمة بحلول عام 2028. لذلك، من المتوقع أن يؤدي الاتجاه المتزايد للتنقل كخدمة (MaaS) إلى تعزيز نمو سوق التنقل الذكي العالمي.
رؤى حول سوق التنقل الذكي القائم على النوع
بناءً على النوع، يتم تقسيم سوق التنقل الذكي إلى مشاركة السيارات، ومشاركة الشاحنات، ومشاركة الدراجات، والمترو، وغيرها. ومن المتوقع أن يستحوذ قطاع مشاركة السيارات على حصة كبيرة في سوق التنقل الذكي العالمي، ومن المتوقع أن ينمو بمعدل نمو سنوي مركب مرتفع. يتم تعريف التنقل الذكي على أنه السفر بانتظام من نقطة إلى أخرى عبر مشاركة السيارات، أو مشاركة الشاحنات، أو ركوب الدراجات، أو ركوب الدراجات، أو ركوب المترو.
رؤى السوق حول حلول التنقل الذكي القائمة على الحلول
بناءً على الحل، يتم تقسيم سوق التنقل الذكي إلى تطبيقات الهاتف المحمول وإدارة مواقف السيارات وإدارة المرور وغيرها. ومن المتوقع أن يستحوذ قطاع تطبيقات الهاتف المحمول على حصة كبيرة في سوق التنقل الذكي العالمي، ومن المتوقع أن ينمو بأعلى معدل نمو سنوي مركب. هناك استخدام متزايد لتطبيقات الهاتف المحمول في وضع السفر بالسيارات لتقليل وقت السفر والتكلفة وانبعاثات المركبات.
رؤى السوق حول التنقل الذكي المستند إلى المستخدم النهائي
بناءً على المستخدم النهائي، ينقسم سوق التنقل الذكي إلى قطاع شخصي وقطاع مؤسساتي. ومن المتوقع أن يستحوذ قطاع المؤسساتي على حصة كبيرة في سوق التنقل الذكي العالمي، ومن المتوقع أن ينمو بمعدل نمو سنوي مركب أعلى.
رؤى إقليمية حول سوق التنقل الذكي
لقد قام المحللون في Insight Partners بشرح الاتجاهات والعوامل الإقليمية المؤثرة على سوق التنقل الذكي طوال فترة التوقعات بشكل شامل. يناقش هذا القسم أيضًا قطاعات سوق التنقل الذكي والجغرافيا في جميع أنحاء أمريكا الشمالية وأوروبا ومنطقة آسيا والمحيط الهادئ والشرق الأوسط وأفريقيا وأمريكا الجنوبية والوسطى.
- احصل على البيانات الإقليمية المحددة لسوق التنقل الذكي
نطاق تقرير سوق التنقل الذكي
| سمة التقرير | تفاصيل |
|---|---|
| حجم السوق في عام 2021 | 30.47 مليار دولار أمريكي |
| حجم السوق بحلول عام 2028 | 86.57 مليار دولار أمريكي |
| معدل النمو السنوي المركب العالمي (2021 - 2028) | 16.1% |
| البيانات التاريخية | 2019-2020 |
| فترة التنبؤ | 2022-2028 |
| القطاعات المغطاة | حسب النوع
|
| المناطق والدول المغطاة | أمريكا الشمالية
|
| قادة السوق وملفات تعريف الشركات الرئيسية |
|
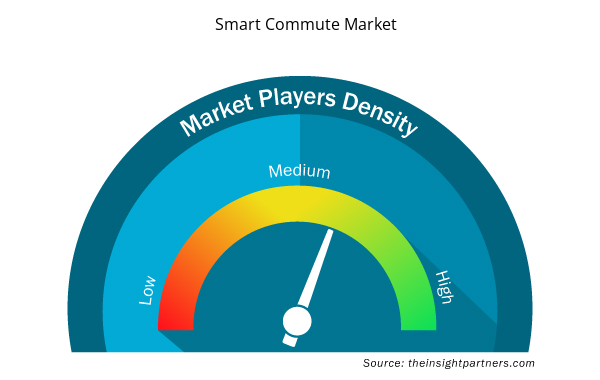
كثافة اللاعبين في سوق التنقل الذكي: فهم تأثيرها على ديناميكيات الأعمال
يشهد سوق التنقل الذكي نموًا سريعًا، مدفوعًا بالطلب المتزايد من المستخدم النهائي بسبب عوامل مثل تفضيلات المستهلكين المتطورة والتقدم التكنولوجي والوعي المتزايد بفوائد المنتج. ومع ارتفاع الطلب، تعمل الشركات على توسيع عروضها والابتكار لتلبية احتياجات المستهلكين والاستفادة من الاتجاهات الناشئة، مما يؤدي إلى زيادة نمو السوق.
تشير كثافة اللاعبين في السوق إلى توزيع الشركات أو المؤسسات العاملة في سوق أو صناعة معينة. وهي تشير إلى عدد المنافسين (اللاعبين في السوق) الموجودين في مساحة سوق معينة نسبة إلى حجمها أو قيمتها السوقية الإجمالية.
الشركات الرئيسية العاملة في سوق التنقل الذكي هي:
- بلابلاكار
- التنقل الذكي
- شركة إنتربرايز القابضة
- شركة إي بولرز للتكنولوجيا المحدودة
- شركة جولدن كونكورد القابضة المحدودة
إخلاء المسؤولية : الشركات المذكورة أعلاه ليست مرتبة بأي ترتيب معين.
- احصل على نظرة عامة على أهم اللاعبين الرئيسيين في سوق التنقل الذكي
يركز اللاعبون العاملون في سوق التنقل الذكي بشكل أساسي على تطوير المنتجات المتقدمة والفعالة.
- في يناير 2022، تعتزم شركة توموك، وهي شركة متخصصة في التنقل المتعدد الوسائط، توسيع عملياتها إلى عشر مدن أخرى بحلول عام 2022، بما في ذلك دلهي ومومباي.
- في أبريل 2021، قامت شركة متخصصة في التنقل في المدينة ببناء منصة تطبيقات تدمج الطرق مع الأسعار لأول مرة، وتجمع بين الحافلات والمترو وأوبر ويولو وغيرها من خيارات الميل الأخير.
نبذة عن الشركة
:
- بلابلاكار
- التنقل الذكي
- شركة إنتربرايز القابضة
- شركة إي بولرز للتكنولوجيا المحدودة
- شركة جولدن كونكورد القابضة المحدودة
- التنقل الذكي في أوكلاند
- رحلة سريعة
- ترانس هيلب تكنولوجيز المحدودة
- شركة أوبر تكنولوجيز
- التنقل الذكي

نافين خبيرٌ متمرسٌ في أبحاث السوق والاستشارات، يتمتع بخبرةٍ تزيد عن 9 سنوات في مشاريع مُخصصة ومُشتركة واستشارية. يشغل حاليًا منصب نائب الرئيس المساعد، وقد نجح في إدارة أصحاب المصلحة عبر سلسلة قيمة المشاريع، وألّف أكثر من 100 تقرير بحثي وأكثر من 30 مهمة استشارية. يمتد نطاق عمله ليشمل مشاريع صناعية وحكومية، مساهمًا بشكل كبير في نجاح العملاء واتخاذ القرارات القائمة على البيانات.
نافين حاصلٌ على شهادة في هندسة الإلكترونيات والاتصالات من جامعة فرجينيا التقنية، كارناتاكا، وشهادة ماجستير في إدارة الأعمال في التسويق والعمليات من جامعة مانيبال. وهو عضوٌ نشطٌ في معهد مهندسي الكهرباء والإلكترونيات (IEEE) لمدة 9 سنوات، حيث شارك في مؤتمراتٍ وندواتٍ تقنية، وتطوّع على مستوى الأقسام والمناطق. قبل منصبه الحالي، عمل مستشارًا استراتيجيًا مساعدًا في IndustryARC، ومستشارًا للخوادم الصناعية في شركة هيوليت باكارد (HP Global).
- التحليل التاريخي (سنتان)، سنة الأساس، التوقعات (7 سنوات) مع معدل النمو السنوي المركب
- تحليل PEST و SWOT
- حجم السوق والقيمة / الحجم - عالمي، إقليمي، بلد
- الصناعة والمنافسة
- مجموعة بيانات إكسل
التقارير الحديثة
شهادات العملاء
تقرير سوق أنظمة SCADA من Insight Partners شامل، ويقدم رؤى قيّمة حول الاتجاهات الحالية والتوقعات المستقبلية. تميّز الفريق باحترافية عالية وسرعة في الاستجابة ودعم مستمر طوال الوقت. نحن راضون جدًا ونوصي بشدة بخدماتهم.
ران كيديم شريك, شركة ريالي تكنولوجيز المحدودةطلبتُ تقريرًا عن سوق برمجيات محدد، وأعدّه الفريق في غضون أيام قليلة. كانت المعلومات ذات صلة وثيقة وعرضها جيد. ثم طلبتُ بعض التعديلات والإضافات على التقرير. وكان الفريق متجاوبًا للغاية، وحصلتُ على التقرير النهائي في أقل من أسبوع.
جان هيرفيه جين رئيس مجلس الإدارة, فيوتشر أناليتيكاعملنا مع شركة "إنسايت بارتنرز" لإجراء دراسة سوقية وتوقعات مهمة. زودونا برؤى واضحة حول الفرص والمخاطر، مما ساعدنا في صياغة خططنا. كانت أبحاثهم سهلة الاستخدام ومبنية على بيانات دقيقة، مما ساعدنا على اتخاذ قرارات ذكية وواثقة. نوصي بهم بشدة.
بيوش ناجبال نائب الرئيس الأول, شعاع عالي عالميقدّمت شركة Insight Partners أبحاثًا سوقية ثاقبة ومنظمة جيدًا بخبرة واسعة في هذا المجال. تميّز فريقهم بالاحترافية وسرعة الاستجابة طوال الوقت. وسهّل موقعهم الإلكتروني سهل الاستخدام الوصول إلى تقارير القطاع. نوصي بهم بشدة لخدمات بحثية موثوقة وعالية الجودة.
يوكيهيكو أداتشي المدير التنفيذي, ديب بلو، ذ.م.م.هذه أول مرة أشتري فيها تقرير سوق من The Insight Partners. رغم أنني كنت مترددًا في البداية، إلا أنني زرت موقعهم الإلكتروني وشعرت براحة أكبر للمخاطرة وشراء تقرير السوق. أنا راضٍ تمامًا عن جودة التقرير وخدمة العملاء. كانت لديّ عدة أسئلة وتعليقات حول التقرير الأولي، ولكن بعد بضع محادثات عبر البريد الإلكتروني مع محللهم، أعتقد أن لديّ تقريرًا يمكنني استخدامه كمدخل لعملية التخطيط الاستراتيجي لدينا. شكرًا جزيلاً لكم على تخصيص وقتكم الإضافي وجعل هذه التجربة إيجابية. سأوصي بخدماتكم للآخرين بالتأكيد، وستكونون أول من ألجأ إليه عندما نحتاج إلى المزيد من بيانات السوق.
جون سوزوكي الرئيس والرئيس التنفيذي وعضو مجلس الإدارة, بي كيه تكنولوجيزأود أن أقدّر دعمكم واحترافيتكم في الاستجابة لطلبي للحصول على معلومات بشأن سوق التشخيص المخبري للأمراض المعدية في نيجيريا. كما أُقدّر صبركم وتوجيهكم، واستعدادكم لتقديم خصم، مما مكّننا في النهاية من إتمام الصفقة. أتطلع إلى التعامل مع "ذا إنسايت بارتنرز" مستقبلًا، كل ذلك بفضل الانطباع الذي تركتموه لديّ نتيجةً لهذا اللقاء الأول.
الدكتور تشيجيوك أونيا المدير الإداري, شركة باينكريست للرعاية الصحية المحدودةسبب الشراء
- اتخاذ قرارات مدروسة
- فهم ديناميكيات السوق
- تحليل المنافسة
- رؤى العملاء
- توقعات السوق
- تخفيف المخاطر
- التخطيط الاستراتيجي
- مبررات الاستثمار
- تحديد الأسواق الناشئة
- تحسين استراتيجيات التسويق
- تعزيز الكفاءة التشغيلية
- مواكبة التوجهات التنظيمية


 احصل على عينة مجانية ل - سوق التنقل الذكي