Quota di mercato, crescita e previsioni di crescita del mercato dei database a grafo entro il 2034
Dati storici : 2021-2024 | Anno base : 2025 | Periodo di previsione : 2026-2034Dimensioni e previsioni del mercato dei database a grafo (2021-2034), quota globale e regionale, trend e analisi delle opportunità di crescita. Copertura del report: per componente (software, servizi), tipo di implementazione (on-premise, cloud), applicazione (gestione del rischio e rilevamento delle frodi, analisi dei clienti, motori di raccomandazione, gestione della catena di approvvigionamento, gestione delle operazioni e gestione delle risorse, gestione della conoscenza, gestione dei dati scientifici, altro), tipo (grafo di proprietà, framework di descrizione delle risorse), settore verticale (BFSI, sanità, telecomunicazioni e IT, vendita al dettaglio ed e-commerce, trasporti e logistica, governo e settore pubblico, media e intrattenimento, viaggi e ospitalità, produzione, altro) e area geografica.
- Stato : Dati rilasciati
- Codice del report : TIPRE00006565
- Categoria : Tecnologia, media e telecomunicazioni
- Numero di pagine : 150
- Formati di report disponibili :


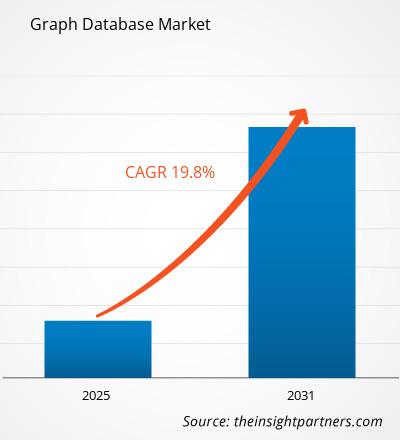
Si prevede che il mercato globale dei database a grafo raggiungerà un valore di 16,34 miliardi di dollari entro il 2034, rispetto ai 4,22 miliardi di dollari del 2025. Si prevede inoltre che il mercato registrerà un tasso di crescita annuo composto (CAGR) del 18,42% durante il periodo di previsione 2026-2034.
Il report è segmentato per componente (software, servizi), tipo di implementazione (on-premise, cloud), applicazione (gestione del rischio e rilevamento delle frodi, analisi dei clienti, motori di raccomandazione, gestione della catena di fornitura, gestione delle operazioni e gestione degli asset, gestione della conoscenza, gestione dei dati scientifici, altro), tipo (grafo delle proprietà, framework di descrizione delle risorse), settore verticale (BFSI, sanità, telecomunicazioni e IT, vendita al dettaglio ed e-commerce, trasporti e logistica, governo e settore pubblico, media e intrattenimento, viaggi e ospitalità, produzione, altro). L'analisi globale è ulteriormente suddivisa a livello regionale e per i principali paesi. Il report offre il valore in USD per l'analisi e i segmenti sopra indicati.
Scopo del rapporto
Il report "Graph Database Market" di The Insight Partners si propone di descrivere il panorama attuale e la crescita futura, i principali fattori trainanti, le sfide e le opportunità. Ciò fornirà spunti utili a diverse figure aziendali, quali:
- Fornitori/produttori di tecnologia: comprendere le dinamiche di mercato in continua evoluzione e conoscere le potenziali opportunità di crescita, in modo da poter prendere decisioni strategiche informate.
- Investitori: Condurre un'analisi completa delle tendenze relative al tasso di crescita del mercato, alle proiezioni finanziarie del mercato e alle opportunità esistenti lungo l'intera catena del valore.
- Organismi di regolamentazione: Regolamentare le politiche e vigilare sulle attività del mercato al fine di minimizzare gli abusi, preservare la fiducia degli investitori e tutelare l'integrità e la stabilità del mercato.
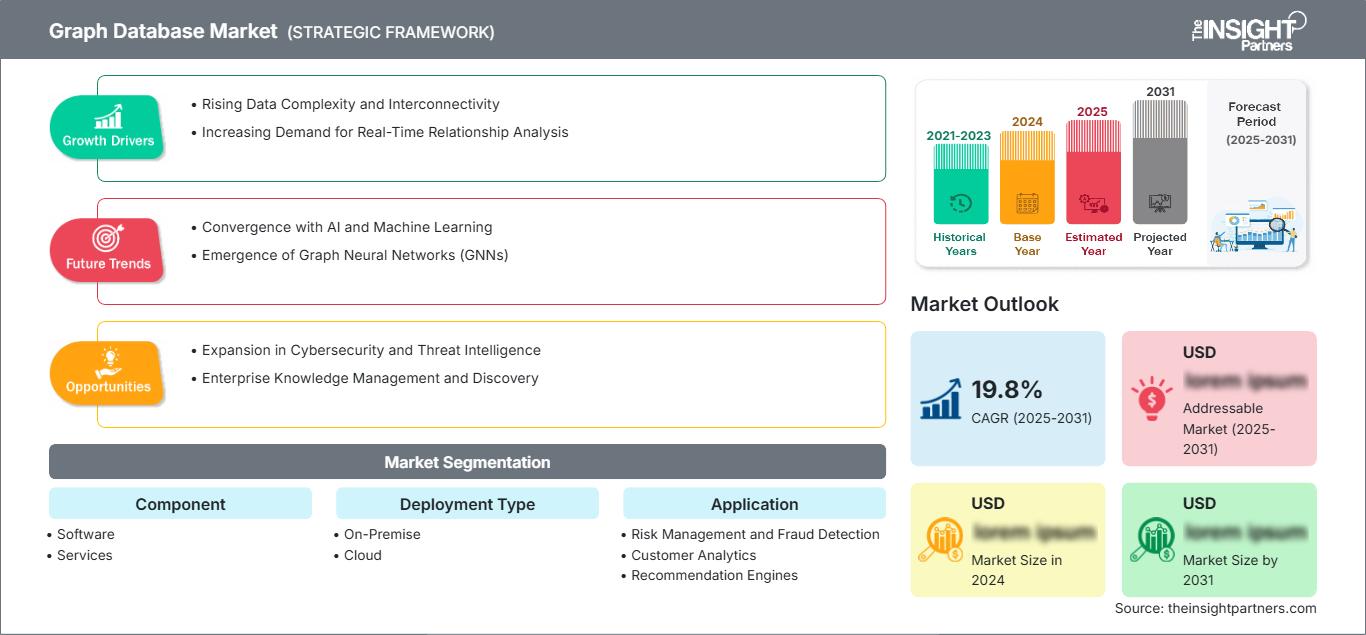
Segmentazione del mercato dei database a grafo
Componente
- Software
- Fibre
Tipo di implementazione
- In loco
- Nuvola
Applicazione
- Gestione del rischio e rilevamento delle frodi
- Analisi dei clienti
- Motori di raccomandazione
- Gestione della catena di approvvigionamento
- Gestione delle operazioni e gestione patrimoniale
- Gestione della conoscenza
- Gestione dei dati scientifici
- Altri
Tipo
- Grafico delle proprietà
- Struttura di descrizione delle risorse (RDF)
Verticale di settore
- BFSI
- Assistenza sanitaria
- Telecomunicazioni e IT
- Vendita al dettaglio ed e-commerce
- Trasporti e logistica
- Governo e settore pubblico
- Media e intrattenimento
- Viaggi e ospitalità
- Produzione
- Altri
Punti salienti della ricerca di mercato
- Il mercato globale dei database a grafo aveva un valore di 4,22 miliardi di dollari nel 2025.
- Si prevede che il valore annuo del mercato raggiungerà i 16,34 miliardi di dollari entro il 2034.
- Si prevede che il mercato totale indirizzabile (TAM) nel periodo 2026-2034 raggiungerà circa 97,11 miliardi di dollari USA.
- Si prevede che il mercato registrerà un CAGR del 18,42% durante il periodo di previsione.
- Gli Stati Uniti rappresentano un mercato chiave, supportato dalla crescente complessità e interconnettività dei dati, dalla crescente domanda di analisi delle relazioni in tempo reale, nonché dalle dinamiche di settore in continua evoluzione.
- L'analisi di mercato copre Nord America, Europa, Asia-Pacifico, Sud e Centro America, Medio Oriente e Africa, con una valutazione della crescita per tutto il periodo di previsione.
- Opportunità di mercato come l'espansione nella sicurezza informatica e nell'intelligence sulle minacce, la gestione della conoscenza aziendale e la scoperta dovrebbero influenzare le dinamiche di mercato e il mercato indirizzabile
- Il rapporto delinea i profili dei partecipanti al settore, tra cui Amazon Web Services, Inc., Callidus Software Inc., IBM Corporation, Microsoft Corporation, arkLogic Corporation, Neo4j, Inc., Oracle Corporation, OpenLink Software, Teradata Corporation, TIBCO Software Inc., analizzando al contempo le strategie competitive e gli sviluppi dell'innovazione.
Personalizza questo report in base alle tue esigenze
Ottieni la PERSONALIZZAZIONE GRATUITAMercato dei database a grafo: approfondimenti strategici
-
Scopri le principali tendenze di mercato di questo report.Questo campione GRATUITO includerà un'analisi dei dati, che spazierà dalle tendenze di mercato alle stime e alle previsioni.
Fattori trainanti della crescita del mercato dei database a grafo
- Crescente complessità e interconnessione dei dati: le organizzazioni stanno assistendo a una crescita esponenziale di relazioni complesse e interconnesse tra i dati in diversi ambiti, come i social network, la sicurezza informatica e i sistemi di raccomandazione. I database a grafo offrono prestazioni superiori nella gestione di intricate connessioni tra i dati, consentendo di ottenere insight più rapidamente e di effettuare analisi basate sulle relazioni più sofisticate rispetto ai tradizionali database relazionali.
- Crescente domanda di analisi delle relazioni in tempo reale: le aziende necessitano di una comprensione immediata delle relazioni dinamiche tra le entità, il che spinge all'adozione di database a grafo. Dal rilevamento delle frodi nei servizi finanziari all'esperienza cliente personalizzata nell'e-commerce, la capacità di attraversare e analizzare rapidamente punti dati interconnessi è diventata cruciale per il vantaggio competitivo e l'efficienza operativa.
Tendenze future del mercato dei database a grafo
- Convergenza con IA e apprendimento automatico: i database a grafo si stanno integrando sempre più con le tecnologie di IA e apprendimento automatico, consentendo la creazione di grafi della conoscenza più sofisticati, analisi predittive e sistemi di raccomandazione intelligenti. Questa convergenza permette una comprensione semantica più approfondita, un riconoscimento dei modelli migliorato e approfondimenti più dettagliati in diversi settori come la sanità, la finanza e la tecnologia.
- L'avvento delle reti neurali su grafi (GNN): L'emergere delle reti neurali su grafi (GNN), una classe di modelli di apprendimento automatico progettati per elaborare dati strutturati a grafo, sta guidando l'adozione dei database a grafo. Le GNN richiedono database a grafo per archiviare ed elaborare i dati sottostanti, e questa sinergia tra GNN e database a grafo sta alimentando la crescita del mercato.
Opportunità di mercato per i database a grafo
- Espansione nella sicurezza informatica e nell'intelligence sulle minacce: i database a grafo rappresentano un'opportunità di trasformazione nella sicurezza informatica, mappando complessi scenari di minaccia, identificando modelli di attacco e consentendo una valutazione del rischio in tempo reale. La loro capacità di visualizzare e analizzare intricate connessioni di rete permette alle organizzazioni di rilevare e mitigare in modo proattivo le minacce informatiche più sofisticate, con maggiore efficacia rispetto agli approcci di sicurezza tradizionali.
- Gestione e scoperta della conoscenza aziendale: i database a grafo offrono un potenziale senza precedenti per la gestione della conoscenza aziendale, consentendo alle organizzazioni di creare repository dinamici e interconnessi di conoscenza istituzionale. Mappando le relazioni tra dati, persone e processi, le aziende possono migliorare la collaborazione, accelerare l'innovazione e prendere decisioni strategiche più informate all'interno di ecosistemi organizzativi complessi.
Ambito del rapporto di mercato sui database a grafo
| Attributo del report | Dettagli |
|---|---|
| Dimensioni del mercato nel 2025 | 4,22 miliardi di dollari |
| Dimensioni del mercato entro il 2034 | 16,34 miliardi di dollari |
| Tasso di crescita annuo composto (CAGR) globale (2026-2034) | 18,42% |
| Dati storici | 2021-2024 |
| periodo di previsione | 2026-2034 |
| Segmenti trattati |
Per componente
|
| Regioni e paesi coperti |
America del Nord
|
| Leader di mercato e profili aziendali chiave |
|
Densità degli operatori nel mercato dei database a grafo: comprenderne l'impatto sulle dinamiche aziendali
Il mercato dei database a grafo è in rapida crescita, trainato dalla crescente domanda degli utenti finali, dovuta a fattori quali l'evoluzione delle preferenze dei consumatori, i progressi tecnologici e una maggiore consapevolezza dei vantaggi offerti dal prodotto. Con l'aumento della domanda, le aziende stanno ampliando la propria offerta, innovando per soddisfare le esigenze dei consumatori e sfruttando le tendenze emergenti, alimentando ulteriormente la crescita del mercato.
Punti di forza principali
- Copertura completa: il rapporto analizza in modo esaustivo prodotti, servizi, tipologie e utenti finali del mercato dei database a grafo, fornendo un quadro completo.
- Analisi degli esperti: il rapporto è redatto sulla base della profonda conoscenza del settore da parte di esperti e analisti.
- Informazioni aggiornate: il report garantisce la rilevanza aziendale grazie alla sua copertura di informazioni e tendenze di dati recenti.
- Opzioni di personalizzazione: questo report può essere personalizzato per soddisfare le esigenze specifiche del cliente e adattarsi al meglio alle strategie aziendali.
Il rapporto di ricerca sul mercato dei database a grafo può quindi contribuire a decifrare e comprendere lo scenario del settore e le prospettive di crescita. Sebbene possano esserci alcune valide preoccupazioni, i vantaggi complessivi di questo rapporto tendono a superare gli svantaggi.

Ankita è una dinamica professionista della ricerca di mercato e della consulenza con oltre 8 anni di esperienza nei settori della tecnologia, dei media, dell'ICT, dell'elettronica e dei semiconduttori. Ha guidato e portato a termine con successo oltre 100 incarichi di consulenza e ricerca per clienti globali come Microsoft, Oracle, NEC Corporation, SAP, KPMG ed Expeditors International. Le sue competenze principali includono la valutazione del mercato, l'analisi dei dati, le previsioni, la formulazione di strategie, l'intelligence competitiva e la redazione di report.
Ankita è esperta nella gestione di cicli di progetto completi, dalla progettazione di proposte pre-vendita e discussioni con i clienti fino alla fornitura di insight fruibili post-vendita. È esperta nella gestione di team interfunzionali, nella strutturazione di moduli di ricerca complessi e nell'allineamento delle soluzioni agli obiettivi aziendali specifici del cliente. Le sue eccellenti capacità di comunicazione, leadership e presentazione le hanno permesso di fornire costantemente risultati orientati al valore in contesti di mercato in rapida evoluzione.
- Analisi storica (2 anni), anno base, previsione (7 anni) con CAGR
- Analisi PEST e SWOT
- Valore/volume delle dimensioni del mercato - Globale, Regionale, Nazionale
- Industria e panorama competitivo
- Set di dati Excel
Testimonianze
Il report di mercato sui sistemi SCADA di Insight Partners è completo, con preziosi spunti sulle tendenze attuali e sulle previsioni future. Il team si è dimostrato altamente professionale, reattivo e disponibile in ogni fase del progetto. Siamo molto soddisfatti e consigliamo vivamente i loro servizi.
RAN KEDEM Partner, Reali Technologies LTDsHo richiesto un report su un mercato software molto specifico e il team lo ha prodotto in pochi giorni. Le informazioni erano molto pertinenti e ben presentate. Ho quindi richiesto alcune modifiche e aggiunte al report. Il team è stato ancora una volta molto reattivo e ho ricevuto il report finale in meno di una settimana.
JEAN-HERVE JENN Presidente, Future AnalyticaAbbiamo collaborato con The Insight Partners per un importante studio di mercato e una previsione. Ci hanno fornito informazioni chiare su opportunità e rischi, che ci hanno aiutato a definire i nostri piani. La loro ricerca è stata facile da usare e basata su dati solidi. Ci ha aiutato a prendere decisioni intelligenti e consapevoli. Li consigliamo vivamente.
PIYUSH NAGPAL Vicepresidente senior, Abbaglianti globaliInsight Partners ha fornito ricerche di mercato approfondite e ben strutturate, con una solida competenza nel settore. Il loro team si è dimostrato professionale e reattivo in ogni fase. Il sito web intuitivo ha reso l'accesso ai report di settore semplice e immediato. Li consigliamo vivamente per servizi di ricerca affidabili e di alta qualità.
YUKIHIKO ADACHI Amministratore delegato, Deep Blue, LLC.Questa è la prima volta che acquisto un report di mercato da The Insight Partners. Sebbene inizialmente fossi indeciso, ho visitato il loro sito web e mi sono sentito più a mio agio nell'acquistare un report di mercato. Sono completamente soddisfatto della qualità del report e del servizio clienti. Avevo diverse domande e commenti sul report iniziale, ma dopo un paio di conversazioni via email con il loro analista credo di avere un report che posso utilizzare come input per il nostro processo di pianificazione strategica. Grazie mille per aver dedicato del tempo extra e aver reso questa esperienza positiva. Consiglierò sicuramente il vostro servizio ad altri e sarete la mia prima persona a cui rivolgermi quando avremo bisogno di ulteriori dati di mercato.
GIOVANNI SUZUKI Presidente e Amministratore Delegato, Consigliere di Amministrazione, Tecnologie BKDesidero esprimere la mia gratitudine per il supporto e la professionalità dimostrati nel rispondere alla mia richiesta di informazioni sul mercato dei dispositivi medici in vitro per malattie infettive in Nigeria. Apprezzo la vostra pazienza, la vostra guida e la vostra disponibilità a offrirmi uno sconto, che alla fine ci ha permesso di concludere l'affare. Non vedo l'ora di collaborare con The Insight Partners in futuro, grazie anche all'impressione che mi avete lasciato dopo questo primo incontro.
Dott. Chijioke AMMINISTRATORE DELEGATO DI ONYIA, PineCrest Healthcare Ltd.Motivo dell'acquisto
- Processo decisionale informato
- Comprensione delle dinamiche di mercato
- Analisi competitiva
- Analisi dei clienti
- Previsioni di mercato
- Mitigazione del rischio
- Pianificazione strategica
- Giustificazione degli investimenti
- Identificazione dei mercati emergenti
- Miglioramento delle strategie di marketing
- Aumento dell'efficienza operativa
- Allineamento alle tendenze normative


Sblocca sconti esclusivi sui report
Richiedi ora


 Ottieni un campione gratuito per - Mercato dei database grafici