デジタル地図市場 - 2031 年の成長予測、統計および事実
過去データ : 2021-2023 | 基準年 : 2024 | 予測期間 : 2025-2031デジタルマップ市場の規模と予測(2021年 - 2031年)、世界および地域別シェア、トレンド、成長機会分析レポートの対象範囲:コンポーネント(ソリューションとサービス)、垂直(エネルギーと公共事業、建設、物流、政府と防衛、自動車、小売)、および地理(北米、ヨーロッパ、アジア太平洋、南米と中米)別
- ステータス : 公開されたデータ
- レポートコード : TIPRE00002930
- カテゴリー : テクノロジー、メディア、通信
- ページ数 : 150
- 利用可能なレポート形式 :


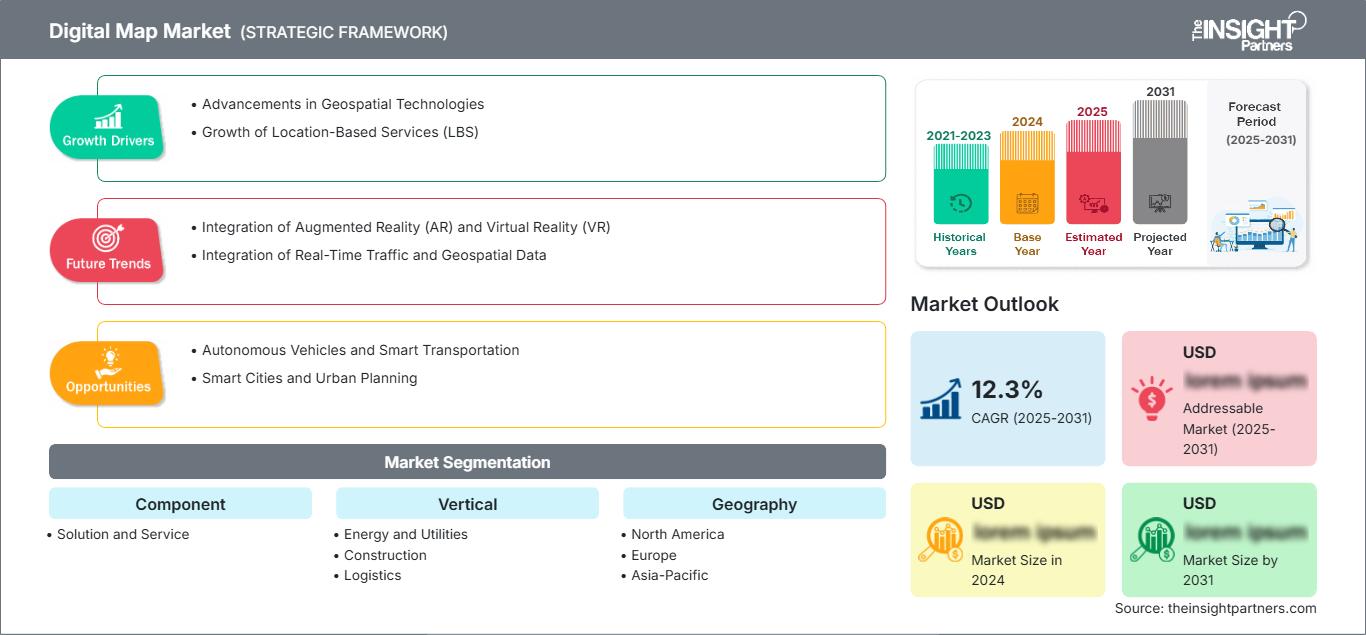
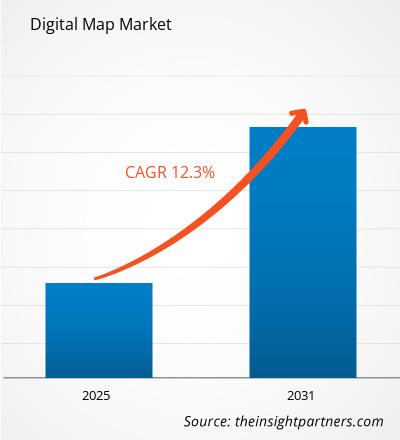
デジタルマップ市場規模は、2031年までに815億6000万米ドルに達すると予想されています。市場は2025年から2031年にかけて1375.7%のCAGRで成長すると予想されています。
本レポートは、コンポーネント(ソリューションとサービス)および垂直(エネルギー・公益事業、建設、物流、政府・防衛、自動車、小売)別にセグメント化されています。グローバル分析は、地域レベルおよび主要国別にさらに細分化されています。本レポートでは、上記の分析とセグメントの米ドル建ての値を提供しています。
レポートの目的
The Insight Partnersによるデジタルマップ市場レポートは、現在の市場状況と将来の成長、主な推進要因、課題、そして機会を説明することを目的としています。これにより、次のようなさまざまなビジネス関係者に洞察が提供されます。
- テクノロジープロバイダー/メーカー: 進化する市場動向を理解し、潜在的な成長機会を把握することで、情報に基づいた戦略的意思決定が可能になります。
- 投資家: 市場の成長率、市場の財務予測、バリューチェーン全体に存在する機会に関する包括的なトレンド分析を実施します。
- 規制機関: 市場の乱用を最小限に抑え、投資家の信頼と信用を維持し、市場の健全性と安定性を維持することを目的として、市場におけるポリシーと警察活動を規制します。
デジタルマップ市場セグメンテーションコンポーネント
- ソリューションとサービス
垂直
- エネルギーと公益事業
- 建設
- 物流
- 政府と防衛
- 自動車
- 小売
レポートの一部、国レベルの分析、Excelデータパックなどを含め、スタートアップ&大学向けに特別オファーや割引もご利用いただけます(無償)
デジタルマップ市場: 戦略的洞察
-
このレポートの主要な市場動向を入手してください。この無料サンプルには、市場動向から見積もりや予測に至るまでのデータ分析が含まれます。
デジタルマップ市場の成長要因
- 地理空間技術の進歩:衛星画像、地理情報システム、リモートセンシング、人工知能の進歩は、デジタルマップ市場の主要な推進力となっています。クラウドコンピューティングの成長と、大規模なデータをリアルタイムで処理する能力が相まって、高精度で詳細な、どこにでも存在するデジタルマッピングが可能になりました。AIと機械学習アルゴリズムは、データ分析の改善を通じてマッピング技術を強化します。これにより、よりスマートで動的なマップが実現し、より優れた予測とリアルタイム更新が可能になります。このような技術により、デジタルマップはよりインタラクティブで正確になり、より豊富で正確なデータセットをユーザーに提供します。
- 位置情報サービス(LBS)の成長:LBSの増加は、デジタルマップ市場の重要な推進力の1つです。ナビゲーション、地理位置情報、位置情報に基づく広告などのLBSアプリケーションは、小売、医療、物流、輸送など、さまざまな業界で使用されています。 Googleマップ、Appleマップなどのナビゲーション用モバイルアプリケーションや、UberやLyftなどの配車サービスでは、ユーザーエクスペリエンスを向上させ、効率を改善するために、デジタルマップをますます使用しています。スマートフォンとコネクテッドデバイスの普及に伴い、これらのサービスを可能にするためのより正確なリアルタイムのマッピングデータの需要も高まっています。
デジタルマップ市場の将来の動向
- 拡張現実(AR)と仮想現実(VR)の統合:拡張現実と仮想現実は、デジタルマップの使用方法と体験を急速に変えています。特にARは、没入型のナビゲーション体験を提供するためにデジタルマップと統合されています。たとえば、位置情報は、スマートフォンやスマートグラスを通して現実世界のビューに直接重ねて表示されます。これは、観光、小売、ナビゲーション業界で応用されており、ユーザーが物理的に空間を移動しながら、デバイス上でリアルタイムのステップバイステップの指示、ランドマーク、広告を受け取ることをサポートしています。デジタルマップに AR を組み込むことで、ビジネスにおける顧客とのやり取りのエンゲージメントとインタラクティブ性のレベルが向上します。
- リアルタイム交通データと地理空間データの統合:デジタルマップ市場における主要なトレンドの 1 つは、リアルタイム交通データと地理空間情報をデジタルマップに統合することです。このトレンドは、ナビゲーション アプリ、自律走行車システム、スマート シティ インフラストラクチャで特に顕著です。交通状況、道路閉鎖、天気予報、事故に関するリアルタイム データを従来の地図データと組み合わせることで、デジタルマップはより正確で動的、かつ状況に応じたナビゲーション サービスを提供できます。車両、都市インフラストラクチャ、モバイル アプリにおけるコネクテッド デバイスとセンサーの使用増加がこのトレンドを牽引し、リアルタイム更新と地理空間データへのアクセスが容易になり、マップ プラットフォームに統合されるようになっています。
デジタルマップ市場の機会
- 自律走行車とスマート交通:自律走行車の登場により、デジタルマップ市場に新たな道が開かれました。自動運転車やドローンは、周囲の状況を解釈するためにGPSとセンサーデータに依存するため、安全に移動するには非常に詳細で最新の地図が必要です。リアルタイムデータを備えた高解像度(HD)地図は、自動運転車が周囲の状況を把握し、障害物を識別し、意思決定を行う上で不可欠です。自動車業界と輸送業界が自動運転技術への投資を続ける中、デジタル地図プロバイダーは、それらを支えるインフラの開発において重要な役割を果たすでしょう。スマート交通システムと統合されたデジタル地図は、交通ネットワークの効率性と安全性をさらに高めます。
- スマートシティと都市計画:デジタル地図市場にとってもう一つの大きなチャンスはスマートシティです。都市化の速度は加速し続けており、それに伴い、都市計画者や地方自治体は、都市インフラの最適化、資源管理、公共交通機関、交通管理、公共事業網などのサービスの改善に、デジタル地図をますます活用するようになっています。GISとデジタルマッピングツールは都市の詳細なモデリングを可能にし、関係者が人口密度、土地利用、交通パターン、環境への影響を分析できるようにします。都市がより密接につながり、データ駆動型になるにつれ、リアルタイムで動的なデジタルマップの需要は高まり続け、都市計画と管理におけるイノベーションの新たな機会が生まれます。
デジタルマップ市場
予測期間を通じてデジタルマップ市場に影響を与える地域的なトレンドと要因については、The Insight Partnersのアナリストが詳細に解説しています。また、このセクションでは、北米、ヨーロッパ、アジア太平洋、中東・アフリカ、中南米における心不整脈疾患管理市場のセグメントと地域についても解説しています。
デジタルマップ市場レポートの範囲
| レポート属性 | 詳細 |
|---|---|
| の市場規模 2024 | US$ 0.00 Billion |
| 市場規模別 2031 | US$ 81.56 Billion |
| 世界的なCAGR (2025 - 2031) | 1375.7% |
| 過去データ | 2021-2023 |
| 予測期間 | 2025-2031 |
| 対象セグメント | By コンポーネント(ソリューションとサービス)By 垂直分野(エネルギーおよび公益事業、建設、物流、政府および防衛、自動車、小売)By 地理(北米、ヨーロッパ、アジア太平洋、南米、中米、中東、アフリカ) |
| 対象地域と国 |
北米(米国、カナダ、メキシコ)
|
| 市場リーダーと主要企業の概要 |
|
デジタルマップ市場のプレーヤー密度:ビジネスダイナミクスへの影響を理解する
デジタルマップ市場は、消費者の嗜好の変化、技術の進歩、製品メリットへの認知度の高まりといった要因により、エンドユーザーの需要が高まり、急速に成長しています。需要が高まるにつれ、企業は提供内容を拡大し、消費者ニーズを満たすためのイノベーションを推進し、新たなトレンドを捉えることで、市場の成長をさらに加速させています。
- 入手 デジタルマップ市場 主要プレーヤーの概要
主なセールスポイント
- 包括的な調査範囲:本レポートは、デジタルマップ市場の製品、サービス、タイプ、エンドユーザーの分析を包括的に網羅し、包括的な展望を提供しています。
- 専門家による分析:本レポートは、業界の専門家とアナリストの深い理解に基づいて作成されています。
- 最新情報:本レポートは、最新の情報とデータトレンドを網羅しているため、ビジネスの関連性を保証します。
- カスタマイズオプション:本レポートは、特定のクライアントの要件に対応し、ビジネス戦略に適切に適合するようにカスタマイズできます。
したがって、デジタルマップ市場に関する調査レポートは、業界のシナリオと成長の見通しを解読し理解するための先導役となります。いくつかの正当な懸念事項があるかもしれませんが、本レポートの全体的なメリットはデメリットを上回る傾向があります。

アンキタは、テクノロジー、メディア、ICT、エレクトロニクス・半導体の各分野で8年以上の経験を持つ、ダイナミックな市場調査およびコンサルティングのプロフェッショナルです。Microsoft、Oracle、NEC、SAP、KPMG、Expeditors Internationalといったグローバルクライアントに対し、100件以上のコンサルティングおよび調査案件を主導・遂行してきました。彼女のコアコンピテンシーは、市場評価、データ分析、予測、戦略策定、競合情報、レポート作成です。
アンキタは、販売前の提案書作成やクライアントとの協議から、販売後の実用的なインサイトの提供まで、プロジェクトサイクル全体を巧みに管理することに長けています。彼女は、部門横断的なチームの管理、複雑な調査モジュールの構築、そしてクライアント固有のビジネス目標に合わせたソリューションの調整に長けています。優れたコミュニケーション能力、リーダーシップ、そしてプレゼンテーション能力により、急速に変化する市場環境において、常に価値主導の成果を生み出しています。
- 過去2年間の分析、基準年、CAGRによる予測(7年間)
- PEST分析とSWOT分析
- 市場規模価値/数量 - 世界、地域、国
- 業界と競争環境
- Excel データセット
お客様の声
Insight PartnersのSCADAシステム市場レポートは包括的で、現在のトレンドと将来の予測に関する貴重な洞察が含まれています。チームは終始、非常にプロフェッショナルで、対応が早く、サポートも充実していました。私たちは彼らのサービスに非常に満足しており、強くお勧めします。
ラン・ケデム パートナー, レアリテクノロジーズ株式会社非常に特殊なソフトウェア市場に関するレポートを依頼したところ、チームは数日でレポートを作成してくれました。情報は非常に関連性が高く、分かりやすくまとめられていました。その後、レポートにいくつか修正と追加を依頼しましたが、チームは非常に迅速に対応し、1週間も経たないうちに最終レポートを受け取ることができました。
ジャン=エルヴェ・ジェン 会長, フューチャー・アナリティカ重要な市場調査と予測のために、The Insight Partnersと協力しました。彼らは機会とリスクに関する明確な洞察を提供し、私たちの計画策定に役立ちました。彼らの調査は使いやすく、確かなデータに基づいており、賢明で自信に満ちた意思決定に役立ちました。彼らを強くお勧めします。
ピユーシュ・ナグパル 上級副社長, ハイビームグローバルInsight Partnersは、深い専門知識に基づき、洞察力に富み、構造化された市場調査を提供しました。チームは終始プロフェッショナルで、対応力も抜群でした。ユーザーフレンドリーなウェブサイトにより、業界レポートへのアクセスもスムーズでした。信頼性の高い高品質な調査サービスをお探しなら、Insight Partnersを強くお勧めします。
安達幸彦 最高経営責任者(CEO), ディープブルーLLC。The Insight Partnersから市場レポートを購入するのは今回が初めてです。最初は不安でしたが、ウェブサイトを見て、リスクを負ってでも購入してみようという気持ちになりました。レポートの品質とカスタマーサービスには大変満足しています。最初のレポートにはいくつか質問やコメントがありましたが、アナリストとメールで何度かやり取りした結果、戦略策定プロセスへのインプットとして活用できるレポートが完成しました。貴重なお時間を割いていただき、貴重な体験をさせていただき、誠にありがとうございました。他の方にもぜひお勧めしたいですし、今後さらに市場データが必要になった際には、まずThe Insight Partnersにご連絡させていただきます。
ジョン・スズキ 社長兼最高経営責任者、取締役, BKテクノロジーズナイジェリアの感染症IVD市場に関する情報提供依頼に対し、ご対応いただいた際、ご尽力とプロフェッショナルな姿勢に深く感謝申し上げます。忍耐強く、的確なアドバイスをいただき、また、最終的に取引成立に至った割引のご提供にも深く感謝申し上げます。今回の最初の出会いで得た強い印象のおかげで、今後もThe Insight Partnersとの連携を心待ちにしております。
チジオケ博士 オニア マネージングディレクター, パインクレストヘルスケア株式会社購入理由
- 情報に基づいた意思決定
- 市場動向の理解
- 競合分析
- 顧客インサイト
- 市場予測
- リスク軽減
- 戦略計画
- 投資の正当性
- 新興市場の特定
- マーケティング戦略の強化
- 業務効率の向上
- 規制動向への対応


 無料サンプルを入手 - デジタルマップ市場