pH緩衝液市場の概要、成長、傾向、分析、調査レポート(2023-2031)

  • Report Date : Jan 2025
  • Report Code : TIPRE00016551
  • Category : Chemicals and Materials
  • Status : Published
  • Available Report Formats : pdf-format excel-format
  • No. of Pages : 188

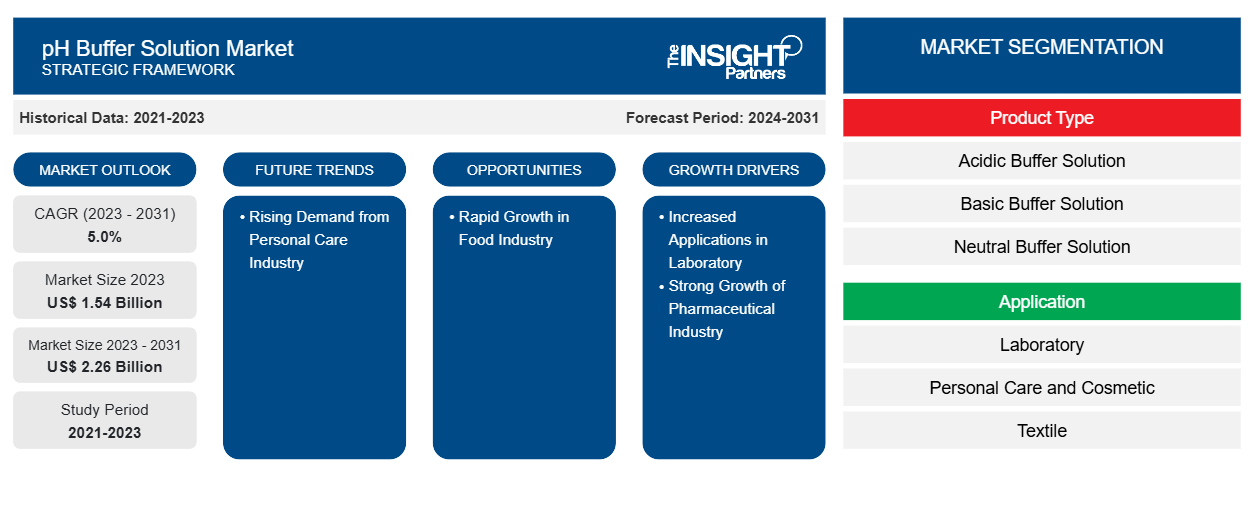
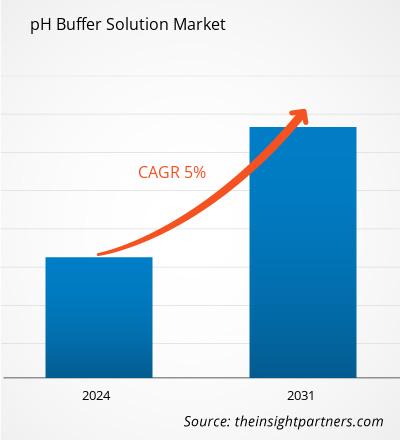
pH緩衝液市場規模は、2023年の15億4,000万米ドルから2031年には22億6,000万米ドルに達すると予測されています。市場は2023年から2031年の間に5.0%のCAGRを記録すると予想されています。パーソナルケア業界からの需要の高まりにより、予測期間中に市場に新たなトレンドがもたらされる可能性があります。


pH緩衝液市場分析   

生物学および生物医学研究所、化学研究所、環境研究所、製薬研究所、法医学研究所、食品および飲料研究所、農業研究所、工業研究所、石油および石油研究所、およびその他の研究所施設が急速に拡大しています。研究開発活動の増加に伴い、世界中で新しい研究所が設立されており、化学メーカーは研究開発に多額の投資を行っています。欧州化学工業会議(CEFIC)が発表したデータによると、2022年にEU27の化学産業における研究開発費は116億米ドルに達しました。化学研究所では、pH緩衝液が滴定、特に酸塩基滴定に広く使用されています。これらの緩衝液は、滴定プロセス中に安定したpHを維持するのに役立ちます。化学反応が正しく進行するようにするには、特定のpHを維持する必要があります。さらに、生物学および生物医学研究所では、培養中の細胞の増殖に最適なpHを維持するために、pH緩衝液が不可欠です。リン酸緩衝生理食塩水 (PBS) などの緩衝液は、pH 安定性を維持するために細胞培地でよく使用されます。  


pH緩衝液市場の概要

世界のpH 緩衝液市場は、医薬品、食品および飲料、研究室、パーソナルケアおよび化粧品、化学製造などのさまざまな業界で不可欠な役割を果たしているため、着実に成長しています。pH 緩衝液は、発酵、品質管理、研究室試験などのプロセスで安定した pH レベルを維持するために不可欠です。食品および飲料業界での高品質製品の需要の高まりと、農業慣行および研究活動の増加が相まって、市場の拡大を促しています。


要件に合わせてレポートをカスタマイズする

このレポートの一部、国レベルの分析、Excelデータパックなど、あらゆるレポートを無料でカスタマイズできます。また、スタートアップや大学向けのお得なオファーや割引もご利用いただけます。

pH緩衝液市場:

pH Buffer Solution Market
  • このレポートの主要な市場動向を入手してください。
    この無料サンプルには、市場動向から見積もりや予測に至るまでのデータ分析が含まれます。


pH緩衝液市場の推進要因と機会


製薬業界の力強い成長  

製薬業界はイノベーションと精度の最前線に立っており、正確な製品処方と製品の品質を保証するソリューションを求めています。米国、ドイツ、フランス、イタリア、中国、日本、韓国などの国々は、世界の製薬市場の成長を牽引する重要な要因です。これは主に、人口の多さと製薬会社の数の増加に起因しています。国際製薬団体連合会(IFPMA)が提供する情報によると、バイオ医薬品業界は、ジェネリック医薬品の製造を含め、世界中で約550万人を雇用しています。さらに、アジア太平洋地域には世界人口の60%以上が居住しており、バイオ医薬品、医療機器、ヘルスケア企業にとって計り知れない商業チャンスがあります。この地域は、世界で最も著名なヘルスケア技術の投資先の1つとしても浮上しています。このように、製薬業界の強力な存在がpH緩衝液市場を牽引しています。


食品産業の急速な成長  

発酵食品、栄養価の高い食品、おいしい食品の需要が高まるにつれ、酵素の活性、タンパク質の溶解性、機能性を最適に保つために特定の pH 値を維持する必要性が生じています。食品や飲料では、製品の一定の酸性度を維持するために pH 緩衝液が使用されています。pH 緩衝液は弱酸とその共役塩基で構成されるため、通常、弱酸がすでに含まれている食品には金属塩などの添加物が追加されます。たとえば、クエン酸を含む食品にクエン酸ナトリウム (塩/塩基) を追加すると、製品内に緩衝液が生成されます。クエン酸ナトリウム、クエン酸カルシウム、クエン酸カリウムは、食品に添加される食品グレードの緩衝液の一般的な塩の形態です。リン酸一カリウムも、牛乳やカスタード製品、調理済み肉の pH 緩衝液としてよく使用されます。


pH緩衝液市場レポートのセグメンテーション分析

pH 緩衝液市場分析の導出に貢献した主要なセグメントは、製品タイプとアプリケーションです。

  • 製品タイプに基づいて、pH緩衝液市場は酸性緩衝液、塩基性緩衝液、中性緩衝液に分類されます。酸性緩衝液セグメントは2023年に市場を支配しました。
  • アプリケーションに基づいて、市場は研究室、パーソナルケアおよび化粧品、繊維、食品および飲料、医薬品、電気メッキ、製紙業、その他に分類されます。 2023年には研究室セグメントが市場を支配しました。


pH緩衝液市場シェアの地域別分析

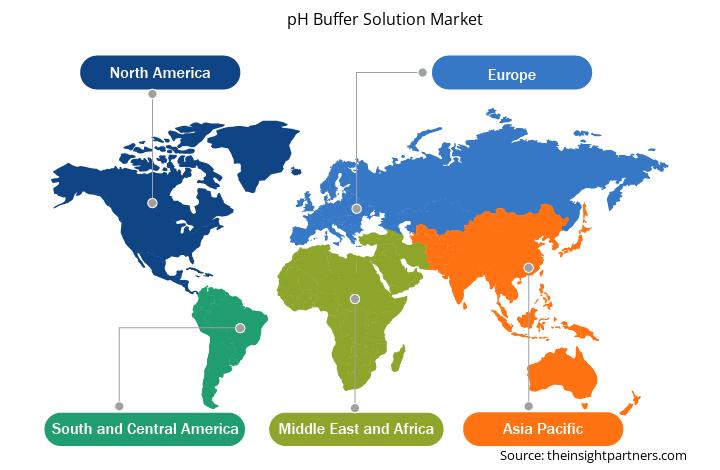
pH緩衝液市場レポートの地理的範囲は、主に北米、アジア太平洋、ヨーロッパ、中東およびアフリカ、南米および中米の5つの地域に分かれています。

pH 緩衝液市場は北米が支配的でした。北米の pH 緩衝液市場は、複数の業界における精密化学分析、品質管理、研究活動の需要の高まりによって牽引されています。この市場の成長に貢献している主要セクターには、医薬品、バイオテクノロジー、化学薬品、食品および飲料、環境試験などがあります。信頼性の高い結果を保証するには正確な pH 制御が不可欠なため、実験室および分析技術の技術的進歩により pH 緩衝液の需要も高まっています。


pH緩衝液市場の地域別分析

予測期間を通じて pH 緩衝液市場に影響を与える地域的な傾向と要因は、Insight Partners のアナリストによって徹底的に説明されています。このセクションでは、北米、ヨーロッパ、アジア太平洋、中東およびアフリカ、南米および中米にわたる pH 緩衝液市場のセグメントと地理についても説明します。

pH Buffer Solution Market
  • pH緩衝液市場の地域別データを入手

pH緩衝液市場レポートの範囲

レポート属性詳細
2023年の市場規模15億4千万米ドル
2031年までの市場規模22億6千万米ドル
世界のCAGR(2023年~2031年)5.0%
履歴データ2021-2023
予測期間2024-2031
対象セグメント製品タイプ別
  • 酸性緩衝液
  • 基本緩衝液
  • 中性緩衝液
アプリケーション別
  • 研究室
  • パーソナルケアと化粧品
  • 繊維
  • 食品および飲料
  • 医薬品
  • 電気メッキ
  • 製紙業
対象地域と国北米
  • 私たち
  • カナダ
  • メキシコ
ヨーロッパ
  • 英国
  • ドイツ
  • フランス
  • ロシア
  • イタリア
  • その他のヨーロッパ
アジア太平洋
  • 中国
  • インド
  • 日本
  • オーストラリア
  • その他のアジア太平洋地域
南米と中央アメリカ
  • ブラジル
  • アルゼンチン
  • 南米および中米のその他の地域
中東およびアフリカ
  • 南アフリカ
  • サウジアラビア
  • アラブ首長国連邦
  • その他の中東およびアフリカ
市場リーダーと主要企業プロフィール
  • ハミルトン郡
  • ファインテックリサーチアンドイノベーションコーポレーション
  • 富士フイルムホールディングス株式会社
  • ハンナインスツルメンツ株式会社
  • バンテインスツルメンツ株式会社
  • HACH社
  • サーモフィッシャーサイエンティフィック株式会社
  • センサレックス株式会社
  • 堀場製作所
  • メトラー・トレド・インターナショナル株式会社


pH緩衝液市場のプレーヤーの密度:ビジネスダイナミクスへの影響を理解する

pH 緩衝液市場は、消費者の嗜好の変化、技術の進歩、製品の利点に対する認識の高まりなどの要因により、エンドユーザーの需要が高まり、急速に成長しています。需要が高まるにつれて、企業は提供を拡大し、消費者のニーズを満たすために革新し、新たなトレンドを活用し、市場の成長をさらに促進しています。

市場プレーヤー密度とは、特定の市場または業界内で活動している企業または会社の分布を指します。これは、特定の市場スペースに、その規模または総市場価値と比較して、どれだけの競合相手 (市場プレーヤー) が存在するかを示します。

pH緩衝液市場で事業を展開している主要企業は次のとおりです。

  1. ハミルトン郡
  2. ファインテックリサーチアンドイノベーションコーポレーション
  3. 富士フイルムホールディングス株式会社
  4. ハンナインスツルメンツ株式会社
  5. バンテインスツルメンツ株式会社
  6. HACH社

免責事項上記の企業は、特定の順序でランク付けされていません。


ph-buffer-solution-market-cagr


  • pH緩衝液市場のトップキープレーヤーの概要を入手


pH緩衝液市場のニュースと最近の動向

pH 緩衝液市場は、重要な企業出版物、協会データ、データベースなどの一次調査と二次調査後の定性的および定量的データを収集することによって評価されます。pH 緩衝液市場における主要な動向のいくつかを以下に示します。

  • レイバー・ベルリンはハミルトン社と連携し、サンプル準備におけるワークフローの自動化と標準化を拡大します。この戦略的パートナーシップは、IVD-Rに準拠したラボ開発のワークフローの日常業務に重点を置いています。(出典:ハミルトン社、企業ニュース、2024年7月)
  • Hach®は、DR1300 FLポータブル蛍光計と、遊離塩素、総塩素、亜硫酸塩の3つのまったく新しい検出試験方法を世界の水市場に向けて導入しました。(出典: Hach、企業ニュース、2022年4月)


pH緩衝液市場レポートの対象範囲と成果物

「pH緩衝液市場規模と予測(2021〜2031年)」レポートでは、以下の分野をカバーする市場の詳細な分析を提供しています。

  • pH緩衝液市場規模と予測(対象範囲に含まれるすべての主要市場セグメントの世界、地域、国レベル)
  • pH緩衝液市場の動向、推進要因、制約、主要な機会などの市場動向
  • 詳細なポーターの5つの力の分析とSWOT分析
  • 主要な市場動向、世界および地域の枠組み、主要プレーヤー、規制、最近の市場動向を網羅したpH緩衝液市場分析
  • 市場集中、ヒートマップ分析、主要プレーヤー、pH緩衝液市場の最近の動向を網羅した業界展望と競争分析
  • 詳細な企業プロフィール

よくある質問

What would be the estimated value of the pH buffer solution market by 2031?

The market value is estimated to reach US$ 2.26 billion by 2031.

What is the expected CAGR of the pH buffer solution market?

The market is expected to register a CAGR of 5.0% during 2023–2031.

What are the driving factors impacting the pH buffer solution market?

Increased applications in laboratory and strong growth of the pharmaceutical industry are among the key factors contributing to the pH buffer solution market growth.

Which are the leading players operating in the pH buffer solution market?

Hamilton Co; Finetech Research and Innovation Corporation; FUJIFILM Holdings Corp; and Hanna Instruments, Inc. are among the leading players operating in the pH buffer solution market.

What are the future trends of the pH buffer solution market?

The rising demand from the personal care industry is likely to set trends in the coming years.

Which region dominated the pH buffer solution market in 2023?

North America dominated the pH buffer solution market in 2023.

ハビ・ウマー
ハビ・ウマー
マネージャー、
市場調査とコンサルティング

ハビは、化学・素材セクターを専門とする8年間の経験を持つ、経験豊富な市場調査アナリストです。食品・飲料業界と消費財業界でも専門知識を有しています。ヴィシュワカルマ工科大学(VIT)で化学エンジニアの学位を取得し、工業用・特殊化学品、塗料・コーティング、紙・包装、潤滑油、消費財など、幅広い分野に精通しています。ハビのコアコンピテンシーは、市場規模の把握と予測、競合ベンチマーク、トレンド分析、顧客エンゲージメント、レポート作成、チームコーディネーションなどであり、実用的な洞察を提供し、戦略的な意思決定を支援することに長けています。

  • 過去2年間の分析、基準年、CAGRによる予測(7年間)
  • PEST分析とSWOT分析
  • 市場規模価値/数量 - 世界、地域、国
  • 業界と競争環境
  • Excel データセット

お客様の声

購入理由

  • 情報に基づいた意思決定
  • 市場動向の理解
  • 競合分析
  • 新興市場の特定
  • 顧客インサイト
  • 市場予測
  • リスク軽減
  • 業務効率の向上
  • 戦略計画
  • 投資の正当性
  • 業界イノベーションの追跡
  • 規制動向への対応
主な懸念事項への対応 - 質問と回答
購入前にレポートのサンプルを見ることはできますか?

はい!レポートの範囲(目次)、レポートの構成、そしてレポート全体の価値を評価するのに役立つ厳選されたインサイトを含む、レポートの無料サンプルをご提供しています。 「サンプルをダウンロード」ボタンをクリックするか、お問い合わせの上、サンプルをお送りください。

ご購入にはアナリストサポートが含まれていますか?

はい、アナリストによるサポートはパッケージに含まれています。ご購入後、アナリストにご連絡いただき、レポートの洞察や手法についてご説明したり、調査結果がお客様のビジネスニーズにどのように当てはまるかご相談いただけます。

注文後の手順を教えてください。

ご注文が完了すると、確認メールと請求書が届きます。

• 公開済みレポートの場合:4~6営業時間以内に、セキュリティ保護されたメールがお客様のメールアドレスに送信されます。
• 近日公開予定レポートの場合:ご注文は事前予約として記録されます。リリース予定日については、担当チームからご連絡し、最新情報をお知らせいたします。レポートが公開され次第、ご登録いただいたメールアドレスに配信いたします。

レポートは、お客様の特定のニーズに合わせてカスタマイズできますか?

お客様の特定の目的に合わせてレポートをカスタマイズするためのオプションをご用意しております。特定の地域、業界セグメント、競合他社の分析、データカットなど、より深い洞察が必要な場合でも、当社のリサーチチームがそれに応じてレポートをカスタマイズいたします。ご要望をお聞かせください。お客様に合わせたご提案やスコープを喜んでご提供いたします。

レポートはどのような形式で提供されますか?

レポートは、選択したライセンスに応じて、PDF形式またはExcelデータセットで提供されます。

PDF版では、完全な分析とビジュアルがすぐに読める形式で提供されます。Excelデータセットには、すべてのデータテーブルが含まれており、簡単に操作して詳細な分析を行うことができます。
ご購入時にライセンスオプションをご確認ください。または、ご購入に含まれる形式を確認するには、お問い合わせください。

プラットフォームの決済プロセスはどの程度安全ですか?

当社の決済プロセスは完全に安全で、PCI-DSSに準拠しています。

当社は、すべての取引が業界標準のSSL暗号化で保護されるよう、信頼性の高い暗号化された決済ゲートウェイを使用しています。お支払い情報は当社のサーバーに保存されることはありません。認定されたサードパーティの決済代行業者によって安全に処理されます。
お客様の個人情報と財務情報は当社で安全に保管されますので、安心してご購入いただけます。

複数のレポートをご購入いただく場合、特別価格はありますか?

はい、まとめ買いの場合は特別価格をご用意しております。
複数のレポートをご購入いただく場合は、お客様のニーズに合わせてカスタマイズされたバンドルオファーまたは数量ベースの割引をご提供いたします。ご検討中のレポートのリストを弊社の営業チームまでお送りください。お客様に合わせたお見積もりをお送りいたします。

ご購入前に、担当チームとレポートについてご相談させていただくことは可能でしょうか?

はい、もちろんです。
弊社のチームが、お客様が十分な情報に基づいて意思決定できるようお手伝いいたします。レポートの範囲、方法論、カスタマイズオプション、最適なライセンスなど、ご質問がございましたら、お気軽にお問い合わせください。 sales@theinsightpartners.com までご連絡ください。担当者が速やかにご連絡いたします。

ご購入時に請求書は発行されますか?

はい、ご購入が完了すると請求書が自動的に生成され、ご登録いただいたメールアドレスに送信されます。
特定の形式で請求書が必要な場合や、追加情報(会社名、GST、VAT情報など)が必要な場合は、お気軽にお問い合わせください。喜んでご対応させていただきます。

レポートにアクセスできない場合、サポートを受けることはできますか?

はい、もちろんです。
レポートへのアクセスや受信に問題が発生した場合は、サポートチームがサポートいたします。ご注文情報を添えて、メールまたはライブチャットでお問い合わせください。問題を迅速に解決し、お客様が中断することなくレポートにアクセスできるようお手伝いいたします。

当社のクライアント
Your data will never be shared with third parties, however, we may send you information from time to time about our products that may be of interest to you. By submitting your details, you agree to be contacted by us. You may contact us at any time to opt-out.

The List of Companies - pH Buffer Solution Market

  • Hamilton Co
  • Finetech Research and Innovation Corporation
  • FUJIFILM Holdings Corp
  • Hanna Instruments, Inc.
  • Bante Instruments Co., Ltd.
  • HACH Company
  • Thermo Fisher Scientific Inc.
  • Sensorex s.r.o.
  • Horiba Ltd
  • Mettler-Toledo International Inc.
  • RICCA Chemical Company
  • YSI Inc
  • Automated Water and Effluent Ltd
  • Otto Chemie Pvt. Ltd.
  • Sentek LtdJFE holdings Inc            
販売支援
US: +1-646-491-9876
UK: +44-20-8125-4005
Email: sales@theinsightpartners.com
チャットでお問い合わせください
DUNS Logo
87-673-9708
ISO Certified Logo
ISO 9001:2015
ISO Certified Logo

The Insight Partners performs research in 4 major stages: Data Collection & Secondary Research, Primary Research, Data Analysis and Data Triangulation & Final Review.

  1. Data Collection and Secondary Research:

As a market research and consulting firm operating from a decade, we have published and advised several client across the globe. First step for any study will start with an assessment of currently available data and insights from existing reports. Further, historical and current market information is collected from Investor Presentations, Annual Reports, SEC Filings, etc., and other information related to company’s performance and market positioning are gathered from Paid Databases (Factiva, Hoovers, and Reuters) and various other publications available in public domain.

Several associations trade associates, technical forums, institutes, societies and organization are accessed to gain technical as well as market related insights through their publications such as research papers, blogs and press releases related to the studies are referred to get cues about the market. Further, white papers, journals, magazines, and other news articles published in last 3 years are scrutinized and analyzed to understand the current market trends.

  1. Primary Research:

The primarily interview analysis comprise of data obtained from industry participants interview and answers to survey questions gathered by in-house primary team.

For primary research, interviews are conducted with industry experts/CEOs/Marketing Managers/VPs/Subject Matter Experts from both demand and supply side to get a 360-degree view of the market. The primary team conducts several interviews based on the complexity of the markets to understand the various market trends and dynamics which makes research more credible and precise.

A typical research interview fulfils the following functions:

  • Provides first-hand information on the market size, market trends, growth trends, competitive landscape, and outlook
  • Validates and strengthens in-house secondary research findings
  • Develops the analysis team’s expertise and market understanding

Primary research involves email interactions and telephone interviews for each market, category, segment, and sub-segment across geographies. The participants who typically take part in such a process include, but are not limited to:

  • Industry participants: VPs, business development managers, market intelligence managers and national sales managers
  • Outside experts: Valuation experts, research analysts and key opinion leaders specializing in the electronics and semiconductor industry.

Below is the breakup of our primary respondents by company, designation, and region:

Research Methodology

Once we receive the confirmation from primary research sources or primary respondents, we finalize the base year market estimation and forecast the data as per the macroeconomic and microeconomic factors assessed during data collection.

  1. Data Analysis:

Once data is validated through both secondary as well as primary respondents, we finalize the market estimations by hypothesis formulation and factor analysis at regional and country level.

  • Macro-Economic Factor Analysis:

We analyse macroeconomic indicators such the gross domestic product (GDP), increase in the demand for goods and services across industries, technological advancement, regional economic growth, governmental policies, the influence of COVID-19, PEST analysis, and other aspects. This analysis aids in setting benchmarks for various nations/regions and approximating market splits. Additionally, the general trend of the aforementioned components aid in determining the market's development possibilities.

  • Country Level Data:

Various factors that are especially aligned to the country are taken into account to determine the market size for a certain area and country, including the presence of vendors, such as headquarters and offices, the country's GDP, demand patterns, and industry growth. To comprehend the market dynamics for the nation, a number of growth variables, inhibitors, application areas, and current market trends are researched. The aforementioned elements aid in determining the country's overall market's growth potential.

  • Company Profile:

The “Table of Contents” is formulated by listing and analyzing more than 25 - 30 companies operating in the market ecosystem across geographies. However, we profile only 10 companies as a standard practice in our syndicate reports. These 10 companies comprise leading, emerging, and regional players. Nonetheless, our analysis is not restricted to the 10 listed companies, we also analyze other companies present in the market to develop a holistic view and understand the prevailing trends. The “Company Profiles” section in the report covers key facts, business description, products & services, financial information, SWOT analysis, and key developments. The financial information presented is extracted from the annual reports and official documents of the publicly listed companies. Upon collecting the information for the sections of respective companies, we verify them via various primary sources and then compile the data in respective company profiles. The company level information helps us in deriving the base number as well as in forecasting the market size.

  • Developing Base Number:

Aggregation of sales statistics (2020-2022) and macro-economic factor, and other secondary and primary research insights are utilized to arrive at base number and related market shares for 2022. The data gaps are identified in this step and relevant market data is analyzed, collected from paid primary interviews or databases. On finalizing the base year market size, forecasts are developed on the basis of macro-economic, industry and market growth factors and company level analysis.

  1. Data Triangulation and Final Review:

The market findings and base year market size calculations are validated from supply as well as demand side. Demand side validations are based on macro-economic factor analysis and benchmarks for respective regions and countries. In case of supply side validations, revenues of major companies are estimated (in case not available) based on industry benchmark, approximate number of employees, product portfolio, and primary interviews revenues are gathered. Further revenue from target product/service segment is assessed to avoid overshooting of market statistics. In case of heavy deviations between supply and demand side values, all thes steps are repeated to achieve synchronization.

We follow an iterative model, wherein we share our research findings with Subject Matter Experts (SME’s) and Key Opinion Leaders (KOLs) until consensus view of the market is not formulated – this model negates any drastic deviation in the opinions of experts. Only validated and universally acceptable research findings are quoted in our reports.

We have important check points that we use to validate our research findings – which we call – data triangulation, where we validate the information, we generate from secondary sources with primary interviews and then we re-validate with our internal data bases and Subject matter experts. This comprehensive model enables us to deliver high quality, reliable data in shortest possible time.