量子ドットディスプレイ市場のシェア、規模、需要(2034年まで)
過去データ : 2021-2024 | 基準年 : 2025 | 予測期間 : 2026-2034量子ドットディスプレイ市場規模と予測(2021年~2034年)、世界および地域別シェア、トレンド、成長機会分析レポートの対象範囲:材料別(カドミウムベース、カドミウムフリー、その他)、製品別(テレビ、モニター、タブレット、スマートフォン、医療機器、その他)、用途別(家電、ヘルスケア、自動車、ITおよび通信、その他)、地域別(北米、ヨーロッパ、アジア太平洋、南米および中米)
- ステータス : 公開されたデータ
- レポートコード : TIPRE00012051
- カテゴリー : エレクトロニクスおよび半導体
- ページ数 : 150
- 利用可能なレポート形式 :


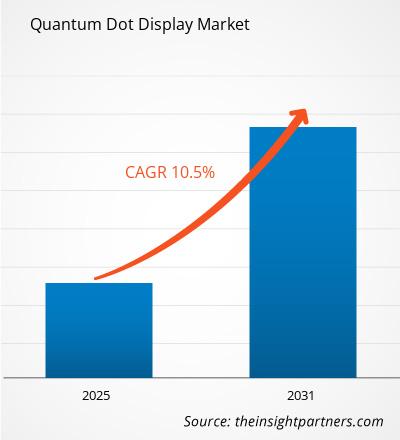
世界の量子ドットディスプレイ市場規模は、2025年の57億9000万米ドルから2034年には143億8000万米ドルに達すると予測されている。同市場は、2026年から2034年の予測期間中に年平均成長率(CAGR)10.65%を記録すると見込まれている。
量子ドットディスプレイ市場レポートは、材料(カドミウム系、カドミウムフリー、その他)、製品(テレビ、モニター、タブレット、スマートフォン、医療機器、その他)、用途(家電、ヘルスケア、自動車、ITおよび通信、その他)別の分析を網羅しています。グローバル分析は、地域レベルおよび主要国レベルでさらに細分化されています。本レポートでは、上記の分析およびセグメントごとの価格を米ドルで提供しています。
報告書の目的
The Insight Partnersによるレポート「量子ドットディスプレイ市場」は、現状と将来の成長、主要な推進要因、課題、機会を説明することを目的としています。これにより、以下のような様々なビジネス関係者に洞察が提供されます。
- テクノロジープロバイダー/メーカー:市場の動向の変化を理解し、潜在的な成長機会を把握することで、情報に基づいた戦略的意思決定を行うことができる。
- 投資家向け:市場成長率、市場の財務予測、およびバリューチェーン全体に存在する機会に関する包括的なトレンド分析を実施する。
- 規制機関:市場における政策を規制し、活動を監督することで、濫用を最小限に抑え、投資家の信頼を維持し、市場の健全性と安定性を確保することを目的としている。
量子ドットディスプレイ市場のセグメンテーション
材料
- カドミウムベース
- カドミウムフリー
製品
- テレビ
- モニター
- 錠剤
- スマートフォン
- 医療機器
応用
- 家電
- 健康管理
- 自動車
- ITおよび電気通信
地理
- 北米
- ヨーロッパ
- アジア太平洋
- 南米および中央アメリカ
- 中東およびアフリカ
お客様のご要望に合わせてこのレポートをカスタマイズしてください
無料カスタマイズ量子ドットディスプレイ市場:戦略的洞察
-
本レポートの主要市場トレンドをご覧ください。この無料サンプルには、市場動向から予測、見通しまで、幅広いデータ分析が含まれています。
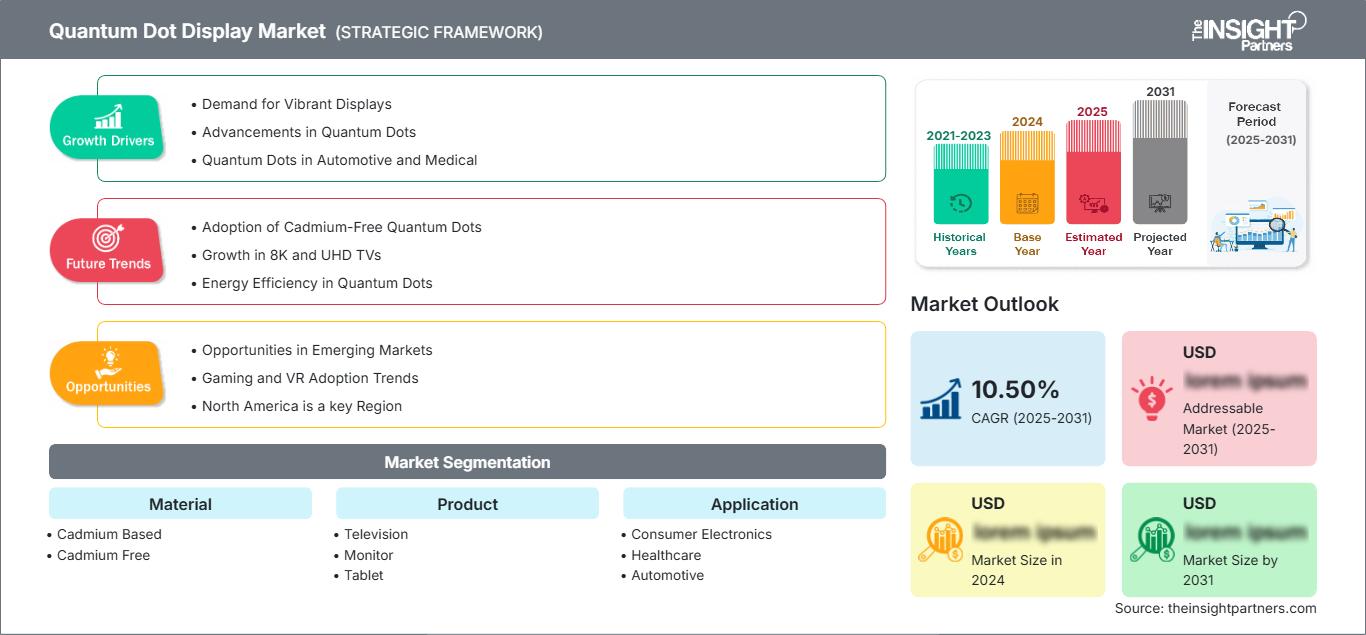
量子ドットディスプレイ市場の成長要因
- 鮮やかなディスプレイへの需要:テレビやスマートフォンなどの家電製品の普及により、鮮やかな色彩と高画質への需要が高まっています。人々はディスプレイの視覚的な美しさをますます求めるようになり、それが量子ドットディスプレイ市場の成長につながっています。市場レポートによると、この技術は高輝度と高い色精度を実現しており、普及を後押ししています。PEST分析によると、ディスプレイ品質の向上は現在の市場トレンドに合致しており、量子ドット技術の世界市場の大幅な成長を支えるものとなるでしょう。
- 量子ドットの進歩:量子ドットにおける継続的な技術進歩、すなわち高効率化と環境持続可能性が市場の成長を牽引しています。カドミウムフリー量子ドットの最近の開発は、製品の安全性と市場の魅力を向上させています。競合分析によると、これらの開発は企業が製品を差別化するのに役立ち、より多くのメーカーが量子ドットソリューションを採用することで市場規模が拡大しています。
- 自動車および医療分野における量子ドット:自動車用ヘッドアップディスプレイと医療画像処理は、市場規模の面で量子ドットの恩恵を最も大きく受ける分野の一つであることが明らかになっています。市場分析レポートによると、これらの分野での採用拡大は、競争力のある特殊ディスプレイへの需要を高め、市場全体の成長を支えるでしょう。
量子ドットディスプレイ市場の将来動向
- カドミウムフリー量子ドットの採用:SWOT分析によれば、この転換を行った企業は競争力の面で優位に立っており、業界が持続可能な慣行へと進むにつれて、市場ではカドミウムフリーの選択肢に対する需要が高まることがさらに示されるだろう。
- 8KおよびUHDテレビの成長:量子ドットディスプレイは、主に8KおよびUltra-HDテレビで使用され、ハイエンドの視聴品質のために優れた色深度と明るさを提供します。市場の動向を見ると、主要メーカーは高解像度テレビ向けに製品をアップグレードするために量子ドット技術を採用していることがわかっています。同社のSWOT分析では、この傾向がこの市場の成長要因として示されており、同社をプレミアム市場でより有利な立場に置いています。市場予測では、消費者の高品質なホームエンターテイメントへの需要の高まりに伴い、この市場は高い成長を遂げると予測されています。
- 量子ドットのエネルギー効率:量子ドットディスプレイのメーカーは、持続可能性を重視する市場の動向を受け、エネルギー効率の向上に注力しています。主要企業は、環境意識の高い消費者を惹きつけ、効率基準を満たすために、省エネ技術への投資を進めています。市場動向から判断すると、エネルギー効率の高い量子ドットディスプレイは今後も長期にわたり需要が続くと予想されます。これは、電力効率に優れた高性能ディスプレイへの需要が高まっているためであり、こうしたディスプレイは企業の持続可能なイノベーションを支援する上で役立ちます。
量子ドットディスプレイ市場の機会
- 新興市場における機会:アジア太平洋地域とラテンアメリカをはじめとする新興市場は、大きな成長機会を提供します。可処分所得の増加と、高級電子機器に対する顧客の嗜好が、これらの経済圏における需要の基盤となっています。これらの地域は、高い成長見通しを持つこれらの地域における市場シェア獲得の可能性を強調する市場概況の対象範囲を構成しています。そして、新興経済圏における成長を捉える方法は、これらの地域への投資です。したがって、大手メーカーは、高い成長可能性を秘めた有望な地域におけるグローバル市場での存在感を高めることで、恩恵を受けることになるでしょう。
- ゲームおよびVRの普及動向:ゲームおよびバーチャルリアリティ業界の成長に伴い、量子ドットディスプレイの新たな市場が開拓されています。これらの用途では、いずれも鮮やかな色彩と高いコントラストが求められるためです。業界動向分析によると、ゲームおよびVR向けディスプレイ技術に投資している企業は、この急成長分野でシェアを獲得できる可能性があります。
- 北米は重要な地域です。市場概況データによると、北米とアジア太平洋地域はこれらのアプリケーションにとって重要な地域であり、没入感のある高品質な映像に対する需要の高まりに伴い、成長の機会が広がっています。
量子ドットディスプレイ市場レポートの範囲
| レポート属性 | 詳細 |
|---|---|
| 2025年の市場規模 | 57億9000万米ドル |
| 2034年までの市場規模 | 143億8000万米ドル |
| 世界の年間平均成長率(2026年~2034年) | 10.65% |
| 履歴データ | 2021年~2024年 |
| 予測期間 | 2026年~2034年 |
| 対象分野 |
素材別
|
| 対象地域および国 |
北米
|
| 市場リーダーと主要企業の概要 |
|
量子ドットディスプレイ市場のプレーヤー密度:ビジネスダイナミクスへの影響を理解する
量子ドットディスプレイ市場は、消費者の嗜好の変化、技術革新、製品の利点に対する認識の高まりといった要因によるエンドユーザー需要の増加を背景に、急速に成長しています。需要の高まりに伴い、企業は製品ラインナップを拡充し、消費者のニーズに応えるべく革新を進め、新たなトレンドを活用することで、市場の成長をさらに加速させています。
主なセールスポイント
- 包括的な内容:本レポートは、量子ドットディスプレイ市場の製品、サービス、種類、エンドユーザーに関する分析を包括的に網羅し、全体像を提供します。
- 専門家による分析:本レポートは、業界の専門家およびアナリストの深い理解に基づいて作成されています。
- 最新情報:本レポートは、最新の情報とデータ動向を網羅しているため、ビジネスにおける関連性が保証されています。
- カスタマイズオプション:このレポートは、特定の顧客要件に対応し、ビジネス戦略に適切に適合するようにカスタマイズできます。
したがって、量子ドットディスプレイ市場に関する調査レポートは、業界の状況と成長見通しを解明し理解するための先導的な役割を果たすことができます。いくつかの懸念事項はあるものの、このレポートの全体的なメリットはデメリットを上回る傾向があります。

Naveenは、カスタム、シンジケート、コンサルティングの各プロジェクトにおいて9年以上の実績を持つ、経験豊富な市場調査およびコンサルティングのプロフェッショナルです。現在はアソシエイトバイスプレジデントを務め、プロジェクトバリューチェーン全体にわたるステークホルダー管理を成功させ、100件以上の調査レポートと30件以上のコンサルティング案件を執筆しています。産業および政府機関のプロジェクトに幅広く携わり、クライアントの成功とデータに基づく意思決定に大きく貢献しています。
Naveenは、カルナータカ州VTUで電子通信工学の学位を取得し、マニパル大学でマーケティング&オペレーションズのMBAを取得しています。IEEEの会員として9年間活動し、会議や技術シンポジウムへの参加、セクションレベルおよび地域レベルでのボランティア活動に積極的に取り組んでいます。現職以前は、IndustryARCでアソシエイト戦略コンサルタント、Hewlett Packard(HP Global)で産業用サーバーコンサルタントを務めていました。
- 過去2年間の分析、基準年、CAGRによる予測(7年間)
- PEST分析とSWOT分析
- 市場規模価値/数量 - 世界、地域、国
- 業界と競争環境
- Excel データセット
お客様の声
Insight PartnersのSCADAシステム市場レポートは包括的で、現在のトレンドと将来の予測に関する貴重な洞察が含まれています。チームは終始、非常にプロフェッショナルで、対応が早く、サポートも充実していました。私たちは彼らのサービスに非常に満足しており、強くお勧めします。
ラン・ケデム パートナー, レアリテクノロジーズ株式会社非常に特殊なソフトウェア市場に関するレポートを依頼したところ、チームは数日でレポートを作成してくれました。情報は非常に関連性が高く、分かりやすくまとめられていました。その後、レポートにいくつか修正と追加を依頼しましたが、チームは非常に迅速に対応し、1週間も経たないうちに最終レポートを受け取ることができました。
ジャン=エルヴェ・ジェン 会長, フューチャー・アナリティカ重要な市場調査と予測のために、The Insight Partnersと協力しました。彼らは機会とリスクに関する明確な洞察を提供し、私たちの計画策定に役立ちました。彼らの調査は使いやすく、確かなデータに基づいており、賢明で自信に満ちた意思決定に役立ちました。彼らを強くお勧めします。
ピユーシュ・ナグパル 上級副社長, ハイビームグローバルInsight Partnersは、深い専門知識に基づき、洞察力に富み、構造化された市場調査を提供しました。チームは終始プロフェッショナルで、対応力も抜群でした。ユーザーフレンドリーなウェブサイトにより、業界レポートへのアクセスもスムーズでした。信頼性の高い高品質な調査サービスをお探しなら、Insight Partnersを強くお勧めします。
安達幸彦 最高経営責任者(CEO), ディープブルーLLC。The Insight Partnersから市場レポートを購入するのは今回が初めてです。最初は不安でしたが、ウェブサイトを見て、リスクを負ってでも購入してみようという気持ちになりました。レポートの品質とカスタマーサービスには大変満足しています。最初のレポートにはいくつか質問やコメントがありましたが、アナリストとメールで何度かやり取りした結果、戦略策定プロセスへのインプットとして活用できるレポートが完成しました。貴重なお時間を割いていただき、貴重な体験をさせていただき、誠にありがとうございました。他の方にもぜひお勧めしたいですし、今後さらに市場データが必要になった際には、まずThe Insight Partnersにご連絡させていただきます。
ジョン・スズキ 社長兼最高経営責任者、取締役, BKテクノロジーズナイジェリアの感染症IVD市場に関する情報提供依頼に対し、ご対応いただいた際、ご尽力とプロフェッショナルな姿勢に深く感謝申し上げます。忍耐強く、的確なアドバイスをいただき、また、最終的に取引成立に至った割引のご提供にも深く感謝申し上げます。今回の最初の出会いで得た強い印象のおかげで、今後もThe Insight Partnersとの連携を心待ちにしております。
チジオケ博士 オニア マネージングディレクター, パインクレストヘルスケア株式会社購入理由
- 情報に基づいた意思決定
- 市場動向の理解
- 競合分析
- 顧客インサイト
- 市場予測
- リスク軽減
- 戦略計画
- 投資の正当性
- 新興市場の特定
- マーケティング戦略の強化
- 業務効率の向上
- 規制動向への対応


 無料サンプルを入手 - 量子ドットディスプレイ市場