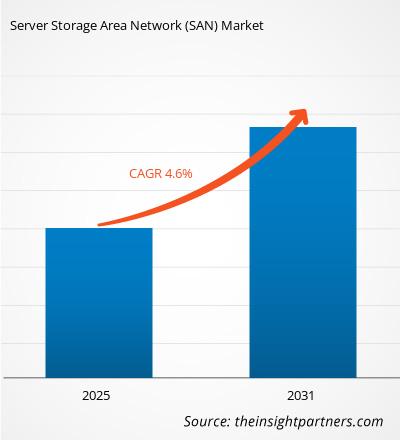
サーバー ストレージ エリア ネットワーク (SAN) 市場規模レポート、成長および予測 - 2031 年

  • Report Code : TIPRE00025023
  • Category : Technology, Media and Telecommunications
  • Status : Upcoming
  • No. of Pages : 150
Buy Now

[調査レポート] サーバー ストレージ エリア ネットワーク (SAN) の市場規模は、2022 年の 190 億 3000 万米ドルから 2030 年までに 273 億米ドルに成長すると予想されています。 2022 年から 2030 年にかけて 4.6% の CAGR で成長すると推定されています。

アナリストの視点:

サーバー ストレージ エリア ネットワーク (SAN) 市場は、より高速なデータ アクセスに対する需要の高まり、データ セキュリティの向上に対するニーズの高まり、サイバー攻撃の数の増加により、近年大幅な成長を遂げています。さらに、IoT デバイスの需要の増加とデータセンターの数の増加により、市場成長の有利な機会が提供されています。クラウドベースのストレージ サービスの採用は、サーバー ストレージ エリア ネットワーク (SAN) 市場の成長の重要なトレンドとして浮上しています。ただし、SAN は比較的複雑で、高価で、非常に高度なストレージ ネットワークです。最近発生したクラウドの大規模な停止やパフォーマンスの問題の多くは、SAN の障害に関連しています。 SAN は複雑で収益性が高いため、SAN アーキテクチャに障害が発生すると、企業にとって重大かつ複雑な問題が発生し、サーバー ストレージ エリア ネットワーク (SAN) 市場の成長が抑制されることになります。< /p>

さらに、中堅・中小企業 (SME) の拡大に伴い、サーバー ストレージ エリア ネットワーク (SAN) の使用が世界的に増加しています。中小企業におけるストレージ エリア ネットワーク (SAN) 導入の主な推進要因は、柔軟性、クラウド リソース、一元化された電源などの利点です。世界中の全企業のほぼ 99% が中小企業 (SME) です。これらの要因が市場の拡大を加速すると予測されています。

市場

概要:

サーバー ストレージ エリア ネットワーク (SAN) は、ビジネス クリティカルなアプリケーションに高スループットと低遅延を提供する、一般的なストレージ ネットワーキング設計です。 SAN は、ネットワーク全体で均一なセキュリティ手順を備えた高速アーキテクチャを使用して、データをブロックに保存し、異なる層に分割します。これにより、データのセキュリティと保護が強化され、さらに効率的なデータ ストレージが実現します。 SAN は、ネットワーク全体で均一なセキュリティ手順を備えた高速アーキテクチャを使用して、データをブロックに保存し、異なる層に分割します。これにより、データのセキュリティと保護が強化され、さらに効率的なデータ ストレージが実現します。

大部分の企業は、組織の重要な顧客データを保持する仮想ネットワークであるストレージ エリア ネットワークを使用しています。別々のデバイスとサーバー上で。政府機関、教育、小売、銀行、電気通信、保険、金融サービスなど、さまざまな分野の企業がサーバー ストレージ エリア ネットワーク (SAN) を使用しています。これらのビジネスでは、ハイブリッド マルチクラウドの運用や仮想化アプリケーションを実行するために、ハイパフォーマンス コンピューティングが必要になることがよくあります。膨大なデータを処理するには、サーバー ストレージ エリア ネットワーク (SAN) の大規模なデータ ストレージ容量も必要です。

戦略的洞察

市場の推進力:

市場の成長を促進する企業全体にわたるサイバー攻撃の数の増加

サイバー攻撃は、2020 年に 5 番目に高いリスクと評価されており、テクノロジーの進歩により日に日に増加しています。サイバー リスクの例には、コンピューター マルウェア、データ侵害、サービス妨害 (DoS) などがあります。企業は継続的にサイバー犯罪の脅威にさらされています。近年、サイバー攻撃はさらに広範囲に及んでいます。パンデミック期間中、企業がリモート作業環境に移行する中、サイバー犯罪者は不整合なネットワークを悪用しました。たとえば、OneLogin によると、サイバー犯罪による世界の被害額は 1 兆米ドルを超え、2020 年には組織の 37% がランサムウェアの影響を受け、61% がマルウェア攻撃の影響を受けました。2019 年から 2020 年にかけて、米国におけるサイバー攻撃は増加しました。 139%増加しました。 2020年第3四半期だけで1億4,520万件という驚異的な件数がありました。 2020 年のマルウェア攻撃は、2019 年と比較して 358% 増加しました。同様に、Clusit レポートによると、2021 年には世界中のサイバー攻撃が前年と比較して 10% 増加しました。 2021 年に世界中でサイバー攻撃が 125% 増加し、2022 年もサイバー攻撃の量の増加が企業や個人を脅かし続けました。たとえば、AAG によると、2022 年のインターネット ユーザー 100 万人当たりのサイバー犯罪被害者数が最も多かったのは英国で 4783 人でした。 , 2020 年の数字と比べて 40% 増加しました。 2022 年のサイバー侵害の平均コストは 435 万米ドルで、この数字は 2025 年までに 10 兆 5000 億米ドルに増加すると予測されています。

サイバー脅威は、今日のデジタル環境における大きな懸念事項です。これらは個人、企業、政府に深刻な影響を及ぼします。サイバー攻撃の防止は不可欠です。サイバー攻撃の増加により、重要なインフラを保護し、個人や組織の安全を確保するためのサイバーセキュリティの重要性が高まっています。サーバー ストレージ エリア ネットワーク (SAN) を使用して一元化された共有ストレージにデータを保存することで、組織はセキュリティ、データ保護、災害復旧のための一貫した方法論とツールを適用できるようになります。サーバーのストレージ エリア ネットワーク (SAN) システムは、不正アクセス、データ侵害、サイバー攻撃から保護するだけでなく、データ暗号化も提供します。さらに、SAN ストレージ デバイスには、セキュア ブート、ハードウェア暗号化、アクセス制御などのセキュリティ機能が組み込まれています。サーバー ストレージ エリア ネットワーク (SAN) は、企業がデータの安全性とプライバシーを強化するために重要なセキュリティ対策を迅速に導入するのに役立ちます。

したがって、企業全体にわたるサイバー攻撃の増加により、企業の成長が促進されています。

セグメンテーションと範囲:

「サーバー ストレージ エリア ネットワーク (SAN)」 ) マーケット」は、コンポーネント、SAN タイプ、組織規模、業種、地理に基づいてセグメント化されています。コンポーネントに基づいて、市場はハードウェア、ソフトウェア、サービスに分類されます。 SAN のタイプに基づいて、市場はハイパースケール サーバー SAN とエンタープライズ サーバー SAN に分類されます。組織の規模に基づいて、サーバー ストレージ エリア ネットワーク (SAN) 市場は大企業と中小企業に分類されます。垂直に基づいて、市場はBFSI、IT、およびITに分類されます。電気通信、政府、ヘルスケア、製造、小売、および電子商取引、その他。市場は地理に基づいて、北米、ヨーロッパ、アジア太平洋、中東、およびアジア太平洋地域に分類されます。アフリカ、南アメリカ。

セグメント分析:

組織の規模に基づいて、市場は大企業と中小企業に分類されます。サーバー ストレージ エリア ネットワーク (SAN) 市場における大企業セグメントは、2022 年に最大のシェアを獲得すると予想されています。テクノロジーの進歩に伴い、ビジネス ストレージのニーズが大幅に増加しています。サーバー ストレージ エリア ネットワーク (SAN) は、サーバーのパフォーマンスを向上させ、データ管理手順を合理化するために、大企業で継続的に採用されています。サーバー ストレージ エリア ネットワーク (SAN) は、信頼性の高いファイル サーバーとして機能し、組織全体にドキュメントとデータを提供し、データ ストレージとバックアップの中心点を提供します。

地域分析:

北米は世界最大の市場シェアを保持しています。北米地域のさまざまな業界におけるハイテク導入の傾向により、サーバー ストレージ エリア ネットワーク (SAN) 市場の成長が促進されています。デジタルツールの採用の増加や政府機関による高額な技術支出などの要因が、北米市場の成長を促進すると予想されます。さらに、米国とカナダの先進国では研究開発が重視されているため、北米のプレーヤーは技術的に高度なソリューションを市場に投入する必要に迫られています。さらに、北米諸国におけるストレージ エリア ネットワーク (SAN) ソリューションの浸透と採用の増加が市場の成長を推進しています。さらに、米国には多数のサーバー ストレージ エリア ネットワーク (SAN) 市場プレーヤーが存在し、革新的なソリューションの開発にますます注力しています。サーバー ストレージ エリア ネットワーク (SAN) 市場の主要企業には、IBM Corporation、Hewlett Packard Enterprise Development LP、Dell Inc. などがあります。シスコシステムズ社など。これらすべての要因がこの地域の市場の成長に貢献しています。

主要企業の分析:

サーバー ストレージ エリア ネットワーク (SAN) 市場分析は、IBM Corporation などのプレーヤーで構成されています。ヒューレット・パッカード エンタープライズ開発 LP。デル株式会社;シスコシステムズ株式会社;レノボ・グループ; MSysテクノロジーズ;アリスタネットワークス株式会社;日本電気株式会社;ブロケード コミュニケーション システムズ社; NetApp は、レポートで紹介されているサーバー ストレージ エリア ネットワーク (SAN) 市場の主要企業の 1 つです。

最近の展開:

 < /p>

合併や買収などの無機的および有機的な戦略は、市場の企業によって高度に採用されています。最近の主要なサーバー ストレージ エリア ネットワーク (SAN) 市場の動向をいくつか以下に示します。

  • 2023 年 6 月、Hewlett Packard Enterprise (HPE) は、 32Gb ファイバー チャネル接続を備えたサービスとしてのストレージ (SaaS) のラインナップ。 HPE Alletra Storage MP ハードウェアを搭載した HPE GreenLake for Block Storage MP は、従来の SCSI ベースの FC または NVMe over FC 接続を使用してストレージ エリア ネットワーク (SAN) に接続された次世代プラットフォームを備えています。
  • 2023 年 11 月、Lenovo は、ThinkSystem V3 上の IBM ストレージ スケール (DSS-G) 用の分散ストレージ ソリューションを発表しました。 Lenovo Distributed Storage Solution for IBM Storage Scale (DSS-G) は、高性能でデータ集約型の環境に適した、高密度でスケーラブルなファイルおよびオブジェクト ストレージのためのソフトウェア デファインド ストレージ (SDS) ソリューションです。 DSS-G は、Lenovo ThinkSystem サーバー、Lenovo ストレージ エンクロージャー、業界をリードする IBM Storage Scale ソフトウェアのパフォーマンスを組み合わせて、現代のストレージのニーズに応える高性能でスケーラブルなビルディング ブロック アプローチを提供します。
  • ThinkSystem AMD EPYC 9004 シリーズ プロセッサー、Lenovo ストレージ エンクロージャー、業界をリードする IBM Storage Scale ソフトウェアを搭載した SR655 V3 2U サーバーは、現代のストレージ ニーズに対応する高性能でスケーラブルなビルディング ブロック アプローチを提供します。
Report Coverage
Report Coverage

Revenue forecast, Company Analysis, Industry landscape, Growth factors, and Trends

Segment Covered
Segment Covered

This text is related
to segments covered.

Regional Scope
Regional Scope

North America, Europe, Asia Pacific, Middle East & Africa, South & Central America

Country Scope
Country Scope

This text is related
to country scope.

The List of Companies

1. Advanced Network Solutions, LLC
2. Arista Networks, Inc.
3. Cisco Systems, Inc.
4. Dell Inc.
5. Hewlett Packard Enterprise Development LP
6. iCorps Technologies, Inc.
7. Lenovo Group
8. MSys Technologies
9. Thomas-Krenn.AG
10. Zones, LLC

The Insight Partners performs research in 4 major stages: Data Collection & Secondary Research, Primary Research, Data Analysis and Data Triangulation & Final Review.

  1. Data Collection and Secondary Research:

As a market research and consulting firm operating from a decade, we have published and advised several client across the globe. First step for any study will start with an assessment of currently available data and insights from existing reports. Further, historical and current market information is collected from Investor Presentations, Annual Reports, SEC Filings, etc., and other information related to company’s performance and market positioning are gathered from Paid Databases (Factiva, Hoovers, and Reuters) and various other publications available in public domain.

Several associations trade associates, technical forums, institutes, societies and organization are accessed to gain technical as well as market related insights through their publications such as research papers, blogs and press releases related to the studies are referred to get cues about the market. Further, white papers, journals, magazines, and other news articles published in last 3 years are scrutinized and analyzed to understand the current market trends.

  1. Primary Research:

The primarily interview analysis comprise of data obtained from industry participants interview and answers to survey questions gathered by in-house primary team.

For primary research, interviews are conducted with industry experts/CEOs/Marketing Managers/VPs/Subject Matter Experts from both demand and supply side to get a 360-degree view of the market. The primary team conducts several interviews based on the complexity of the markets to understand the various market trends and dynamics which makes research more credible and precise.

A typical research interview fulfils the following functions:

  • Provides first-hand information on the market size, market trends, growth trends, competitive landscape, and outlook
  • Validates and strengthens in-house secondary research findings
  • Develops the analysis team’s expertise and market understanding

Primary research involves email interactions and telephone interviews for each market, category, segment, and sub-segment across geographies. The participants who typically take part in such a process include, but are not limited to:

  • Industry participants: VPs, business development managers, market intelligence managers and national sales managers
  • Outside experts: Valuation experts, research analysts and key opinion leaders specializing in the electronics and semiconductor industry.

Below is the breakup of our primary respondents by company, designation, and region:

Research Methodology

Once we receive the confirmation from primary research sources or primary respondents, we finalize the base year market estimation and forecast the data as per the macroeconomic and microeconomic factors assessed during data collection.

  1. Data Analysis:

Once data is validated through both secondary as well as primary respondents, we finalize the market estimations by hypothesis formulation and factor analysis at regional and country level.

  • Macro-Economic Factor Analysis:

We analyse macroeconomic indicators such the gross domestic product (GDP), increase in the demand for goods and services across industries, technological advancement, regional economic growth, governmental policies, the influence of COVID-19, PEST analysis, and other aspects. This analysis aids in setting benchmarks for various nations/regions and approximating market splits. Additionally, the general trend of the aforementioned components aid in determining the market's development possibilities.

  • Country Level Data:

Various factors that are especially aligned to the country are taken into account to determine the market size for a certain area and country, including the presence of vendors, such as headquarters and offices, the country's GDP, demand patterns, and industry growth. To comprehend the market dynamics for the nation, a number of growth variables, inhibitors, application areas, and current market trends are researched. The aforementioned elements aid in determining the country's overall market's growth potential.

  • Company Profile:

The “Table of Contents” is formulated by listing and analyzing more than 25 - 30 companies operating in the market ecosystem across geographies. However, we profile only 10 companies as a standard practice in our syndicate reports. These 10 companies comprise leading, emerging, and regional players. Nonetheless, our analysis is not restricted to the 10 listed companies, we also analyze other companies present in the market to develop a holistic view and understand the prevailing trends. The “Company Profiles” section in the report covers key facts, business description, products & services, financial information, SWOT analysis, and key developments. The financial information presented is extracted from the annual reports and official documents of the publicly listed companies. Upon collecting the information for the sections of respective companies, we verify them via various primary sources and then compile the data in respective company profiles. The company level information helps us in deriving the base number as well as in forecasting the market size.

  • Developing Base Number:

Aggregation of sales statistics (2020-2022) and macro-economic factor, and other secondary and primary research insights are utilized to arrive at base number and related market shares for 2022. The data gaps are identified in this step and relevant market data is analyzed, collected from paid primary interviews or databases. On finalizing the base year market size, forecasts are developed on the basis of macro-economic, industry and market growth factors and company level analysis.

  1. Data Triangulation and Final Review:

The market findings and base year market size calculations are validated from supply as well as demand side. Demand side validations are based on macro-economic factor analysis and benchmarks for respective regions and countries. In case of supply side validations, revenues of major companies are estimated (in case not available) based on industry benchmark, approximate number of employees, product portfolio, and primary interviews revenues are gathered. Further revenue from target product/service segment is assessed to avoid overshooting of market statistics. In case of heavy deviations between supply and demand side values, all thes steps are repeated to achieve synchronization.

We follow an iterative model, wherein we share our research findings with Subject Matter Experts (SME’s) and Key Opinion Leaders (KOLs) until consensus view of the market is not formulated – this model negates any drastic deviation in the opinions of experts. Only validated and universally acceptable research findings are quoted in our reports.

We have important check points that we use to validate our research findings – which we call – data triangulation, where we validate the information, we generate from secondary sources with primary interviews and then we re-validate with our internal data bases and Subject matter experts. This comprehensive model enables us to deliver high quality, reliable data in shortest possible time.

Your data will never be shared with third parties, however, we may send you information from time to time about our products that may be of interest to you. By submitting your details, you agree to be contacted by us. You may contact us at any time to opt-out.

Related Reports