ソフトウェア定義データセンター市場の動向、規模、および2034年までの予測
過去データ : 2021-2024 | 基準年 : 2025 | 予測期間 : 2026-2034ソフトウェア定義データセンター市場規模と予測(2021年~2034年)、世界および地域別シェア、トレンド、成長機会分析レポート 対象範囲:コンポーネント別[ハードウェア、ソフトウェア、サービス(トレーニング&コンサルティング、統合&導入、サポート&メンテナンス、マネージドサービス)]、タイプ別[ソフトウェア定義コンピューティング(SDC)、ソフトウェア定義ストレージ(SDS)、ソフトウェア定義データセンターネットワーキング(SDDCN)、自動化&オーケストレーション]、企業規模別(大企業、中小企業)、業界別(BFSI、IT&通信、ヘルスケア、政府&防衛、教育、小売、製造、その他)、地域別(北米、ヨーロッパ、アジア太平洋、南米&中米)
- ステータス : 公開されたデータ
- レポートコード : TIPTE100000248
- カテゴリー : テクノロジー、メディア、通信
- ページ数 : 193
- 利用可能なレポート形式 :


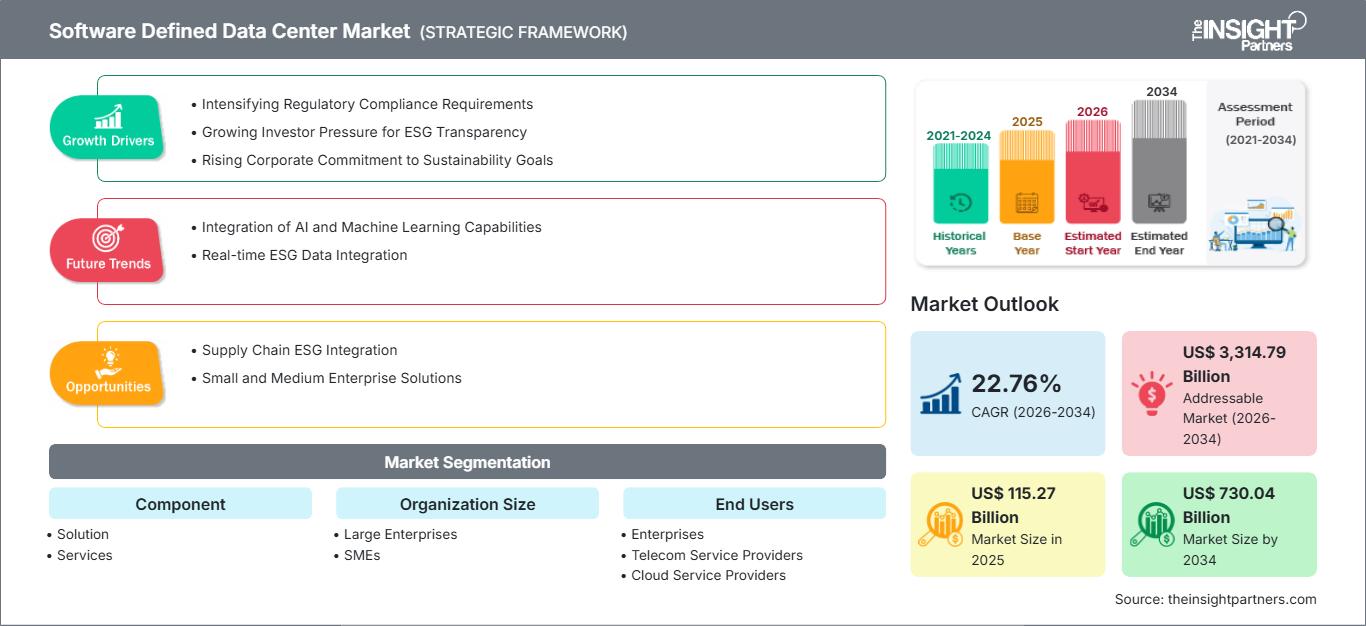
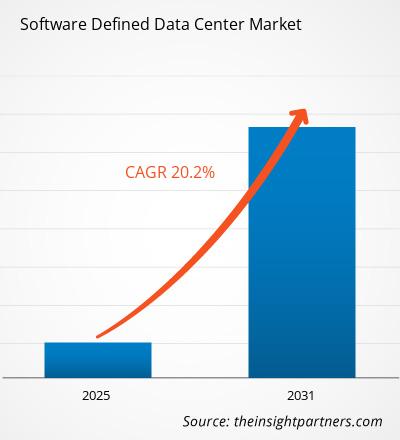
世界のソフトウェア定義データセンター市場規模は、2025年の1,152億7,000万米ドルから2034年には7,300億4,000万米ドルに達すると予測されています。同市場は、2026年から2034年の予測期間中に年平均成長率(CAGR)22.76%を記録すると見込まれています。
本レポートは、コンポーネント(ソリューション、サービス)、組織規模(大企業、中小企業)、エンドユーザー(企業、通信サービスプロバイダー、クラウドサービスプロバイダー、マネージドサービスプロバイダー)別にセグメント化されています。グローバル分析は、さらに地域レベルおよび主要国別に細分化されています。本レポートでは、上記の分析およびセグメントの金額を米ドルで提供しています。
報告書の目的
The Insight Partnersによるレポート「ソフトウェア定義データセンター市場」は、現状と将来の成長、主要な推進要因、課題、機会を説明することを目的としています。これにより、以下のような様々なビジネス関係者に洞察が提供されます。
- テクノロジープロバイダー/メーカー:市場の動向の変化を理解し、潜在的な成長機会を把握することで、情報に基づいた戦略的意思決定を行うことができる。
- 投資家向け:市場成長率、市場の財務予測、およびバリューチェーン全体に存在する機会に関する包括的なトレンド分析を実施する。
- 規制機関:市場における政策を規制し、活動を監督することで、濫用を最小限に抑え、投資家の信頼を維持し、市場の健全性と安定性を確保することを目的としている。
ソフトウェア定義データセンター市場のセグメンテーション
成分
- 解決
- サービス
組織規模
- 大企業
- 中小企業
エンドユーザー
- 企業
- 通信サービスプロバイダー
- クラウドサービスプロバイダー
- マネージドサービスプロバイダー
地理
- 北米
- ヨーロッパ
- アジア太平洋地域
- 中東およびアフリカ
- 南米および中央アメリカ
お客様のご要望に合わせてこのレポートをカスタマイズしてください
無料カスタマイズソフトウェア定義データセンター市場:戦略的洞察
-
本レポートの主要市場トレンドをご覧ください。この無料サンプルには、市場動向から予測、見通しまで、幅広いデータ分析が含まれています。
ソフトウェア定義データセンター市場の成長要因
- 規制遵守要件の厳格化:ESG報告に関するグローバルな規制環境は、ますます複雑かつ厳格化しています。EUのCSRD、SECの気候変動情報開示規則、各国の様々な義務付けといった新たな規制により、企業は高度な報告ソリューションの導入を迫られています。ESG報告ソフトウェアは、こうした進化する要件に対応するため、自動コンプライアンスチェック、標準化されたフレームワーク、監査対応可能な文書作成機能を提供します。複数の報告基準を同時に追跡し、異なる管轄区域間でデータの正確性と一貫性を確保できるこのソフトウェアは、複数の規制環境で事業を展開する企業にとって不可欠です。
- ESG透明性に対する投資家の圧力の高まり:機関投資家やステークホルダーは、ESG開示における透明性と詳細度の向上を求めています。企業は、投資家のデューデリジェンス要件を満たすESG指標を収集、検証、報告するための堅牢なソフトウェアソリューションを必要としています。このソフトウェアにより、企業は詳細なサステナビリティパフォーマンスデータ、影響評価、ESG目標に対する進捗状況の追跡を提供できます。投資家がESGパフォーマンスを投資判断にますます組み込むようになるにつれ、この機能は上場企業や持続可能な資金調達を求める企業にとって特に重要になります。
- 企業のサステナビリティ目標への取り組みの高まり:企業は野心的なサステナビリティ目標を設定し、その進捗状況を追跡・報告するための高度なツールを必要としています。ESG報告ソフトウェアは、環境への影響、社会貢献活動、ガバナンス慣行をリアルタイムでモニタリングできます。これらのプラットフォームにより、企業は炭素排出量の測定、資源消費量の追跡、サプライチェーンのサステナビリティのモニタリング、社会的影響指標の評価が可能になります。ソフトウェアの分析機能は、企業が改善すべき領域を特定し、サステナビリティへの取り組みにおける具体的な進捗状況を示すのに役立ちます。
ソフトウェア定義データセンター市場の将来動向
- AIと機械学習機能の統合:ESG報告プラットフォームは、データ収集、分析、報告機能を強化するために、AIと機械学習をますます取り入れるようになっています。これらの技術により、さまざまなソースからのデータ自動抽出、ESG指標の異常検出、サステナビリティパフォーマンスの予測分析が可能になります。AIを活用した機能は、組織がトレンドを特定し、影響を予測し、より正確なサステナビリティレポートを作成するのに役立つと同時に、手作業や潜在的な人的ミスを削減します。
- リアルタイムESGデータ統合:市場は、リアルタイムESGデータ収集および報告機能へと移行しつつあります。企業は、定期的な手動更新に頼るのではなく、ESG指標を継続的に監視・更新できるプラットフォームを求めています。この傾向は、ESGパフォーマンスに関する意思決定とステークホルダーとのコミュニケーションをより迅速に行う必要性によって推進されています。リアルタイム監視により、問題の即時特定とサステナビリティ課題への迅速な対応が可能になります。
ソフトウェア定義データセンター市場の機会
- サプライチェーンにおけるESG統合:ESG報告ソフトウェアがサプライチェーンのサステナビリティ監視へと拡大する大きな機会があります。企業は、サプライヤーのESGパフォーマンスを追跡・報告し、バリューチェーン全体でサステナビリティ基準への準拠を確保するためのツールを必要としています。ソフトウェアプラットフォームは、サプライヤー評価、サステナビリティ認証の監視、サプライネットワーク全体のESGデータの集約を容易にし、スコープ3排出量やその他の間接的な影響に関する包括的な報告を可能にします。
- 中小企業向けソリューション:中小企業セグメントは、簡素化され費用対効果の高いESG報告ソリューションにとって、ますます大きなビジネスチャンスとなっています。サステナビリティ報告の要件が小規模組織にも拡大するにつれ、大企業規模のソリューションのような複雑さを伴わずに、必要不可欠な報告機能を提供する合理化されたプラットフォームへの需要が高まっています。ソフトウェアプロバイダーは、中小企業が基本的な報告要件を満たしつつ、手頃な価格を維持できるよう、専門的なソリューションを開発することができます。
ソフトウェア定義データセンター市場レポートの範囲
| レポート属性 | 詳細 |
|---|---|
| 2025年の市場規模 | 1152億7000万米ドル |
| 2034年までの市場規模 | 7300億4000万米ドル |
| 世界の年間平均成長率(2026年~2034年) | 22.76% |
| 履歴データ | 2021年~2024年 |
| 予測期間 | 2026年~2034年 |
| 対象分野 |
コンポーネント別
|
| 対象地域および国 |
北米
|
| 市場リーダーと主要企業の概要 |
|
ソフトウェア定義データセンター市場のプレーヤー密度:ビジネスダイナミクスへの影響を理解する
ソフトウェア定義データセンター市場は、消費者の嗜好の変化、技術革新、製品のメリットに対する認識の高まりといった要因によるエンドユーザー需要の増加を背景に、急速に成長しています。需要の高まりに伴い、企業は製品・サービスの提供範囲を拡大し、消費者のニーズに応えるべく革新を進め、新たなトレンドを活用することで、市場の成長をさらに加速させています。
主なセールスポイント
- 包括的な内容:本レポートは、ソフトウェア定義データセンター市場の製品、サービス、種類、エンドユーザーに関する分析を包括的に網羅し、全体像を提供します。
- 専門家による分析:本レポートは、業界の専門家およびアナリストの深い理解に基づいて作成されています。
- 最新情報:本レポートは、最新の情報とデータ動向を網羅しているため、ビジネスにおける関連性が保証されています。
- カスタマイズオプション:このレポートは、特定の顧客要件に対応し、ビジネス戦略に適切に適合するようにカスタマイズできます。
したがって、ソフトウェア定義データセンター市場に関する調査レポートは、業界の状況と成長見通しを解明し理解するための先導的な役割を果たすことができます。いくつかの懸念事項はあるものの、このレポートの全体的なメリットはデメリットを上回る傾向があります。

アンキタは、テクノロジー、メディア、ICT、エレクトロニクス・半導体の各分野で8年以上の経験を持つ、ダイナミックな市場調査およびコンサルティングのプロフェッショナルです。Microsoft、Oracle、NEC、SAP、KPMG、Expeditors Internationalといったグローバルクライアントに対し、100件以上のコンサルティングおよび調査案件を主導・遂行してきました。彼女のコアコンピテンシーは、市場評価、データ分析、予測、戦略策定、競合情報、レポート作成です。
アンキタは、販売前の提案書作成やクライアントとの協議から、販売後の実用的なインサイトの提供まで、プロジェクトサイクル全体を巧みに管理することに長けています。彼女は、部門横断的なチームの管理、複雑な調査モジュールの構築、そしてクライアント固有のビジネス目標に合わせたソリューションの調整に長けています。優れたコミュニケーション能力、リーダーシップ、そしてプレゼンテーション能力により、急速に変化する市場環境において、常に価値主導の成果を生み出しています。
- 過去2年間の分析、基準年、CAGRによる予測(7年間)
- PEST分析とSWOT分析
- 市場規模価値/数量 - 世界、地域、国
- 業界と競争環境
- Excel データセット
お客様の声
Insight PartnersのSCADAシステム市場レポートは包括的で、現在のトレンドと将来の予測に関する貴重な洞察が含まれています。チームは終始、非常にプロフェッショナルで、対応が早く、サポートも充実していました。私たちは彼らのサービスに非常に満足しており、強くお勧めします。
ラン・ケデム パートナー, レアリテクノロジーズ株式会社非常に特殊なソフトウェア市場に関するレポートを依頼したところ、チームは数日でレポートを作成してくれました。情報は非常に関連性が高く、分かりやすくまとめられていました。その後、レポートにいくつか修正と追加を依頼しましたが、チームは非常に迅速に対応し、1週間も経たないうちに最終レポートを受け取ることができました。
ジャン=エルヴェ・ジェン 会長, フューチャー・アナリティカ重要な市場調査と予測のために、The Insight Partnersと協力しました。彼らは機会とリスクに関する明確な洞察を提供し、私たちの計画策定に役立ちました。彼らの調査は使いやすく、確かなデータに基づいており、賢明で自信に満ちた意思決定に役立ちました。彼らを強くお勧めします。
ピユーシュ・ナグパル 上級副社長, ハイビームグローバルInsight Partnersは、深い専門知識に基づき、洞察力に富み、構造化された市場調査を提供しました。チームは終始プロフェッショナルで、対応力も抜群でした。ユーザーフレンドリーなウェブサイトにより、業界レポートへのアクセスもスムーズでした。信頼性の高い高品質な調査サービスをお探しなら、Insight Partnersを強くお勧めします。
安達幸彦 最高経営責任者(CEO), ディープブルーLLC。The Insight Partnersから市場レポートを購入するのは今回が初めてです。最初は不安でしたが、ウェブサイトを見て、リスクを負ってでも購入してみようという気持ちになりました。レポートの品質とカスタマーサービスには大変満足しています。最初のレポートにはいくつか質問やコメントがありましたが、アナリストとメールで何度かやり取りした結果、戦略策定プロセスへのインプットとして活用できるレポートが完成しました。貴重なお時間を割いていただき、貴重な体験をさせていただき、誠にありがとうございました。他の方にもぜひお勧めしたいですし、今後さらに市場データが必要になった際には、まずThe Insight Partnersにご連絡させていただきます。
ジョン・スズキ 社長兼最高経営責任者、取締役, BKテクノロジーズナイジェリアの感染症IVD市場に関する情報提供依頼に対し、ご対応いただいた際、ご尽力とプロフェッショナルな姿勢に深く感謝申し上げます。忍耐強く、的確なアドバイスをいただき、また、最終的に取引成立に至った割引のご提供にも深く感謝申し上げます。今回の最初の出会いで得た強い印象のおかげで、今後もThe Insight Partnersとの連携を心待ちにしております。
チジオケ博士 オニア マネージングディレクター, パインクレストヘルスケア株式会社購入理由
- 情報に基づいた意思決定
- 市場動向の理解
- 競合分析
- 顧客インサイト
- 市場予測
- リスク軽減
- 戦略計画
- 投資の正当性
- 新興市場の特定
- マーケティング戦略の強化
- 業務効率の向上
- 規制動向への対応


 無料サンプルを入手 - ソフトウェア定義データセンター市場