40피트 컨테이너 섀시 시장 개요, 성장, 동향, 분석, 연구 보고서(2021-2031)
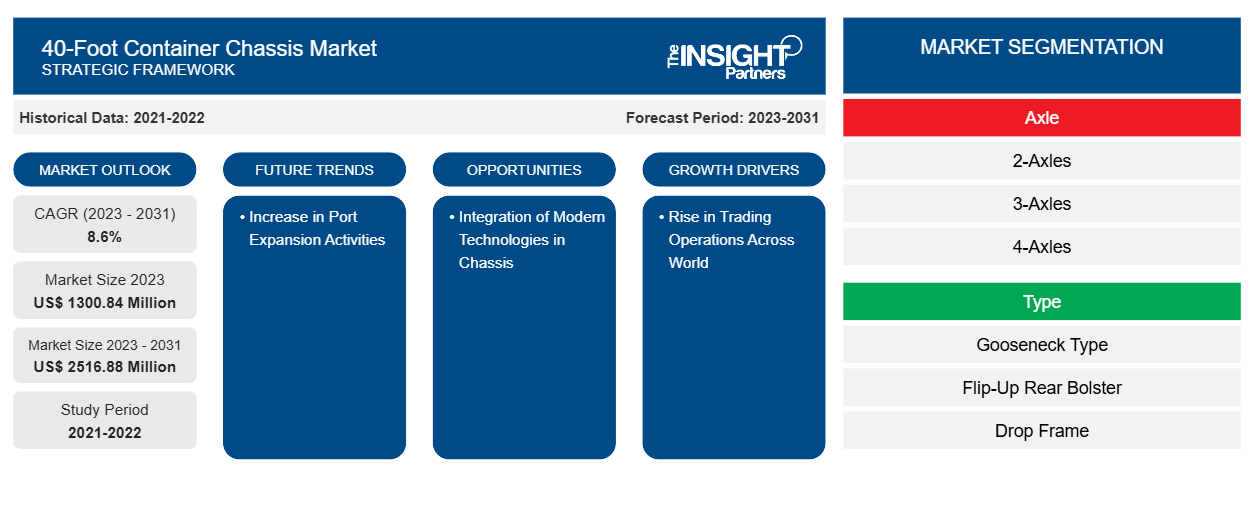
이전 데이터 : 2021-2022 | 기준 연도 : 2023 | 예측 기간 : 2023-203140피트 컨테이너 섀시 시장 규모 및 예측(2021-2031), 글로벌 및 지역별 점유율, 추세 및 성장 기회 분석 보고서 범위: 차축(2축, 3축, 4축), 유형(구즈넥 유형, 플립업 리어 볼스터, 드롭 프레임) 및 지역별
- 상태 : 데이터 공개
- 보고서 코드 : TIPRE00029888
- 범주 : 자동차 및 운송
- 페이지 수 : 150
- 사용 가능한 보고서 형식 :


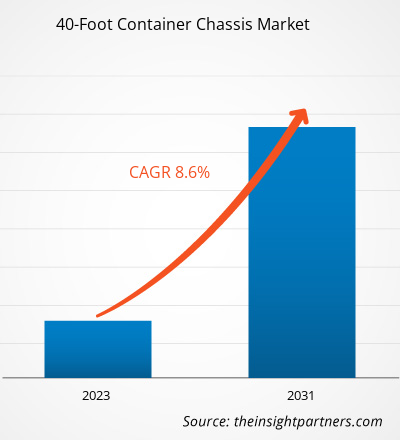
40피트 컨테이너 섀시 시장 규모는 2023년 13억 840만 달러에서 2031년까지 25억 1,688만 달러로 성장할 것으로 예상됩니다. 이 시장은 2023~2031년에 8.6%의 CAGR을 기록할 것으로 예상됩니다. 40피트 컨테이너에 대한 수요는 전 세계적으로 무역 활동이 증가함에 따라 증가하고 있습니다. 이러한 컨테이너는 많은 양의 화물을 보관할 수 있는 능력으로 인해 대량 상품의 국내 및 국제 운송에 사용됩니다. 40피트 컨테이너 채택이 증가하고 있음을 감안할 때 제조업체는 제조 운영을 확대하고 있으며, 이로 인해 이러한 컨테이너에 대한 섀시 수요가 증가하고 있습니다. 또한 매출과 고객 기반을 확대하기 위해 추가 기능이 있는 신제품을 출시하고 있습니다.
40피트 컨테이너 섀시 시장 분석
연방 자동차 운송 안전 관리국(FMCSA), 컨테이너 안전 인증(CSC), 국제 표준화 기구(ISO)와 같은 규제 기관 및 규정은 컨테이너 섀시의 제조 및 판매에 큰 영향을 미칩니다. 2021년 2월, 연방 자동차 운송 안전 관리국(FMCSA)은 고속도로에서 사용되는 인터모달 장비의 안전에 대한 책임을 공유하도록 인터모달 장비 공급업체(IEP), 자동차 운송업체 및 운전자에게 요구하는 인터모달 섀시 규칙을 시행했습니다. 또한 도로, 철도, 항구 및 항공 운송의 품질을 향상시키기 위한 고속도로 및 도로 인프라에 대한 정부 투자는 향후 몇 년 동안 컨테이너 섀시에 대한 수요를 유발할 것으로 예상됩니다. 개선된 운송 인프라는 상업 및 산업 부문의 물류 운영을 촉진하여 상품과 서비스의 안전하고 시기적절한 배송에 도움이 될 것입니다. 2023년 3월, 뉴펀들랜드 래브라도 주 정부는 향후 5년 동안 도로 및 고속도로 운송 인프라를 개선하기 위해 약 14억 달러를 투자한다고 발표했습니다. 2023년 3월, 영국 정부는 향후 2년 동안 전국적으로 혁신적 운송 계획에 약 435억 달러(400억 파운드)를 투자할 계획이라고 발표했습니다. 40피트 컨테이너 섀시는 다양한 상업 및 산업 운송에 사용됩니다. 따라서 도로 및 고속도로 인프라를 개선하여 경제의 상업 및 산업 부문을 활성화하기 위한 정부 투자는 예측 기간 동안 40피트 컨테이너 섀시 시장에 유망한 성장 기회를 제공할 것으로 예상됩니다.
40피트 컨테이너 섀시 시장 개요
40피트 컨테이너 섀시 시장은 일반적으로 인터모달 장비 공급업체(IEP), 해운 회사, 자동차 운송업체에서 사용하는데, 여기에는 트럭으로 컨테이너를 지역 및 국지적으로 이동하는 것이 포함됩니다. 섀시는 컨테이너를 적재 구역에서 야드로, 그리고 터미널의 야드 보관 구역으로 옮기는 데 사용됩니다. 섀시 시스템은 튼튼하고 견고하며 운송 중 날카롭고 갑작스러운 움직임의 충격으로부터 컨테이너를 보호하여 효율적이고 안전한 운송을 보장합니다.
귀하의 요구 사항에 맞게 이 보고서를 사용자 정의하세요
이 보고서의 일부 또는 국가 수준 분석, Excel 데이터 팩을 포함하여 모든 보고서에 대한 사용자 정의를 무료로 받을 수 있으며 신생 기업 및 대학을 위한 훌륭한 혜택과 할인 혜택을 이용할 수 있습니다.
40피트 컨테이너 섀시 시장: 전략적 통찰력
-
이 보고서의 주요 시장 동향을 알아보세요.이 무료 샘플에는 시장 동향부터 추정 및 예측까지 다양한 데이터 분석이 포함됩니다.
40피트 컨테이너 섀시 시장 동인 및 기회
전 세계 무역 운영 증가
세계무역기구(WTO)에 따르면, 2022년 세계 무역은 1995년 이후 양적으로 연평균 4%, 가치적으로 6% 증가했습니다. 세계화는 세계 무역 성장의 주요 원인 중 하나였습니다. 이로 인해 운송 상품에 대한 수요가 급증하면서 40피트 컨테이너를 운송할 컨테이너 섀시에 대한 필요성이 커지고 있습니다. 또한 이러한 섀시의 사용은 해상 및 육로로 상품을 운송하는 데 국한되지 않습니다. 선박, 기차, 트럭과 같은 다양한 운송 모드를 통한 컨테이너의 인터모달 운송에도 사용됩니다. 따라서 전 세계적으로 지속적으로 성장하는 무역 활동은 40피트 컨테이너 섀시 시장의 성장을 뒷받침합니다.
섀시에 현대 기술 통합
섀시 시스템에 IoT를 통합하면 섀시와 공급망의 다른 구성 요소 간의 강력한 연결이 용이해져 휴대전화나 컴퓨터에서 화물의 가시성과 실시간 추적이 향상됩니다. IoT는 이러한 섀시에 외삽되어 효율성을 높일 가능성이 높습니다. 게다가 텔레매틱스 와 같은 첨단 기술은 인터모달 섀시와 통합될 때 다양한 이점이 있는 것으로 인식됩니다. 텔레매틱스는 섀시 출발 및 도착에 대한 정보를 제공하여 직원을 최신 상태로 유지할 수 있으며, 이를 통해 청구 분쟁을 해결하고 도난 발생을 방지할 수 있습니다. 또한 공급망과 화물 네트워크를 보다 효과적으로 관리하는 데 도움이 됩니다.
40피트 컨테이너 섀시 시장 보고서 세분화 분석
40피트 컨테이너 섀시 시장 분석에 기여한 주요 세그먼트는 유형과 차축입니다.
- 유형별로 시장은 2축, 3축, 4축으로 나뉩니다. 2축 세그먼트는 2023년에 더 큰 시장 점유율을 차지했습니다.
- 유형에 따라 글로벌 40피트 컨테이너 섀시 시장은 구스넥 아래, 플립업 리어 볼스터, 스트레이트 프레임, 드롭 프레임으로 구분됩니다. 구스넥 세그먼트는 2023년에 더 큰 시장 점유율을 차지했습니다.
지역별 40피트 컨테이너 섀시 시장 점유율 분석
지리적으로 북미 40피트 컨테이너 섀시 시장은 미국, 캐나다, 멕시코로 세분화됩니다. 이 지역은 증가하는 고객 수요를 충족하기 위해 사업 역량을 도입하고 확장하는 데 있어 선구자입니다. 세계화로 인해 국경을 넘나드는 상품과 서비스에 대한 수요가 증가하고 있습니다. 이 지역의 수입 및 수출 활동이 증가하고 있습니다. 예를 들어, 경제 분석국에 따르면 미국과 중국 간의 수입 및 수출 활동은 2021년에 비해 2022년에 증가했습니다. 따라서 이러한 상품 거래 증가에는 항구와 창고에서 상품을 운송하기 위한 대형 컨테이너와 섀시가 필요합니다. 이러한 수요에 부응하기 위해 시장 참여자들은 40피트 컨테이너 섀시 판매를 늘리기 위한 전략적 이니셔티브를 취하고 있습니다. 예를 들어, 2022년 6월 GIC, OMERS Infrastructure, Wren House는 미국 섀시 리스 회사인 Direct Chassis Link Inc.(DCLI)를 공동으로 인수했습니다. 이 인수를 통해 DCLI 역량이 강화되어 더 많은 고객에게 도달하고 GIC, OMERS Infrastructure, Wren House의 지속적인 지원을 활용할 수 있습니다. 또한, 시장 참여자들은 미국에서 섀시 부족 문제로 인해 증가하는 섀시 수요에 부응하기 위해 새로운 섀시 제조 시설을 건설하고 있습니다. 예를 들어, 2020년 10월, 캘리포니아에 본사를 둔 CIE Manufacturing(CIEM)은 버지니아에 새로운 섀시 제조 공장을 열고 첫 번째 컨테이너 섀시를 출시했습니다. 이 제조 공장을 건설한 목적은 40피트 및 40/45피트 인터모달 컨테이너를 운송할 수 있는 섀시를 제조하는 것이었습니다. 또한, CIEM은 2020년에 캘리포니아 제조 공장을 확장했습니다. 2022년 3월, TRAC Intermodal은 American Made Chassis(AMC)와 협력하여 새로운 해양 40피트 컨테이너 섀시를 제조하고 공급했습니다. 40피트 컨테이너 섀시를 제조하기 위한 시장 참여자 간의 전략적 파트너십은 시장 참여자의 설계, 제조 및 유통 역량에 대한 협업을 확대하여 북미에서 40피트 컨테이너 섀시 시장 성장을 촉진하는 데 도움이 되었습니다.
40피트 컨테이너 섀시 시장 지역 통찰력
Insight Partners의 분석가들은 예측 기간 동안 40피트 컨테이너 섀시 시장에 영향을 미치는 지역적 추세와 요인을 철저히 설명했습니다. 이 섹션에서는 북미, 유럽, 아시아 태평양, 중동 및 아프리카, 남미 및 중미의 40피트 컨테이너 섀시 시장 세그먼트와 지리적 분포도 논의합니다.
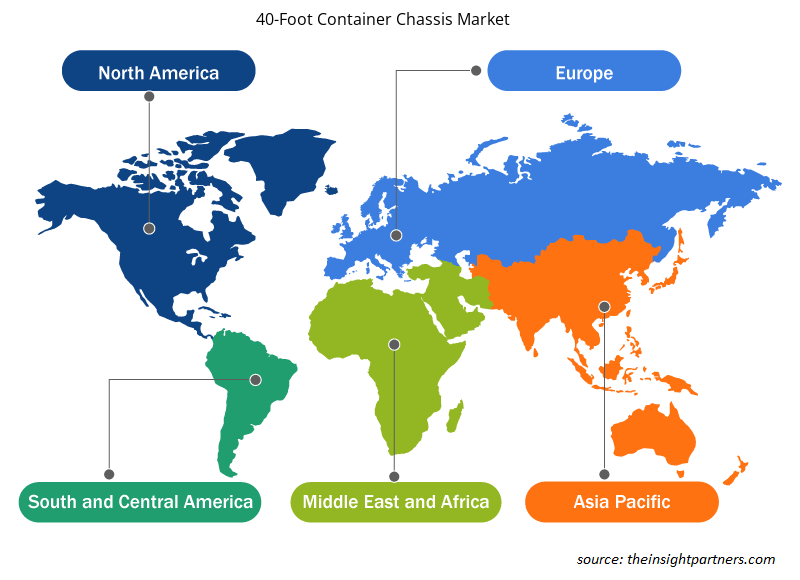
- 40피트 컨테이너 섀시 시장에 대한 지역별 데이터 얻기
40피트 컨테이너 섀시 시장 보고서 범위
| 보고서 속성 | 세부 |
|---|---|
| 2023년 시장 규모 | 13억 8400만 달러 |
| 2031년까지 시장 규모 | 25억 1,688만 달러 |
| 글로벌 CAGR (2023-2031) | 8.6% |
| 역사적 데이터 | 2021-2022 |
| 예측 기간 | 2023-2031 |
| 다루는 세그먼트 |
축으로
|
| 포함된 지역 및 국가 |
북아메리카
|
| 시장 선도 기업 및 주요 회사 프로필 |
|
시장 참여자 밀도: 비즈니스 역학에 미치는 영향 이해
40피트 컨테이너 섀시 시장은 소비자 선호도의 변화, 기술 발전, 제품의 이점에 대한 인식 증가와 같은 요인으로 인해 최종 사용자 수요가 증가함에 따라 빠르게 성장하고 있습니다. 수요가 증가함에 따라 기업은 제품을 확장하고, 소비자의 요구를 충족하기 위해 혁신하고, 새로운 트렌드를 활용하여 시장 성장을 더욱 촉진하고 있습니다.
시장 참여자 밀도는 특정 시장이나 산업 내에서 운영되는 회사나 기업의 분포를 말합니다. 주어진 시장 공간에 얼마나 많은 경쟁자(시장 참여자)가 존재하는지 그 규모나 총 시장 가치에 비해 나타냅니다.
40피트 컨테이너 섀시 시장에서 운영되는 주요 회사는 다음과 같습니다.
- 섀시 킹 주식회사
- 플라이글 훼르체이그바우 GmbH
- 치타 섀시 코퍼레이션
- 트리톤 인터내셔널 유한회사
- Karl Kassbohrer Fahrzeugwerke GmbH
- CIE 제조
면책 조항 : 위에 나열된 회사는 어떤 특별한 순서에 따라 순위가 매겨지지 않았습니다.
- 40피트 컨테이너 섀시 시장의 주요 업체 개요를 알아보세요
40피트 컨테이너 섀시 시장 뉴스 및 최근 개발
40피트 컨테이너 섀시 시장은 1차 및 2차 조사 이후의 정성적, 정량적 데이터를 수집하여 평가합니다. 여기에는 중요한 기업 간행물, 협회 데이터 및 데이터베이스가 포함됩니다. 다음은 혁신, 사업 확장 및 전략에 대한 시장의 개발 목록입니다.
- 2022년 4월, Triton은 TAL Chassis를 자사 주요 브랜드의 산하에 포함시켰습니다. 이 회사는 유연하고 저렴한 솔루션과 사려 깊고 혁신적인 임대 구조를 찾는 고객에게 섀시 기간 임대와 직접 판매에 계속 집중했습니다. (출처: Triton, 보도자료)
- 2022년 4월, Kässbohrer와 CM Logistik Gruppe는 40대의 중간-후방 확장형 다기능 컨테이너 섀시 K.SHG AMH 차량으로 새로운 파트너십을 구축했습니다. (출처: Kässbohrer, 보도자료)
40피트 컨테이너 섀시 시장 보고서 범위 및 제공물
"40피트 컨테이너 섀시 시장 규모 및 예측(2021-2031)" 보고서는 다음 영역을 포괄하는 시장에 대한 자세한 분석을 제공합니다.
- 범위에 포함된 모든 주요 시장 부문에 대한 글로벌, 지역 및 국가 수준의 40피트 컨테이너 섀시 시장 규모와 예측입니다.
- 동인, 제약 및 주요 기회와 같은 시장 역학
- 40피트 컨테이너 섀시 시장 동향
- 자세한 PEST/포터의 5가지 힘과 SWOT 분석
- 주요 시장 동향, 글로벌 및 지역 프레임워크, 주요 업체, 규정 및 최근 시장 개발 사항을 다루는 40피트 컨테이너 섀시 시장 분석
- 40피트 컨테이너 섀시 산업 현황 및 경쟁 분석으로 시장 집중도, 히트맵 분석, 주요 업체 및 최근 개발 사항을 다룹니다.
- 자세한 회사 프로필

나빈은 맞춤형, 신디케이트 및 컨설팅 프로젝트 전반에 걸쳐 9년 이상의 전문 지식을 보유한 시장 조사 및 컨설팅 전문가입니다. 현재 부사장으로 재직 중이며, 프로젝트 가치 사슬 전반의 이해관계자들을 성공적으로 관리해 왔으며, 100편 이상의 연구 보고서와 30건 이상의 컨설팅 업무를 수행했습니다. 그는 산업 및 정부 프로젝트 전반에 걸쳐 다양한 업무를 수행하며 고객 성공과 데이터 기반 의사 결정에 크게 기여하고 있습니다.
나빈은 카르나타카주 VTU에서 전자통신 공학 학위를, 마니팔 대학교에서 마케팅 및 운영 MBA를 취득했습니다. 그는 9년 동안 IEEE 회원으로 활발하게 활동하며 컨퍼런스, 기술 심포지엄에 참여하고 지역 및 지역 차원에서 자원봉사 활동을 해왔습니다. 현재 직책을 맡기 전에는 IndustryARC에서 준전략 컨설턴트로, 휴렛팩커드(HP Global)에서 산업용 서버 컨설턴트로 근무했습니다.
- 과거 분석(2년), 기준 연도, CAGR을 포함한 예측(7년)
- PEST 및 SWOT 분석
- 시장 규모 가치/거래량 - 글로벌, 지역, 국가
- 산업 및 경쟁 환경
- Excel 데이터세트
사용 후기
Insight Partners의 SCADA 시스템 시장 보고서는 포괄적이며, 현재 동향과 미래 전망에 대한 귀중한 통찰력을 제공합니다. 팀은 매우 전문적이고, 신속하게 대응하며, 처음부터 끝까지 지원해 주었습니다. 저희는 매우 만족하며 Insight Partners의 서비스를 적극 추천합니다.
란 케뎀 파트너, Reali Technologies LTDs아주 구체적인 소프트웨어 시장에 대한 보고서를 요청했는데, 팀에서 며칠 만에 보고서를 작성해 주셨습니다. 정보는 매우 관련성이 높고 잘 정리되어 있었습니다. 그 후 보고서에 몇 가지 수정과 추가 사항을 요청했습니다. 팀원들의 응답도 매우 빨랐고, 일주일도 채 되지 않아 최종 보고서를 받았습니다.
장-에르브 젠 의장, 퓨처 애널리티카The Insight Partners와 함께 중요한 시장 조사 및 예측 작업을 진행했습니다. Insight Partners는 기회와 위험에 대한 명확한 통찰력을 제공하여 계획을 세우는 데 큰 도움이 되었습니다. The Insight Partners의 조사는 사용하기 쉬웠고, 탄탄한 데이터를 기반으로 했습니다. 덕분에 현명하고 자신 있는 결정을 내릴 수 있었습니다. The Insight Partners를 강력 추천합니다.
피유시 나그팔 수석 부사장, 하이빔 글로벌Insight Partners는 탄탄한 분야 전문성을 바탕으로 통찰력 있고 체계적인 시장 조사를 제공했습니다. Insight Partners 팀은 처음부터 끝까지 전문적이고 신속하게 대응했습니다. 사용자 친화적인 웹사이트 덕분에 업계 보고서에 쉽게 접근할 수 있었습니다. 신뢰할 수 있고 고품질의 조사 서비스를 원하신다면 Insight Partners를 강력 추천합니다.
아다치 유키히코 대표이사, 딥블루 주식회사The Insight Partners에서 시장 보고서를 구매한 것은 이번이 처음입니다. 처음에는 확신이 없었지만, 웹사이트를 방문하고 나서 위험을 감수하고 시장 보고서를 구매하는 것이 더 편하다는 것을 알게 되었습니다. 보고서의 품질과 고객 서비스에 매우 만족합니다. 처음 보고서를 보고 몇 가지 질문과 의견이 있었지만, 분석가와 이메일로 몇 차례 대화를 나눈 후, 전략 기획 과정에 참고할 수 있는 보고서를 확보했다고 생각합니다. 시간을 내어 긍정적인 경험을 선사해 주셔서 정말 감사합니다. 다른 사람들에게도 귀사의 서비스를 적극 추천할 것이며, 추가적인 시장 데이터가 필요할 때면 가장 먼저 귀사에 연락하겠습니다.
존 스즈키 사장 겸 최고 경영자, 이사회 이사, BK 테크놀로지스나이지리아 감염성 질환 IVD 시장 관련 정보 요청에 응해 주신 귀사의 지원과 전문성에 감사드립니다. 귀사의 인내심과 지도, 그리고 할인 혜택을 기꺼이 제공해 주셔서 결국 계약을 성사시킬 수 있었습니다. 첫 만남을 통해 귀사가 저에게 심어주신 좋은 인상을 바탕으로 앞으로도 The Insight Partners와 함께할 수 있기를 기대합니다.
치지오케 박사 오니아 전무이사, 파인크레스트 헬스케어 유한회사구매 이유
- 정보에 기반한 의사 결정
- 시장 역학 이해
- 경쟁 분석
- 고객 인사이트
- 시장 예측
- 위험 완화
- 전략 기획
- 투자 타당성 분석
- 신흥 시장 파악
- 마케팅 전략 강화
- 운영 효율성 향상
- 규제 동향에 발맞춰 대응


 무료 샘플 받기 - 40피트 컨테이너 섀시 시장