활성탄 시장 성장, 동향 및 2034년까지의 전망
이전 데이터 : 2021-2024 | 기준 연도 : 2025 | 예측 기간 : 2026-2034활성탄 시장 규모 및 전망(2021~2034), 글로벌 및 지역별 점유율, 트렌드 및 성장 기회 분석 보고서 내용: 유형별(과립/압출형, 분말형, 벌집형, 함침형, 재활성형), 응용 분야별(가스 및 공기, 자동차, 촉매, 화학, 식품 및 음료, 광업, 제약, 수처리 및 기타), 지역별
- 상태 : 데이터 공개
- 보고서 코드 : TIPTE100000777
- 범주 : 화학 및 재료
- 페이지 수 : 150
- 사용 가능한 보고서 형식 :


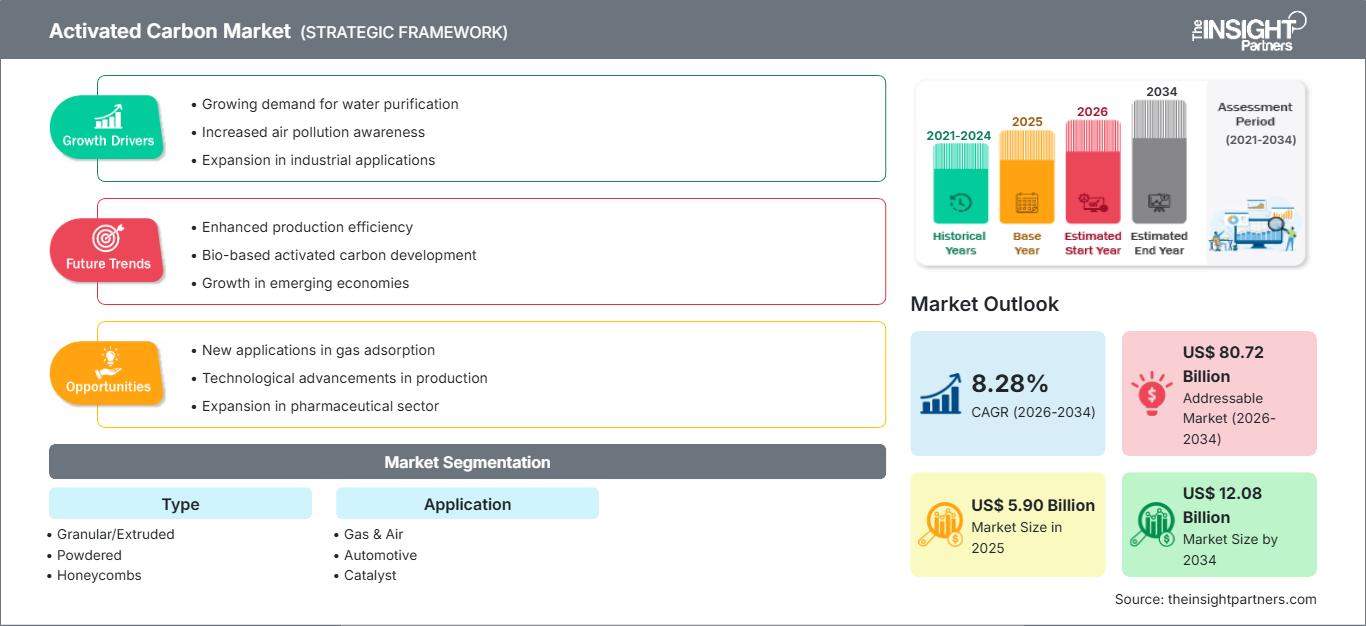
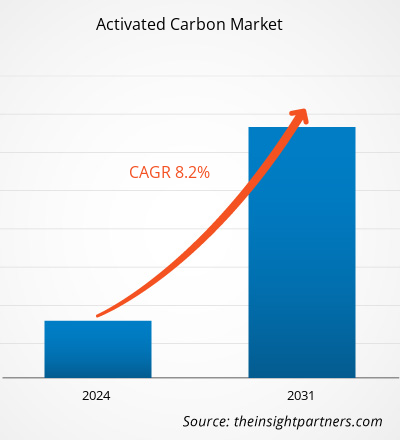
활성탄 시장 규모는 2025년 59억 달러에서 2034년 120억 8천만 달러에 이를 것으로 예상됩니다. 이 시장은 2026년부터 2034년까지 연평균 8.28%의 성장률을 기록할 것으로 전망됩니다.
지속 가능한 개발과 순환 경제에 대한 세계적인 관심 증가에 발맞춰 제조업체들이 생물학적 자원과 농업 폐기물로부터 활성탄을 개발하는 데 점점 더 집중하고 있으며, 이는 활성탄 시장의 주요 트렌드로 자리 잡을 가능성이 높습니다.
활성탄 시장 분석
폐수 처리에 활성탄을 사용하는 사례가 증가하면서 활성탄 수요가 증가하고 있습니다. 지난 20년간 에너지 생산 과정에서 발생하는 폐수를 재활용하는 추세로 인해 폐수 처리 수요가 급증했습니다. 미국, 독일, 태국, 필리핀, 중국, 인도 정부는 법률 및 입법 권한을 통해 폐수 처리 및 순환 경제를 지원하는 프로그램과 정책을 시행하고 있습니다. 미국 환경보호청(EPA)이 2022년에 발표한 보고서에 따르면, 미국에서는 연간 약 1,287억 리터의 폐수가 폐수 처리 시설에서 처리되고 있습니다. 또한 이 보고서는 미국 가정의 20%가 정화조 및 기타 폐수 처리 시스템을 사용하고 있다고 밝혔습니다.
활성탄 시장 개요
활성탄은 공기 및 가스 정화, 폐수 처리, 화학, 식품 및 음료 등 다양한 최종 사용 산업 분야의 특정 용도에 맞게 여러 가지 형태로 제조됩니다. 활성탄의 형태에는 분말, 펠릿, 압출물, 과립, 벌집 구조, 함침형, 재활성화형 등이 있습니다. 과립형 활성탄은 수처리 시설에서 널리 사용되는 반면, 분말형 활성탄은 식품 및 음료 산업에서 정제 및 정제와 같은 다양한 용도로 활용됩니다. 활성탄의 높은 흡착 능력은 금-시안화물 혼합물에서 금을 추출하는 데 적합한 선택지가 되게 합니다. 또한, 수처리는 활성탄의 주요 응용 분야 중 하나입니다. 활성탄은 석유화학 공장, 매립지, 제조 공정 및 화학 처리 시설에서 휘발성 유기 화합물과 같은 유해 오염 물질을 여과하여 산업용 공기를 처리하는 데에도 널리 사용됩니다.
시장 조사 주요 내용
- 활성탄의 세계 시장 규모는 2025년에 59억 달러에 달할 것으로 예상됩니다.
- 연간 시장 규모는 2034년까지 120억 8천만 달러에 달할 것으로 예상됩니다.
- 2026년부터 2034년까지 전체 시장 규모(TAM)는 약 807억 2천만 달러에 이를 것으로 예상됩니다.
- 해당 시장은 예측 기간 동안 연평균 8.28%의 성장률을 기록할 것으로 예상됩니다.
- 미국은 수질 정화 수요 증가, 대기 오염 인식 제고, 산업 분야 적용 확대, 그리고 진화하는 산업 역학에 힘입어 핵심 시장으로 자리매김하고 있습니다.
- 시장 분석은 북미, 유럽, 아시아 태평양, 남미 및 중미, 중동 및 아프리카 지역을 대상으로 하며, 예측 기간 동안의 성장률을 평가합니다.
- 가스 흡착 분야의 새로운 응용, 생산 기술의 발전, 제약 부문의 확장과 같은 시장 기회는 시장 역학 및 시장 규모에 영향을 미칠 것으로 예상됩니다.
- 본 보고서는 Osaka Gas Co Ltd, Haycarb PLC, Kureha Corp, Donau Chemie AG, Activated Carbon Technologies Pty Ltd, Albemarle Corp, CPL Activated Carbons, James Cumming and Sons Pty Ltd, Ingevity Corp, Norit Nederland BV., KURARAY CO LTD, JACOBI CARBONS GROUP, Evoqua Water Technologies LLC, Silcarbon Aktivkohle GmbH, Oxbow Activated Carbon LLC, Prominent Systems, Inc, ADA-ES, INC. 등 업계 참여 기업들의 프로필을 제시하고, 경쟁 전략 및 혁신 동향을 분석합니다.
이 보고서를 귀하의 요구사항에 맞게 맞춤 설정하십시오.
무료 맞춤 제작 서비스를 받으세요활성탄 시장: 전략적 고찰
-
이 보고서에서 주요 시장 동향을 확인하세요.이 무료 샘플에는 시장 동향부터 추정치 및 예측에 이르기까지 다양한 데이터 분석이 포함됩니다.
활성탄 시장 동인 및 기회
수은 배출 규제 강화
수은 배출은 환경과 인체 건강에 유해하며 석탄 화력 발전소에서 발생합니다. 많은 국가에서 이러한 발전소에서 배출되는 유해 물질의 양에 대한 규제를 마련해 왔습니다. 세계 수은 파트너십(Global Mercury Partnership) 덕분에 각국의 규제와 정책이 강화되었습니다. 수은 배출량을 줄이기 위해 하드웨어와 소프트웨어를 포함한 첨단 제어 기술이 적용되고 있습니다. 활성탄은 이러한 기술에서 공기를 정화하는 데 사용되는 가장 중요한 하드웨어 구성 요소 중 하나입니다. 또한, 수은 배출을 효율적으로 제어하기 위해 황과 같은 다른 물질을 첨가한 함침 활성탄도 개발되었습니다. 따라서 공기 정화에 대한 수요 증가가 전 세계 활성탄 수요를 견인하고 있습니다.
기술 발전
전 세계적으로 활성탄의 효율적인 생산 공정을 설계하고 고성능 활성탄을 개발하기 위한 여러 연구가 진행되어 왔습니다. 과학자들은 비용 효율적이고 최적화된 고효율 활성탄 생산 기술 개발에 주력하고 있습니다. 2021년, 중국 창사 소재 중남대학교 연구팀은 중국 국가자연과학기금의 지원을 받아 저급 석탄 및 산화 펠릿과 같은 탄소 기반 원료로부터 활성탄을 한 단계로 제조하는 연구 계획을 제안했습니다.
활성탄 시장 보고서 세분화 분석
활성탄 시장 분석을 도출하는 데 기여한 주요 부문은 유형과 적용 분야입니다.
- 활성탄 시장은 유형별로 과립/압출형, 분말형, 벌집형, 함침형, 재활성형으로 구분됩니다. 2023년에는 분말형 활성탄이 가장 큰 시장 점유율을 차지했습니다.
- 적용 분야별로 시장은 가스 및 공기, 자동차, 촉매, 화학, 식품 및 음료, 광업, 제약, 수처리 및 기타 분야로 세분화됩니다. 2023년에는 수처리 부문이 시장을 주도했습니다.
지역별 활성탄 시장 점유율 분석
활성탄 시장 보고서의 지리적 범위는 주로 북미, 서유럽, 동유럽, 아시아 태평양, 중동 및 아프리카, 남미 및 중앙아메리카의 6개 지역으로 나뉩니다.
아시아 태평양 지역은 활성탄 시장을 주도해 왔습니다. 유럽화학산업협의회(ECIC)에 따르면, 중국의 세계 화학 시장 점유율은 2011년 28.3%에서 2021년 43.0%로 증가했습니다. 다양한 화학 물질에 대한 수요 증가와 그에 따른 생산량 증가는 화학 물질 정제 및 가공용 활성탄 수요를 촉진할 것으로 예상됩니다. 또한, 수처리 시설 및 장비의 설치 증가도 활성탄 시장 성장을 견인하고 있습니다. 북미 지역은 향후 몇 년간 가장 높은 연평균 성장률(CAGR)을 기록할 것으로 전망됩니다.
활성탄 시장 뉴스 및 최근 동향
활성탄 시장은 주요 기업 간행물, 협회 데이터 및 데이터베이스를 포함한 1차 및 2차 연구를 통해 수집된 질적 및 양적 데이터를 기반으로 평가됩니다. 다음은 언어 장애 및 관련 전략 시장의 주요 동향 목록입니다.
- 잉게비티 코퍼레이션(뉴욕증권거래소: NGVT)은 중국 주하이 공장에서 12월 말 완료 및 검증된 주요 병목 현상 해소 및 설비 업그레이드를 통해 활성탄 생산 능력을 확장했습니다. 이번 공장 업그레이드를 통해 생산 능력이 15~20% 추가 증가했으며, 이는 잉게비티가 고품질 고용량 펠릿형 활성탄 제품에 대한 높은 글로벌 수요를 충족하는 데 도움이 될 것입니다. (출처: 잉게비티/보도자료/2021)
- 칼곤 카본 코퍼레이션(Calgon Carbon Corporation)은 오늘 미시시피주 펄링턴 공장에 두 번째 신규 활성탄 생산 라인을 추가하여 생산 능력을 확장할 계획이라고 발표했습니다. 이번 확장이 완료되면 공장에 38개의 일자리가 추가될 것으로 예상됩니다. 추가 생산 라인에 대한 예상 투자액은 1억 8,500만 달러입니다. 확장이 완료되면 칼곤 카본의 신규 과립형 활성탄 생산 능력은 연간 2억 파운드를 초과하게 됩니다. (출처: 칼곤 카본 코퍼레이션/보도자료/2020)
활성탄 시장 보고서 범위
| 보고서 속성 | 세부 |
|---|---|
| 2025년 시장 규모 | 59억 달러 |
| 2034년 시장 규모 | 120억 8천만 달러 |
| 글로벌 연평균 성장률(2026년~2034년) | 8.28% |
| 역사적 데이터 | 2021-2024 |
| 예측 기간 | 2026-2034 |
| 포함되는 부문 |
유형별로
|
| 대상 지역 및 국가 |
북아메리카
|
| 시장 선도 기업 및 주요 기업 프로필 |
|
활성탄 시장 참여자 밀도: 비즈니스 역학에 미치는 영향 이해
활성탄 시장은 소비자 선호도 변화, 기술 발전, 제품 효능에 대한 인식 제고 등 여러 요인으로 최종 사용자 수요가 증가하면서 빠르게 성장하고 있습니다. 수요가 증가함에 따라 기업들은 제품군을 확장하고, 소비자 요구를 충족하기 위한 혁신을 추진하며, 새로운 트렌드를 활용하여 시장 성장을 더욱 촉진하고 있습니다.
활성탄 시장 보고서 범위 및 제공 내용
“활성탄 시장 규모 및 전망(2021~2031)” 보고서는 다음과 같은 분야를 포함하여 시장에 대한 자세한 분석을 제공합니다.
- 본 보고서의 범위에 포함된 모든 주요 시장 부문에 대한 글로벌, 지역 및 국가 수준의 시장 규모 및 전망
- 시장 동향(주요 동인, 제약 요인 및 핵심 기회)
- 주요 미래 트렌드
- 상세한 포터의 5가지 경쟁요인 및 SWOT 분석
- 글로벌 및 지역 시장 분석에는 주요 시장 동향, 주요 업체, 규제 및 최근 시장 개발 상황이 포함됩니다.
- 시장 집중도, 히트맵 분석, 주요 업체 및 최근 동향을 포함하는 산업 환경 및 경쟁 분석
- 상세 기업 프로필

- 과거 분석(2년), 기준 연도, CAGR을 포함한 예측(7년)
- PEST 및 SWOT 분석
- 시장 규모 가치/거래량 - 글로벌, 지역, 국가
- 산업 및 경쟁 환경
- Excel 데이터세트
사용 후기
Insight Partners의 SCADA 시스템 시장 보고서는 포괄적이며, 현재 동향과 미래 전망에 대한 귀중한 통찰력을 제공합니다. 팀은 매우 전문적이고, 신속하게 대응하며, 처음부터 끝까지 지원해 주었습니다. 저희는 매우 만족하며 Insight Partners의 서비스를 적극 추천합니다.
란 케뎀 파트너, Reali Technologies LTDs아주 구체적인 소프트웨어 시장에 대한 보고서를 요청했는데, 팀에서 며칠 만에 보고서를 작성해 주셨습니다. 정보는 매우 관련성이 높고 잘 정리되어 있었습니다. 그 후 보고서에 몇 가지 수정과 추가 사항을 요청했습니다. 팀원들의 응답도 매우 빨랐고, 일주일도 채 되지 않아 최종 보고서를 받았습니다.
장-에르브 젠 의장, 퓨처 애널리티카The Insight Partners와 함께 중요한 시장 조사 및 예측 작업을 진행했습니다. Insight Partners는 기회와 위험에 대한 명확한 통찰력을 제공하여 계획을 세우는 데 큰 도움이 되었습니다. The Insight Partners의 조사는 사용하기 쉬웠고, 탄탄한 데이터를 기반으로 했습니다. 덕분에 현명하고 자신 있는 결정을 내릴 수 있었습니다. The Insight Partners를 강력 추천합니다.
피유시 나그팔 수석 부사장, 하이빔 글로벌Insight Partners는 탄탄한 분야 전문성을 바탕으로 통찰력 있고 체계적인 시장 조사를 제공했습니다. Insight Partners 팀은 처음부터 끝까지 전문적이고 신속하게 대응했습니다. 사용자 친화적인 웹사이트 덕분에 업계 보고서에 쉽게 접근할 수 있었습니다. 신뢰할 수 있고 고품질의 조사 서비스를 원하신다면 Insight Partners를 강력 추천합니다.
아다치 유키히코 대표이사, 딥블루 주식회사The Insight Partners에서 시장 보고서를 구매한 것은 이번이 처음입니다. 처음에는 확신이 없었지만, 웹사이트를 방문하고 나서 위험을 감수하고 시장 보고서를 구매하는 것이 더 편하다는 것을 알게 되었습니다. 보고서의 품질과 고객 서비스에 매우 만족합니다. 처음 보고서를 보고 몇 가지 질문과 의견이 있었지만, 분석가와 이메일로 몇 차례 대화를 나눈 후, 전략 기획 과정에 참고할 수 있는 보고서를 확보했다고 생각합니다. 시간을 내어 긍정적인 경험을 선사해 주셔서 정말 감사합니다. 다른 사람들에게도 귀사의 서비스를 적극 추천할 것이며, 추가적인 시장 데이터가 필요할 때면 가장 먼저 귀사에 연락하겠습니다.
존 스즈키 사장 겸 최고 경영자, 이사회 이사, BK 테크놀로지스나이지리아 감염성 질환 IVD 시장 관련 정보 요청에 응해 주신 귀사의 지원과 전문성에 감사드립니다. 귀사의 인내심과 지도, 그리고 할인 혜택을 기꺼이 제공해 주셔서 결국 계약을 성사시킬 수 있었습니다. 첫 만남을 통해 귀사가 저에게 심어주신 좋은 인상을 바탕으로 앞으로도 The Insight Partners와 함께할 수 있기를 기대합니다.
치지오케 박사 오니아 전무이사, 파인크레스트 헬스케어 유한회사구매 이유
- 정보에 기반한 의사 결정
- 시장 역학 이해
- 경쟁 분석
- 고객 인사이트
- 시장 예측
- 위험 완화
- 전략 기획
- 투자 타당성 분석
- 신흥 시장 파악
- 마케팅 전략 강화
- 운영 효율성 향상
- 규제 동향에 발맞춰 대응


 무료 샘플 받기 - 활성탄 시장