
전자 요금 징수 시장 분석 및 예측(크기, 점유율, 성장, 동향 2030)
전자 통행료 징수 시스템 시장 규모 및 전망(2020~2030년), 제공 분야(시스템 및 서비스), 기술(RFID, DSRC, ANPR, GNSS 등), 응용 분야(고속도로 및 도시 지역)별 글로벌 및 지역별 점유율, 추세 및 성장 기회 분석
- 상태 : 게시됨
- 보고서 코드 : TIPRE00002764
- 범주 : 전자 및 반도체
- 페이지 수 : 177
- 사용 가능한 보고서 형식 :


- 최종 업데이트 일자 : September 09, 2024

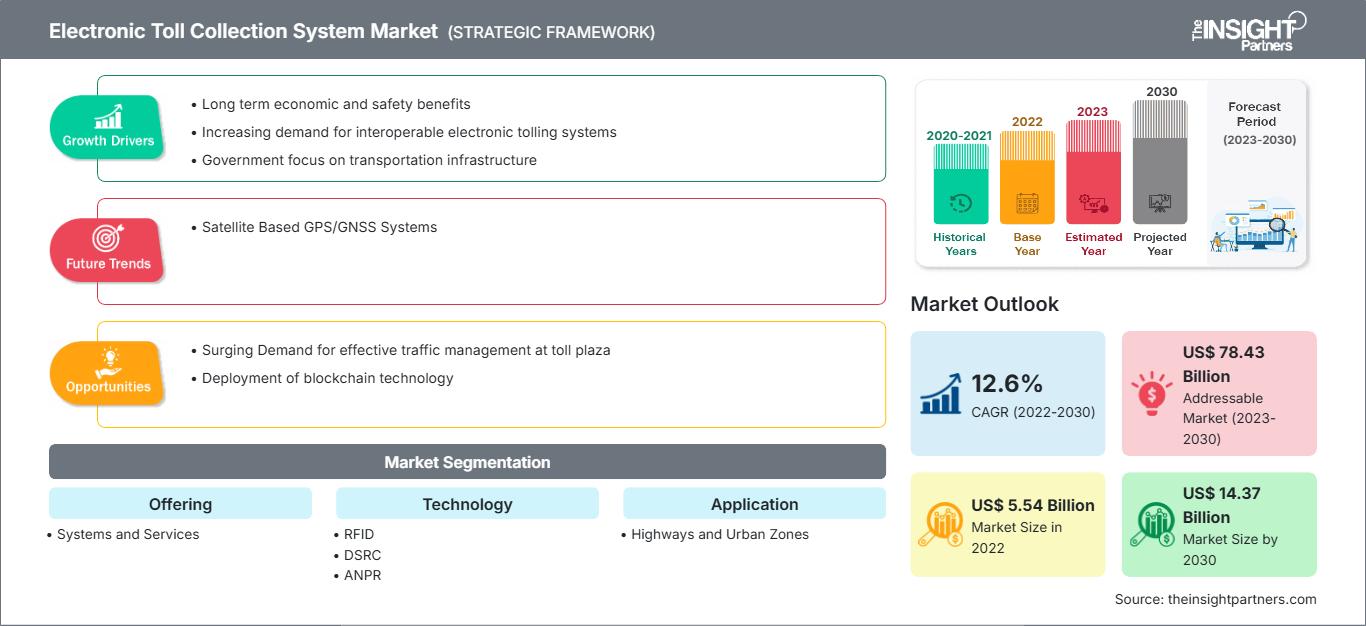
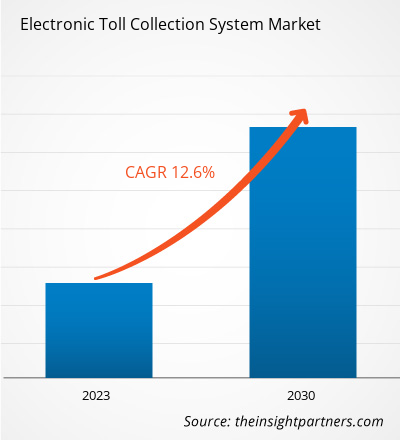
[연구 보고서] 전자 요금 징수 시스템 시장 규모는 2022년 55억 4,191만 달러로 평가되며, 2030년에는 143억 6,980만 달러에 이를 것으로 예상됩니다. 전자 요금 징수 시스템 시장은 2022년부터 2030년까지 연평균 12.6%의 성장률을 기록할 것으로 예상됩니다.
분석가 관점:
시간이 지남에 따라 요금 징수 시스템은 지능화와 효율성 측면에서 향상되었습니다. 스마트 요금 징수 시스템은 도로에 물리적인 시설을 설치할 필요성을 없앨 뿐만 아니라, 데이터를 자원으로 인식하고 이를 활용하여 무현금 요금의 보안성과 효율성을 향상시킵니다. 통행료는 고속도로 건설 및 유지 보수 자금으로 사용될 수 있으므로, 요금 징수는 고속도로 운영에 필수적인 요소입니다. 다양한 감지 및 결제 기술을 활용하여 요금 징수를 효율적이고 시간 절약적으로 만들어 주는 전자 요금 징수 시스템은 점점 더 많은 사례에서 수동 요금 징수를 대체하고 있습니다.
전자 요금 징수 시스템 시장 개요:
도로, 터널 또는 고속도로에서의 요금 징수는 수수료 및 세금 징수, 민관 협력 기반 시설 프로젝트 수익 창출 또는 주 및 정부 기관의 유지 보수 비용 절감에 효율적인 솔루션임이 입증되었습니다. 징수된 요금 징수는 고속도로, 터널, 교량 유지 보수, 향후 프로젝트 확장 자금 조달, 교통 체증 관리 등 다양한 공공 서비스에 활용됩니다. 또한, 최근 교통 인프라 성장에 비해 등록 차량 수가 크게 증가하여 교통 체증이 발생하고 전자 요금 징수(ETC) 시스템에 대한 수요가 증가하고 있습니다. 교통 체증이 크게 증가함에 따라 관문에서의 강력하고 효율적인 요금 징수 방식에 대한 수요가 증가했으며, 이는 자동 요금 징수 시스템의 필요성을 높이고 있습니다. 전자 요금 징수 시스템 시장의 솔루션은 자동화된 요금 징수 프로세스를 원활하게 하는 통합된 단위를 형성하는 하드웨어 장비와 소프트웨어 프로그램 세트로 구성됩니다. ETC 시스템은 시스템 설계에 따라 선불 사용자 계정에서 교통 거래를 효과적으로 식별, 분류하고 징수합니다. 또한, 이 시스템은 요금 위반자 단속, 차량 등록, 백오피스 지원, 혼잡 관리, 지능형 교통 관련 서비스 등을 제공합니다.
ETC 시스템은 원활한 요금 징수 프로세스 외에도 혼잡 관리, 요금소 교통량 최소화, 고속도로 교통량 감소, 교통 패턴에 대한 실행 가능한 통찰력 제공 등 다양한 이점을 제공합니다. 이러한 이점은 선진국에서 ETC 시스템의 인기를 높였고, 신흥국에서는 시스템 수요를 촉진했습니다. 더욱이, 장기적인 경제적 및 안전적 이점은 예측 기간 동안 시장을 주도할 것으로 예상됩니다. 첨단 기술의 통합과 그에 따른 ETC 시스템 서비스 적용 범위의 확대는 향후 시장 성장에 지대한 영향을 미칠 것으로 예상됩니다.
전자 요금 징수 시스템 시장의 솔루션은 교통 흐름을 원활하게 하여 사고 발생 가능성을 줄일 수 있습니다. 이 시스템은 차량 내 장치가 자동으로 요금을 지불하도록 지원하고 운영 효율성을 향상시켜 고객 경험을 향상시키고 새로운 상호 운용성 표준으로의 전환에 있어 유연성을 제공합니다. 급속한 도시화와 스마트 교통 시스템 도입 증가는 예측 기간 동안 전자 요금 징수 시스템 시장에 상당한 성장을 가져올 것입니다.
요구 사항에 맞게 이 보고서를 사용자 정의하십시오.
이 보고서의 일부, 국가 수준 분석, Excel 데이터 팩을 포함하여 모든 보고서에 대한 사용자 정의를 무료로 받을 수 있을 뿐만 아니라 스타트업 및 대학을 위한 훌륭한 제안 및 할인을 이용할 수 있습니다
전자 통행료 징수 시스템 시장: 전략적 통찰력
-
이 보고서의 주요 주요 시장 동향을 확인하세요.이 무료 샘플에는 시장 동향부터 추정 및 예측에 이르기까지 데이터 분석이 포함됩니다.
전자 요금 징수 시스템 시장 성장 동력:
교통 인프라에 대한 정부의 집중이 전자 요금 징수 시스템 시장 성장을 견인
Worldometer에 따르면, 세계 인구는 매년 약 0.88%의 속도로 증가하고 있습니다. 전 세계적인 인구 증가로 인해 정부 기관들은 증가하는 인구를 수용하고 경제 성장을 유지하기 위해 효율적인 인프라 구축에 투자하고 있습니다. 노후화된 인프라 재건에 대한 관심 증가와 스마트 솔루션 도입은 이 지역의 전자 요금 징수 시스템 시장 솔루션 도입을 촉진하는 주요 요인입니다. 예를 들어, 2023년 6월, 유럽 집행위원회는 107개의 교통 인프라 프로젝트를 선정하여 유럽 연결 기금(CEF)으로부터 63억 달러 이상의 EU 보조금을 지원받았습니다. 또한, 독일 정부는 예상되는 화물 운송량 증가에 대응하기 위해 도로 용량을 늘릴 계획입니다. 인포마레(Informare)에 따르면, 2023년 2월 기준 독일의 도로 화물 교통량은 2051년까지 34% 증가할 것으로 예상되며, 독일 연방 정부는 이러한 교통량 증가에 대응하기 위해 신규 도로 건설을 계획하고 있다고 교통부 장관이 밝혔습니다. 2021년 11월, 의회는 초당적 인프라 협정(Bipartisan Infrastructure Deal)을 통과시켰습니다. 이 협정에 따라 정부는 기후 변화 완화, 복원력, 형평성, 그리고 모든 이용자의 안전에 중점을 두고 미국의 도로와 교량을 보수하고 재건하는 데 투자합니다. 또한, 정부는 향후 5년간 미국의 열악한 도로와 고속도로를 개선하기 위해 1,100억 달러를 투자했습니다. 또한, 미국 대통령과 캐나다 총리의 공동 성명에 따르면, 2023년 3월 캐나다 주요 광물 인프라 기금(Canadian Critical Minerals Infrastructure Fund)을 통해 약 10억 9천만 달러(15억 캐나다 달러)가 청정 에너지 및 교통 인프라 프로젝트 지원에 투자될 예정입니다. 2022년 9월 백악관 자료표에 따르면, 미국 대통령과 멕시코 대통령은 공동의 전략적 경제 및 상업적 우선순위를 발전시키기 위해 2021년에 미-멕시코 고위급 경제 대화(HLED)를 재개했습니다. HLED는 미국과 멕시코가 탄탄한 경제적 유대감을 활용하여 멕시코 교통 인프라 구축 투자를 촉진할 수 있는 플랫폼을 제공합니다.
따라서 정부는 교통 인프라에 중점을 두어 도로 건설, 효율적인 디지털 솔루션 도입, 노후 인프라 재건을 촉진했습니다. 이는 수입 누출 위험을 낮추고, 운영 비용을 절감하고, 교통 체증을 완화하여 요금 징수 시스템을 개선하는 데 도움이 되므로 전 세계 전자 요금 징수 시스템 시장에서 솔루션 도입이 증가하는 결과로 이어집니다.
전자 요금 징수 시스템 시장 세분화 분석:
제공되는 서비스를 기준으로 전자 요금 징수 시스템 시장은 시스템과 서비스로 세분화됩니다. 시스템 부문은 전자 요금 징수 시스템 시장에서 가장 큰 점유율을 차지했습니다. 전자 요금 징수 시스템 시장의 솔루션은 고속도로, 교량, 터널, 차량 탑재 차량, 요금소 게이트웨이 등 다양한 인프라에 설치된 하드웨어와 소프트웨어로 구성됩니다. 하드웨어 장비에는 차선 하드웨어와 요금소 하드웨어가 포함됩니다. 차선 하드웨어는 주로 노변 안테나 장치, 고속 전기 차단기, 요금소 차선 제어기, ETC 차선 신호등, 차선 신호등, 요금 징수용 다기능 디스플레이, 차선 감시 카메라, 차량 감지기, 스위치, 컴퓨터 네트워크 등으로 구성됩니다. 요금소 하드웨어는 주로 스위치, 워크스테이션, ETC 요금소 서버로 구성됩니다. ETC 시스템은 일반적으로 트랜스폰더, 안테나 장치, 신호 수신기, 요금소 서버, 광학 센서, 도로 내 센서, 오버헤드 카메라, 노변 통신 장치, 태그 판독기 등의 하드웨어 장비로 구성됩니다. ETC 시스템의 효율적인 작동을 위해서는 요금소 게이트웨이에 설치되는 하드웨어 장비와 차량에 탑재되는 하드웨어 장비, 이 두 가지 측면이 유기적으로 작동해야 합니다. 이 장비는 소프트웨어 및 알고리즘이 관련 데이터와 관련 없는 데이터를 분리하고, 통행료 관련 식별 및 거래를 처리하는 데 필요한 입력 데이터 포인트를 수집합니다. 수집된 데이터를 기반으로 시스템은 필요한 단속 조치를 취하거나 시스템 설계에 따라 관련 기관에 경보를 발령할 수 있습니다. 또한, 솔루션 제공업체는 지역 편의점에서 차량 태그(온보드 태그)를 사용할 수 있도록 보장하고, 신규 사용자 계정을 등록하며, ETC 시스템의 원활한 작동을 위한 관련 백오피스 지원을 제공합니다. 이 소프트웨어는 데이터 수집 및 데이터 통신을 지원합니다. 또한 통행료 징수 시스템의 운영 효율성 향상에도 기여합니다. 전자 통행료 징수 시스템 시장 지역 분석: 북미 전자 통행료 징수 시스템 시장 규모는 2022년 19억 5,636만 달러였으며, 2030년까지 54억 1,754만 달러에 이를 것으로 예상됩니다. 2022년부터 2030년까지 연평균 성장률(CAGR) 13.6%를 기록할 것으로 예상됩니다. 북미 전자 요금 징수 시스템 시장은 미국, 캐나다, 멕시코로 구분됩니다. Assemblyman에 따르면, 2019년 2월 기준, 미국 최대의 ETC 기반 시스템인 E-ZPass는 3,500만 대 이상의 신호 트랜스폰더를 사용하여 17개 주에 걸쳐 2,100만 개의 전자 요금 징수 계정을 관리했습니다. 또한, 최고의 요금 징수 프로그램을 목표로 하는 이 시스템은 세계 최대 규모의 상호 운용 가능한 ETC 시스템 네트워크입니다. 제휴 기관은 약 90억 달러의 수익을 창출합니다. 확장성, 신차 등록, 기존 ETC 시스템 유지 관리와 같은 요인이 예측 기간 동안 미국 전자 요금 징수 시장의 주요 성장 동력이 될 것으로 예상됩니다. 또한, 효율적인 교통 체증 관리 및 교통 모니터링을 위해 교통 패턴에 대한 보고 및 실행 가능한 인사이트 수집을 위한 분석 활용은 전자 통행료 징수 시스템 시장 솔루션을 통해 통합될 수 있는 혁신적인 서비스의 가능성을 열어줄 것으로 예상되며, 이는 시장 참여자들에게 수익성 있는 사업 기회를 제공할 수 있습니다. 나아가, 미국 전역에서 스마트 시티 이니셔티브가 널리 도입되는 추세를 확대할 수 있습니다. 예를 들어, 2021년, 오클라호마 턴파이크 당국(Pikepass of Oklahoma Turnpike Authority)은 미국 전자 통행료 징수 시스템 시장에서 최초의 솔루션이 되었습니다. 이 시스템은 정차할 필요 없이 등록된 자동차 소유자의 계좌에서 전자적으로 인출할 수 있으므로 요금소 근처의 교통 체증을 줄일 수 있습니다.
전자 요금 징수 시스템 시장 주요 기업 분석:
Conduent Business Services, LLC., EFKON GmbH, Kapsch TrafficCom AG, Thales, TOSHIBA CORPORATION, TransCore, FAAC SpA, MITSUBISHI HEAVY INDUSTRIES, LTD., SICE 및 P Square Solutions는 전자 요금 징수 시스템 시장에서 활동하는 주요 기업입니다.
전자 통행료 징수 시스템 시장 지역별 통찰력
The Insight Partners의 분석가들은 예측 기간 동안 전자 요금 징수 시스템 시장에 영향을 미치는 지역별 동향과 요인을 면밀히 분석했습니다. 이 섹션에서는 북미, 유럽, 아시아 태평양, 중동 및 아프리카, 그리고 중남미 지역의 전자 요금 징수 시스템 시장 부문 및 지역별 현황도 살펴봅니다.
전자 통행료 징수 시스템 시장 보고서 범위
| 보고서 속성 | 세부 |
|---|---|
| 시장 규모 2022 | US$ 5.54 Billion |
| 시장규모별 2030 | US$ 14.37 Billion |
| 글로벌 CAGR (2022 - 2030) | 12.6% |
| 이전 데이터 | 2020-2021 |
| 예측 기간 | 2023-2030 |
| 다루는 세그먼트 |
By 제공
|
| 포함된 지역 및 국가 |
북미
|
| 시장 선도 기업 및 주요 회사 프로필 |
|
전자 통행료 징수 시스템 시장 참여자 밀도: 비즈니스 역학에 미치는 영향 이해
전자 통행료 징수 시스템 시장은 소비자 선호도 변화, 기술 발전, 그리고 제품 이점에 대한 인식 제고 등의 요인으로 인한 최종 사용자 수요 증가에 힘입어 빠르게 성장하고 있습니다. 수요가 증가함에 따라 기업들은 제품 및 서비스를 확장하고, 소비자 니즈를 충족하기 위한 혁신을 추진하며, 새로운 트렌드를 적극 활용하고 있으며, 이는 시장 성장을 더욱 가속화하고 있습니다.
- 을 얻으세요 전자 통행료 징수 시스템 시장 주요 주요 플레이어 개요
최근 동향:
전자 요금 징수 시스템 시장에서는 기업 인수합병과 같은 비무기적 및 유기적 전략이 활발하게 활용되고 있습니다. 최근 주요 전자 요금 징수 시스템 시장 동향은 다음과 같습니다.
- 2023년 4월, Kapsch는 자동 번호판 인식(ANPR) 소프트웨어 업데이트를 출시했습니다. 이 업데이트는 애플리케이션에 따라 번호판이 아닌 차량의 번호판을 자동으로 인식합니다.
- 2022년 2월, 과테말라 고속도로 운영사 SiVA는 과테말라의 주요 도로인 팔린-에스쿠인틀라 구간에 Thales의 Peage Intelligent Transport Zero(PITZ) 전자 요금 징수 시스템을 구축한다고 발표했습니다.

나빈은 맞춤형, 신디케이트 및 컨설팅 프로젝트 전반에 걸쳐 9년 이상의 전문 지식을 보유한 시장 조사 및 컨설팅 전문가입니다. 현재 부사장으로 재직 중이며, 프로젝트 가치 사슬 전반의 이해관계자들을 성공적으로 관리해 왔으며, 100편 이상의 연구 보고서와 30건 이상의 컨설팅 업무를 수행했습니다. 그는 산업 및 정부 프로젝트 전반에 걸쳐 다양한 업무를 수행하며 고객 성공과 데이터 기반 의사 결정에 크게 기여하고 있습니다.
나빈은 카르나타카주 VTU에서 전자통신 공학 학위를, 마니팔 대학교에서 마케팅 및 운영 MBA를 취득했습니다. 그는 9년 동안 IEEE 회원으로 활발하게 활동하며 컨퍼런스, 기술 심포지엄에 참여하고 지역 및 지역 차원에서 자원봉사 활동을 해왔습니다. 현재 직책을 맡기 전에는 IndustryARC에서 준전략 컨설턴트로, 휴렛팩커드(HP Global)에서 산업용 서버 컨설턴트로 근무했습니다.
- 포괄적인 시장 규모 산정 및 전망 분석
- 상세 시장 세분화 분석
- 심층적인 시장 동향 및 요인 분석
- 지역 및 국가별 인사이트
- 경쟁 구도 및 기업 벤치마킹
- 전략적 비즈니스 인텔리전스
사용 후기
Insight Partners의 SCADA 시스템 시장 보고서는 포괄적이며, 현재 동향과 미래 전망에 대한 귀중한 통찰력을 제공합니다. 팀은 매우 전문적이고, 신속하게 대응하며, 처음부터 끝까지 지원해 주었습니다. 저희는 매우 만족하며 Insight Partners의 서비스를 적극 추천합니다.
란 케뎀 파트너, Reali Technologies LTDs아주 구체적인 소프트웨어 시장에 대한 보고서를 요청했는데, 팀에서 며칠 만에 보고서를 작성해 주셨습니다. 정보는 매우 관련성이 높고 잘 정리되어 있었습니다. 그 후 보고서에 몇 가지 수정과 추가 사항을 요청했습니다. 팀원들의 응답도 매우 빨랐고, 일주일도 채 되지 않아 최종 보고서를 받았습니다.
장-에르브 젠 의장, 퓨처 애널리티카The Insight Partners와 함께 중요한 시장 조사 및 예측 작업을 진행했습니다. Insight Partners는 기회와 위험에 대한 명확한 통찰력을 제공하여 계획을 세우는 데 큰 도움이 되었습니다. The Insight Partners의 조사는 사용하기 쉬웠고, 탄탄한 데이터를 기반으로 했습니다. 덕분에 현명하고 자신 있는 결정을 내릴 수 있었습니다. The Insight Partners를 강력 추천합니다.
피유시 나그팔 수석 부사장, 하이빔 글로벌Insight Partners는 탄탄한 분야 전문성을 바탕으로 통찰력 있고 체계적인 시장 조사를 제공했습니다. Insight Partners 팀은 처음부터 끝까지 전문적이고 신속하게 대응했습니다. 사용자 친화적인 웹사이트 덕분에 업계 보고서에 쉽게 접근할 수 있었습니다. 신뢰할 수 있고 고품질의 조사 서비스를 원하신다면 Insight Partners를 강력 추천합니다.
아다치 유키히코 대표이사, 딥블루 주식회사The Insight Partners에서 시장 보고서를 구매한 것은 이번이 처음입니다. 처음에는 확신이 없었지만, 웹사이트를 방문하고 나서 위험을 감수하고 시장 보고서를 구매하는 것이 더 편하다는 것을 알게 되었습니다. 보고서의 품질과 고객 서비스에 매우 만족합니다. 처음 보고서를 보고 몇 가지 질문과 의견이 있었지만, 분석가와 이메일로 몇 차례 대화를 나눈 후, 전략 기획 과정에 참고할 수 있는 보고서를 확보했다고 생각합니다. 시간을 내어 긍정적인 경험을 선사해 주셔서 정말 감사합니다. 다른 사람들에게도 귀사의 서비스를 적극 추천할 것이며, 추가적인 시장 데이터가 필요할 때면 가장 먼저 귀사에 연락하겠습니다.
존 스즈키 사장 겸 최고 경영자, 이사회 이사, BK 테크놀로지스나이지리아 감염성 질환 IVD 시장 관련 정보 요청에 응해 주신 귀사의 지원과 전문성에 감사드립니다. 귀사의 인내심과 지도, 그리고 할인 혜택을 기꺼이 제공해 주셔서 결국 계약을 성사시킬 수 있었습니다. 첫 만남을 통해 귀사가 저에게 심어주신 좋은 인상을 바탕으로 앞으로도 The Insight Partners와 함께할 수 있기를 기대합니다.
치지오케 박사 오니아 전무이사, 파인크레스트 헬스케어 유한회사구매 이유
- 정보에 기반한 의사 결정
- 시장 역학 이해
- 경쟁 분석
- 고객 인사이트
- 시장 예측
- 위험 완화
- 전략 기획
- 투자 타당성 분석
- 신흥 시장 파악
- 마케팅 전략 강화
- 운영 효율성 향상
- 규제 동향에 발맞춰 대응


