
고함량 스크리닝 시장 성장, 동향 및 2034년까지의 전망
고함량 스크리닝 시장 규모 및 전망(2021년~2034년), 글로벌 및 지역별 점유율, 트렌드 및 성장 기회 분석 보고서 내용: 제품별(기기, 소모품, 소프트웨어, 서비스 및 액세서리), 응용 분야별(표적 식별 및 검증, 1차 및 2차 스크리닝, 독성 연구, 화합물 및 기타), 최종 사용자[제약 및 생명공학 기업, 학술 및 정부 기관, 임상시험수탁기관(CRO)]
- 상태 : 데이터 공개
- 보고서 코드 : TIPRE00004161
- 범주 : 생명과학
- 페이지 수 : 150
- 사용 가능한 보고서 형식 :


- 최종 업데이트 일자 : April 09, 2026

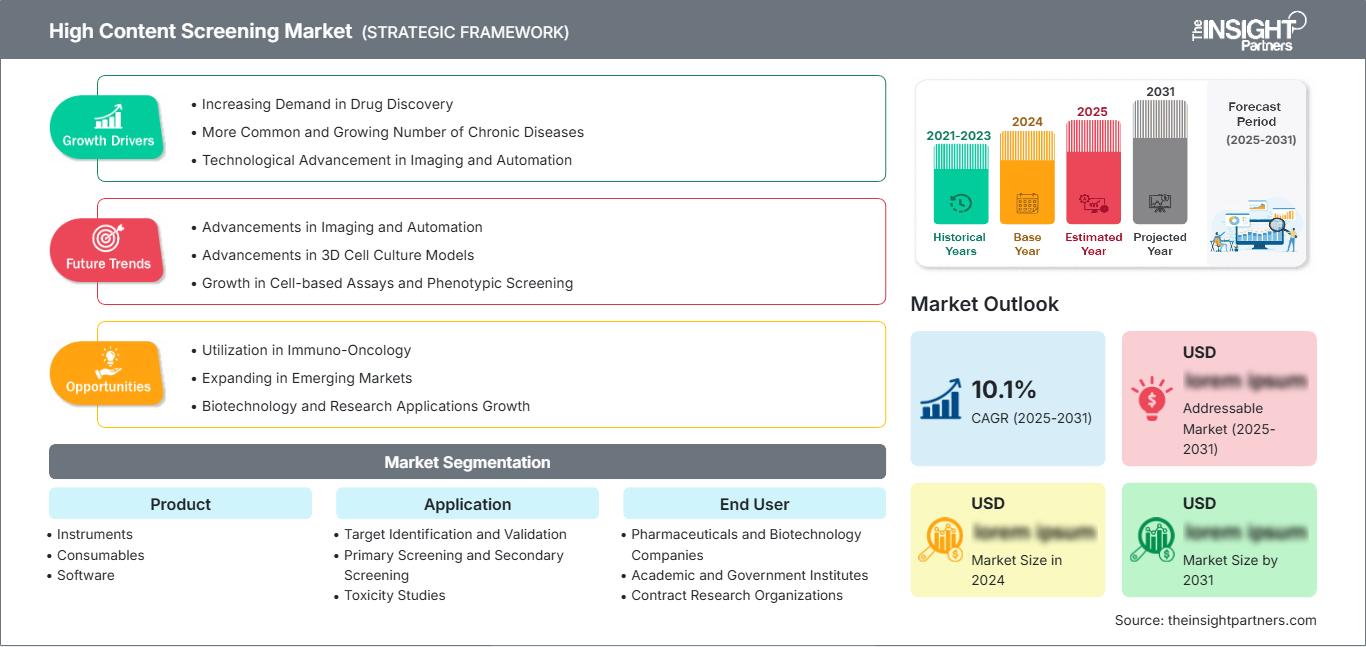
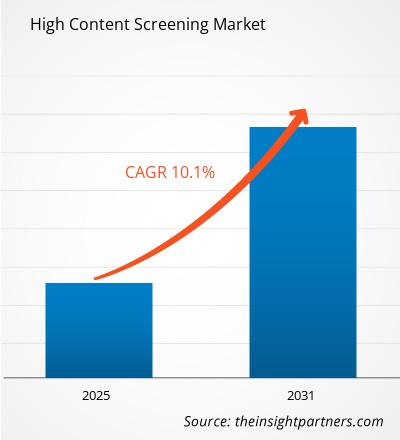
고함량 스크리닝(High Content Screening) 시장 규모는 2025년 7억 6,440만 달러에서 2034년 16억 4,220만 달러에 이를 것으로 예상됩니다. 이 시장은 2026년부터 2034년까지 예측 기간 동안 연평균 8.87%의 성장률을 기록할 것으로 전망됩니다.
고함량 스크리닝 시장은 제품 유형별로 기기, 소모품, 소프트웨어, 서비스 및 액세서리로 분류됩니다. 또한 응용 분야별로는 표적 식별 및 검증, 1차 및 2차 스크리닝, 독성 연구, 화합물 및 기타로 세분화되며, 최종 사용자별로는 제약 및 생명공학 기업, 학술 및 정부 기관, 임상시험수탁기관(CRO)으로 구분됩니다. 2031년까지의 예측은 고함량 스크리닝 시장 성장이 생산성과 고객 만족도에 미치는 영향에 대한 귀중한 통찰력을 제공합니다. 글로벌 분석은 지역별 및 주요 국가별로 세분화되어 있습니다. 위의 세분화된 분석에 대한 시장 평가는 미국 달러(US$)로 제시됩니다.
보고서의 목적
Insight Partners의 고함량 스크리닝 시장 보고서는 현재 시장 상황과 향후 성장 전망, 주요 성장 동력, 과제 및 기회를 분석합니다. 이 보고서는 다음과 같은 다양한 비즈니스 이해관계자에게 유용한 정보를 제공합니다.
- 기술 제공업체/제조업체: 변화하는 시장 역학을 이해하고 잠재적인 성장 기회를 파악하여 정보에 기반한 전략적 결정을 내릴 수 있도록 지원합니다.
- 투자자: 시장 성장률, 시장 재무 전망 및 가치 사슬 전반에 걸쳐 존재하는 기회에 대한 종합적인 추세 분석을 수행합니다.
- 규제 기관: 시장 내 정책을 규제하고 활동을 감독하여 남용을 최소화하고 투자자의 신뢰를 유지하며 시장의 건전성과 안정성을 지키는 것을 목표로 합니다.
고함량 스크리닝 시장 세분화 제품
- 악기
- 소모품
- 소프트웨어
- 서비스
- 부속품
애플리케이션
- 목표 식별 및 검증
- 1차 검진 및 2차 검진
- 독성 연구
- 화합물
최종 사용자
- 제약 및 생명공학 회사
- 학술 및 정부 기관
- 임상시험수탁기관
지리학
- 북아메리카
- 유럽
- 아시아태평양
- 남미와 중앙아메리카
- 중동 및 아프리카
시장 조사 주요 내용
- 고함량 스크리닝의 세계 시장 규모는 2025년에 7억 6,440만 달러에 달할 것으로 예상됩니다.
- 연간 시장 규모는 2034년까지 16억 4,220만 달러에 이를 것으로 예상됩니다.
- 2026년부터 2034년까지 전체 시장 규모(TAM)는 약 107억 7,727만 달러에 이를 것으로 예상됩니다.
- 해당 시장은 예측 기간 동안 연평균 8.87%의 성장률을 기록할 것으로 예상됩니다.
- 미국은 신약 개발 수요 증가, 만성 질환의 발생률 및 증가 추세, 영상 및 자동화 기술의 발전, 그리고 끊임없이 변화하는 산업 동향에 힘입어 핵심 시장으로 자리매김하고 있습니다.
- 시장 분석은 북미, 유럽, 아시아 태평양, 남미 및 중미, 중동 및 아프리카 지역을 대상으로 하며, 예측 기간 동안의 성장률을 평가합니다.
- 면역항암 분야에서의 활용, 신흥 시장 진출 확대, 생명공학 및 연구 응용 분야의 성장과 같은 시장 기회는 시장 역학 및 시장 규모에 영향을 미칠 것으로 예상됩니다.
- 본 보고서는 제너럴 일렉트릭(GE), 다나허(Danaher), 퍼키넬머(Perkinelmer, Inc.), 써모 피셔 사이언티픽(Thermo Fisher Scientific Inc.), BD, 바이오텍 인스트루먼츠(BioTek Instruments, Inc.), 바이오래드 래버러토리스(Bio-Rad Laboratories, Inc.), 테칸 트레이딩(Tecan Trading AG), 머크(Merck KGaA), 요코가와 전기(Yokogawa Electric Corporation) 등 업계 참여 기업들의 프로필을 제시하고, 경쟁 전략 및 혁신 동향을 분석합니다.
이 보고서를 귀하의 요구사항에 맞게 맞춤 설정하십시오.
무료 맞춤 제작 서비스를 받으세요고콘텐츠 스크리닝 시장: 전략적 통찰
-
이 보고서에서 주요 시장 동향을 확인하세요.이 무료 샘플에는 시장 동향부터 추정치 및 예측에 이르기까지 다양한 데이터 분석이 포함됩니다.
고함량 스크리닝 시장 성장 동력
- 신약 개발 분야의 수요 증가: 고함량 스크리닝(HCS)은 제약 연구 개발에 필수적인 기술입니다. 세계화가 심화되는 제약 업계는 신약 후보 물질을 보다 효율적으로 선별하는 방법을 모색하고 있으며, HCS 시스템은 수천 가지 화합물을 스크리닝하고 세포에 미치는 영향을 확인하는 데 점점 더 많이 사용되고 있습니다.
- 만성 질환의 증가 추세: 암, 당뇨병, 신경퇴행성 질환 등 만성 질환의 발생률이 증가함에 따라 신약 개발 및 정밀 의학을 위한 스크리닝 기술의 활용이 더욱 중요해지고 있습니다. 이는 생의학 연구 및 임상 현장에서 고함량 스크리닝의 필요성을 증대시키고 있습니다.
- 이미징 및 자동화 기술의 발전: 자동 현미경, 3D 이미징, AI 기반 이미지 분석을 포함한 이미징 기술에 상당한 발전이 있었습니다. 이러한 기술 발전은 고처리량 스크리닝(HCS) 공정에 큰 변화를 가져와 처리량 증가, 정확도 향상, 세포 반응의 해상도 증대를 가능하게 합니다. 이러한 개선으로 인해 대규모 화합물 라이브러리를 더 높은 속도로 더 정밀하게 스크리닝할 수 있게 되면서, HCS는 모든 종류의 연구 및 임상 분야에서 활용도가 높아지고 있습니다.
고함량 스크리닝 시장의 미래 동향
- 이미징 및 자동화 기술의 발전: 자동화된 이미징, 마이크로플레이트 판독기 및 데이터 분석 분야의 자동화는 고함량 스크리닝 솔루션의 정밀도와 처리량을 향상시켰습니다. 자동화된 HCS 시스템은 활성 화합물 검출에 일관성과 효율성을 제공하여 시장 성장을 견인하고 있습니다.
- 3D 세포 배양 모델의 발전: 최근 HCS(고처리량 스크리닝)에서 3D 세포 배양 시스템을 활용하는 추세가 두드러지고 있습니다. 이러한 시스템은 기존의 2D 배양보다 생리학적으로 더욱 적합한 환경에서 약물 테스트를 가능하게 합니다. 3D 세포 배양은 복잡한 인체 조직을 더 잘 모방하며, 이는 약물 스크리닝 결과에도 반영됩니다. 이러한 수요 증가로 인해 3D 세포 배양 시스템을 지원하는 첨단 HCS 플랫폼에 대한 거대한 시장이 형성되고 있으며, 이는 시장 성장의 주요 동력입니다.
- 세포 기반 분석 및 표현형 스크리닝의 성장: 기존의 생화학적 분석법보다 세포 기반 분석법이 생물학적으로 더 관련성 높은 정보를 제공하기 때문에 선호도가 높아지고 있습니다. 특히 표현형 스크리닝은 분자 표적에 대한 선입견 없이 화합물이 세포 표현형에 미치는 영향을 확인할 수 있다는 장점 때문에 인기를 얻고 있습니다. 이러한 추세는 새로운 약물 후보 물질을 발굴하고 질병 모델을 개선하는 데 있어 고처리량 스크리닝(HCS)의 활용도를 높이고 있습니다.
고함량 스크리닝 시장 기회
- 면역항암 분야에서의 활용: 고함량 스크리닝(HCS)은 새로운 암 면역 치료법을 찾기 위해 면역항암 분야에서 점차 도입되고 있습니다. 이 새로운 연구 분야는 암 치료 효과를 높일 수 있는 면역 조절 약물을 선별하기 위한 HCS 기술의 중요한 플랫폼을 제공할 수 있습니다.
- 신흥 시장으로의 확장: 정밀 의학에 대한 전 세계적인 수요가 증가함에 따라, 신흥 시장은 고함량 스크리닝 기술 확장을 위한 엄청난 성장 기회를 제공합니다. 이러한 지역의 의료 인프라와 연구 시설이 성장함에 따라 기술 도입은 더욱 가속화될 것으로 예상됩니다.
- 생명공학 및 연구 응용 분야의 성장: HCS(고처리량 컴퓨터 단층촬영)는 학술 연구 및 생명공학 분야, 특히 암 연구, 줄기세포 연구, 유전학 연구에서 빠르게 성장하고 있습니다. HCS 시스템은 복잡한 생물학적 현상을 분석하고 고차원 데이터를 제공함으로써 세포 반응, 유전자 발현, 질병 메커니즘을 이해하는 데 도움을 주며, 첨단 연구 및 혁신을 추구하는 연구 기관, 생명공학 기업, 연구 위탁 기관에서 HCS의 활용 가능성을 확대하고 있습니다.
고함량 스크리닝 시장 보고서 범위
| 보고서 속성 | 세부 |
|---|---|
| 2025년 시장 규모 | 미화 7억 6,440만 달러 |
| 2034년 시장 규모 | 미화 16억 4,220만 달러 |
| 글로벌 연평균 성장률(2026년~2034년) | 8.87% |
| 역사적 데이터 | 2021-2024 |
| 예측 기간 | 2026-2034 |
| 포함되는 부문 |
부산물
|
| 대상 지역 및 국가 |
북아메리카
|
| 시장 선도 기업 및 주요 기업 프로필 |
|
고밀도 콘텐츠 스크리닝 시장 참여자 수: 비즈니스 역학에 미치는 영향 이해
고함량 스크리닝 시장은 소비자 선호도 변화, 기술 발전, 제품 이점 인식 제고 등 여러 요인으로 최종 사용자 수요가 증가하면서 빠르게 성장하고 있습니다. 수요가 증가함에 따라 기업들은 제품군을 확장하고, 소비자 요구를 충족하기 위한 혁신을 추진하며, 새로운 트렌드를 활용하여 시장 성장을 더욱 촉진하고 있습니다.
주요 판매 포인트
- 종합적인 분석: 본 보고서는 고함량 스크리닝 시장의 제품, 서비스, 유형 및 최종 사용자에 대한 분석을 종합적으로 다루어 시장에 대한 포괄적인 시각을 제공합니다.
- 전문가 분석: 본 보고서는 업계 전문가 및 분석가들의 심층적인 이해를 바탕으로 작성되었습니다.
- 최신 정보: 본 보고서는 최신 정보와 데이터 동향을 반영하여 비즈니스 관련성을 보장합니다.
- 맞춤 설정 옵션: 이 보고서는 고객의 특정 요구 사항을 충족하고 비즈니스 전략에 적합하도록 맞춤 설정할 수 있습니다.
따라서 고함량 스크리닝 시장에 대한 연구 보고서는 업계 현황과 성장 전망을 분석하고 이해하는 데 도움을 줄 수 있습니다. 몇 가지 타당한 우려 사항이 있을 수 있지만, 이 보고서의 전반적인 이점은 단점보다 훨씬 큽니다.

Mrinal은 생명 과학 시장 정보 분석 및 컨설팅 분야에서 8년 이상의 경력을 보유한 노련한 리서치 분석가입니다. 전략적 사고방식과 탁월함을 향한 확고한 의지를 바탕으로 제약 예측, 시장 기회 평가, 업계 벤치마크 개발 분야에서 심도 있는 전문 지식을 쌓아 왔습니다. 그녀의 업무는 고객이 정보에 기반한 전략적 의사 결정을 내릴 수 있도록 실질적인 통찰력을 제공하는 데 중점을 두고 있습니다.
Mrinal의 핵심 강점은 복잡한 정량적 데이터 세트를 의미 있는 비즈니스 인텔리전스로 변환하는 것입니다. 그녀의 분석적 통찰력은 제약 및 의료기기 분야의 시장 진출(GTM) 전략을 수립하고 성장 기회를 발굴하는 데 중요한 역할을 합니다. 신뢰할 수 있는 컨설턴트로서, 그녀는 고객의 워크플로 프로세스를 간소화하고 모범 사례를 구축하는 데 지속적으로 집중하여 혁신과 운영 효율성을 향상시킵니다.
- 포괄적인 시장 규모 산정 및 전망 분석
- 상세 시장 세분화 분석
- 심층적인 시장 동향 및 요인 분석
- 지역 및 국가별 인사이트
- 경쟁 구도 및 기업 벤치마킹
- 전략적 비즈니스 인텔리전스
사용 후기
Insight Partners의 SCADA 시스템 시장 보고서는 포괄적이며, 현재 동향과 미래 전망에 대한 귀중한 통찰력을 제공합니다. 팀은 매우 전문적이고, 신속하게 대응하며, 처음부터 끝까지 지원해 주었습니다. 저희는 매우 만족하며 Insight Partners의 서비스를 적극 추천합니다.
란 케뎀 파트너, Reali Technologies LTDs아주 구체적인 소프트웨어 시장에 대한 보고서를 요청했는데, 팀에서 며칠 만에 보고서를 작성해 주셨습니다. 정보는 매우 관련성이 높고 잘 정리되어 있었습니다. 그 후 보고서에 몇 가지 수정과 추가 사항을 요청했습니다. 팀원들의 응답도 매우 빨랐고, 일주일도 채 되지 않아 최종 보고서를 받았습니다.
장-에르브 젠 의장, 퓨처 애널리티카The Insight Partners와 함께 중요한 시장 조사 및 예측 작업을 진행했습니다. Insight Partners는 기회와 위험에 대한 명확한 통찰력을 제공하여 계획을 세우는 데 큰 도움이 되었습니다. The Insight Partners의 조사는 사용하기 쉬웠고, 탄탄한 데이터를 기반으로 했습니다. 덕분에 현명하고 자신 있는 결정을 내릴 수 있었습니다. The Insight Partners를 강력 추천합니다.
피유시 나그팔 수석 부사장, 하이빔 글로벌Insight Partners는 탄탄한 분야 전문성을 바탕으로 통찰력 있고 체계적인 시장 조사를 제공했습니다. Insight Partners 팀은 처음부터 끝까지 전문적이고 신속하게 대응했습니다. 사용자 친화적인 웹사이트 덕분에 업계 보고서에 쉽게 접근할 수 있었습니다. 신뢰할 수 있고 고품질의 조사 서비스를 원하신다면 Insight Partners를 강력 추천합니다.
아다치 유키히코 대표이사, 딥블루 주식회사The Insight Partners에서 시장 보고서를 구매한 것은 이번이 처음입니다. 처음에는 확신이 없었지만, 웹사이트를 방문하고 나서 위험을 감수하고 시장 보고서를 구매하는 것이 더 편하다는 것을 알게 되었습니다. 보고서의 품질과 고객 서비스에 매우 만족합니다. 처음 보고서를 보고 몇 가지 질문과 의견이 있었지만, 분석가와 이메일로 몇 차례 대화를 나눈 후, 전략 기획 과정에 참고할 수 있는 보고서를 확보했다고 생각합니다. 시간을 내어 긍정적인 경험을 선사해 주셔서 정말 감사합니다. 다른 사람들에게도 귀사의 서비스를 적극 추천할 것이며, 추가적인 시장 데이터가 필요할 때면 가장 먼저 귀사에 연락하겠습니다.
존 스즈키 사장 겸 최고 경영자, 이사회 이사, BK 테크놀로지스나이지리아 감염성 질환 IVD 시장 관련 정보 요청에 응해 주신 귀사의 지원과 전문성에 감사드립니다. 귀사의 인내심과 지도, 그리고 할인 혜택을 기꺼이 제공해 주셔서 결국 계약을 성사시킬 수 있었습니다. 첫 만남을 통해 귀사가 저에게 심어주신 좋은 인상을 바탕으로 앞으로도 The Insight Partners와 함께할 수 있기를 기대합니다.
치지오케 박사 오니아 전무이사, 파인크레스트 헬스케어 유한회사구매 이유
- 정보에 기반한 의사 결정
- 시장 역학 이해
- 경쟁 분석
- 고객 인사이트
- 시장 예측
- 위험 완화
- 전략 기획
- 투자 타당성 분석
- 신흥 시장 파악
- 마케팅 전략 강화
- 운영 효율성 향상
- 규제 동향에 발맞춰 대응


