
견고한 서버 시장 동향, 수요 및 성장 전망 (2034년까지)
견고한 서버 시장 규모 및 전망(2021~2034), 글로벌 및 지역별 점유율, 트렌드 및 성장 기회 분석 보고서 범위: 유형별(견고한 랙마운트 서버, 견고한 블레이드 서버, 견고한 엣지 서버 및 기타), 메모리 용량별(256GB 미만, 256GB~512GB, 512GB~1TB, 1TB 초과), 애플리케이션별(표준 및 전용), 최종 사용자별(국방 및 군사, 석유 및 가스, 에너지 및 유틸리티, 통신, 항공우주 및 항공, 운송 및 물류 및 기타), 지역별(북미, 유럽, 아시아 태평양, 중동 및 아프리카, 남미 및 중앙아메리카)
- 상태 : 게시됨
- 보고서 코드 : TIPRE00011143
- 범주 : 전자 및 반도체
- 페이지 수 : 310
- 사용 가능한 보고서 형식 :


- 최종 업데이트 일자 : April 30, 2026

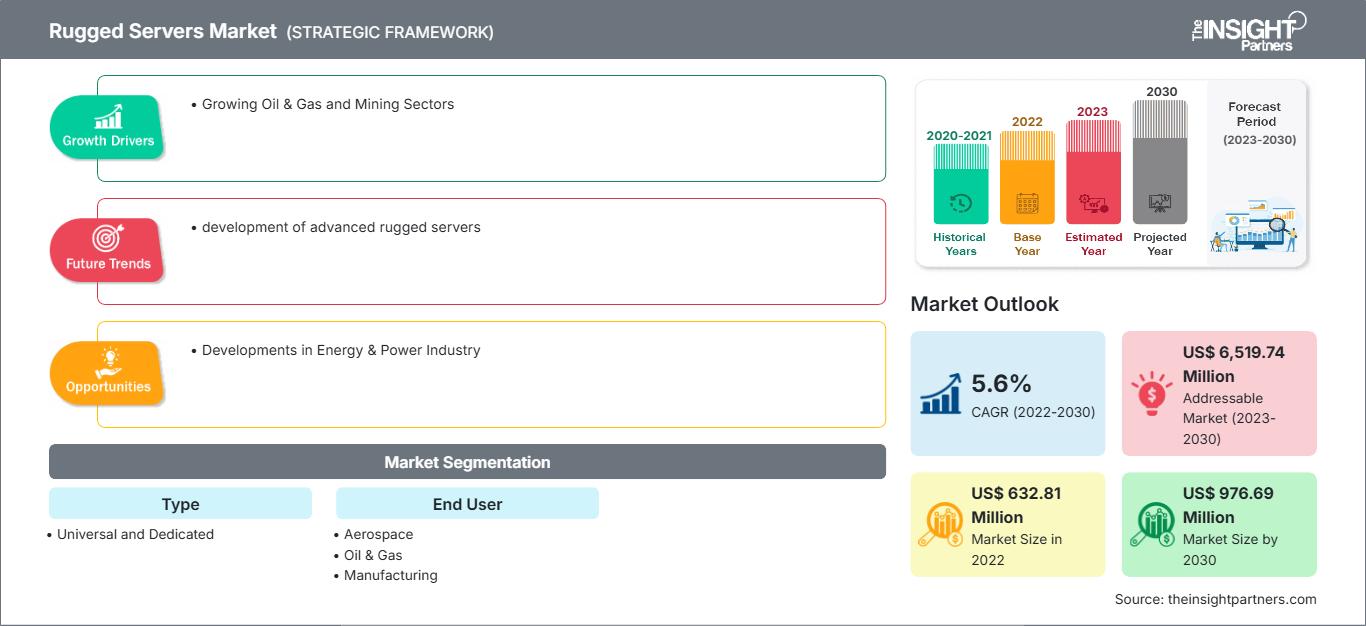
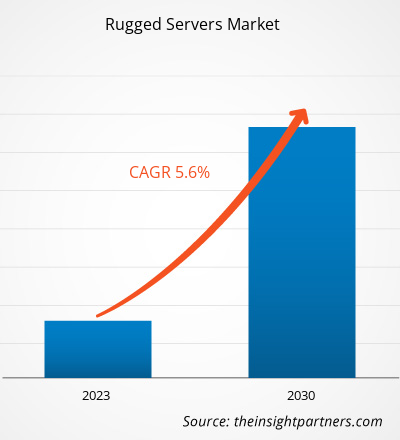
견고한 서버 시장 규모는 2025년 7억 1,611만 달러에서 2034년 13억 7,646만 달러에 이를 것으로 예상됩니다. 이 시장은 2026년부터 2034년까지 연평균 7.5%의 성장률을 기록할 것으로 전망됩니다.
견고한 서버 시장 분석
견고한 서버 시장은 군사, 산업 및 원격 작전과 같은 극한 환경에 맞게 설계된 내구성이 뛰어나고 고성능 컴퓨팅 시스템에 중점을 둡니다. 국방, 석유 및 가스, 엣지 컴퓨팅 분야의 수요가 성장을 주도하고 있습니다. 주요 트렌드로는 소형 설계, 향상된 연결성, 그리고 극한 환경에서 IoT 및 AI 기반 애플리케이션의 도입 증가 등이 있습니다.
견고한 서버 시장 개요
견고한 서버는 고온, 진동, 먼지, 습도와 같은 극한 환경에서도 안정적으로 작동하도록 설계된 특수 컴퓨팅 시스템입니다. 이러한 서버는 항공우주, 운송, 에너지, 현장 운영 등 다양한 분야에서 널리 사용됩니다. 원격지에서의 실시간 데이터 처리 수요 증가가 시장 성장을 견인하고 있습니다. 엣지 컴퓨팅, 5G 통합, 모듈형 고효율 설계의 발전은 향후 수요를 주도할 것으로 예상됩니다.
시장 조사 주요 내용
- 북미는 2022년 42.4%의 시장 점유율로 시장을 주도했습니다.
- 아시아 태평양 지역은 예측 기간 동안 연평균 6.4%의 성장률을 기록할 것으로 예상됩니다.
- 미국 시장은 예측 기간 동안 연평균 5.9%의 성장률을 보일 것으로 예상됩니다.
- 유형별로 보면, 전용 부문이 2022년에 66.3%로 가장 큰 시장 점유율을 차지했습니다.
- 최종 사용자별로는 항공우주 부문이 예측 기간 동안 연평균 7.1%의 성장률을 기록하며 가장 빠른 성장세를 보일 것으로 예상됩니다.
- 본 보고서는 Dell Technologies Inc, Core Systems Inc, Crystal Group Inc, Mercury Systems Inc, Systel Inc, Trenton Systems Inc, CP Technologies LLC, Emet OEM Solutions, Sparton Corp, NCS Technologies Inc와 같은 주요 업계 기업들을 소개하는 동시에 미래 시장을 재편할 수 있는 혁신적인 아이디어, 파괴적인 제품 및 서비스 분야의 주요 동향을 분석하고 업계 전반에 걸쳐 새롭게 떠오르는 트렌드를 제시합니다.
이 보고서를 귀하의 요구사항에 맞게 맞춤 설정하십시오.
무료 맞춤 제작 서비스를 받으세요견고한 서버 시장: 전략적 통찰
-
이 보고서에서 주요 시장 동향을 확인하세요.이 무료 샘플에는 시장 동향부터 추정치 및 예측에 이르기까지 다양한 데이터 분석이 포함됩니다.
견고한 서버 시장 성장 동인 및 기회
시장 동인:
- 국방 및 군사 수요 증가: 국방 및 전장 작전에서의 배치 증가로 인해 극한 환경을 견디고, 안전한 데이터 처리를 제공하며, 임무 수행에 필수적인 신뢰성 요구 사항을 충족할 수 있는 견고한 서버에 대한 수요가 증가하고 있습니다.
- 엣지 컴퓨팅 애플리케이션의 성장: 원격 및 열악한 환경에서의 엣지 컴퓨팅 확장은 실시간 데이터 처리, 낮은 지연 시간 및 향상된 운영 효율성을 위한 견고한 서버 도입을 촉진합니다.
- 산업 자동화 확장: 제조, 석유 및 가스, 광업 부문 전반에 걸친 산업 자동화의 급속한 확산으로 인해 열악한 작업 환경에서도 중단 없는 성능을 보장하는 내구성 있는 서버에 대한 수요가 증가하고 있습니다.
시장 기회:
- 5G 네트워크와의 통합: 5G 기술의 등장으로 견고한 서버가 고속 연결을 지원할 수 있는 기회가 생겨 원격 애플리케이션에서 더 빠른 데이터 전송과 향상된 성능을 구현할 수 있게 되었습니다.
- 스마트 교통 분야에서의 채택 증가: 철도 및 자율 주행 차량을 포함한 스마트 교통 시스템의 성장은 데이터 처리, 통신 및 안전 운영을 안정적으로 관리할 수 있는 견고한 서버에 대한 수요를 창출합니다.
- 소형 및 모듈형 설계에 대한 수요 증가: 소형, 경량, 모듈형의 견고한 서버에 대한 선호도가 높아짐에 따라 제조업체는 공간 제약이 있는 환경에 적합한 유연하고 확장 가능한 솔루션을 개발할 수 있는 기회를 얻고 있습니다.
견고한 서버 시장 보고서 세분화 분석
견고한 서버 시장은 구조, 성장 전망 및 신흥 트렌드를 이해하기 위해 여러 부문으로 분류됩니다. 아래는 업계 보고서에서 일반적으로 사용되는 시장 세분화 방식입니다.
유형별:
- 견고한 랙마운트 서버: 견고한 랙마운트 서버는 극한의 환경 조건을 견딜 수 있도록 설계된 표준 랙 구성으로 고성능 컴퓨팅 기능을 제공합니다. 이러한 서버는 신뢰성, 확장성 및 내구성이 중요한 국방, 항공우주, 산업 자동화, 석유 및 가스, 운송 분야에 널리 사용됩니다.
- 견고한 블레이드 서버: 견고한 블레이드 서버는 소형 고밀도 아키텍처와 작은 물리적 공간에서도 뛰어난 컴퓨팅 성능을 제공할 수 있는 능력 덕분에 시장에서 점점 더 주목받고 있습니다.
- 견고한 엣지 서버: 데이터 생성 지점 또는 그 근처에서 실시간 데이터 처리에 대한 필요성이 증가함에 따라 견고한 엣지 서버는 주요 성장 시장 부문으로 부상하고 있습니다.
- 기타: 견고한 서버 시장의 타워 서버는 내구성, 확장성 및 유지보수성이 필수적인 혹독하고 중요한 환경에 맞춰 설계된 핵심 컴퓨팅 플랫폼 역할을 합니다.
메모리 용량별:
- 256GB 미만: "256GB 미만" 메모리 제품군은 주로 중간 정도의 컴퓨팅 및 저장 용량을 필요로 하는 애플리케이션에 적합합니다.
- 256GB~512GB: 256GB~512GB 메모리 제품군은 전 세계 견고한 서버 시장에서 중간급 위치를 차지하며, 성능, 확장성 및 비용 효율성의 균형 잡힌 조합을 제공합니다.
- 512GB ~ 1TB: 512GB ~ 1TB 메모리 제품군은 데이터 집약적이고 미션 크리티컬한 애플리케이션을 지원하도록 설계된 글로벌 러기드 서버 시장의 고성능 제품군입니다.
- 1TB 이상: "1TB 이상" 메모리 제품군은 데이터 집약적이고 연산 능력이 요구되는 애플리케이션의 요구 사항을 충족하는 글로벌 고강도 서버 시장의 프리미엄 등급을 나타냅니다.
신청을 통해:
- 기준
- 헌신적인
최종 사용자 기준:
- 국방 및 군사
- 국방 및 군사
- 석유 및 가스
- 에너지 및 공공시설
- 통신
- 항공우주 및 항공
- 운송 및 물류
- 기타
지리학별:
- 북아메리카
- 유럽
- 아시아 태평양
- 남미 및 중앙아메리카
- 중동 및 아프리카
견고한 서버 시장 보고서 범위
| 보고서 속성 | 세부 |
|---|---|
| 2025년 시장 규모 | 미화 7억 1천만 달러 |
| 2034년 시장 규모 | 13억 7천만 달러 |
| 글로벌 연평균 성장률(2026년~2034년) | 7.5% |
| 역사적 데이터 | 2021-2024 |
| 예측 기간 | 2026-2034 |
| 포함되는 부문 |
유형별로
|
| 대상 지역 및 국가 |
북아메리카
|
| 시장 선도 기업 및 주요 기업 프로필 |
|
견고한 서버 시장 참여자 밀도: 비즈니스 역학에 미치는 영향 이해
견고한 서버 시장은 소비자의 선호도 변화, 기술 발전, 제품 이점 인식 제고 등 여러 요인으로 인해 최종 사용자 수요가 증가하면서 빠르게 성장하고 있습니다. 수요가 증가함에 따라 기업들은 제품군을 확장하고, 소비자 요구를 충족하기 위한 혁신을 이루며, 새로운 트렌드를 활용하여 시장 성장을 더욱 촉진하고 있습니다.
지역별 견고한 서버 시장 점유율 분석
아시아 태평양 지역의 견고한 서버 시장은 국방 투자 확대, 산업 자동화 증가, 엣지 컴퓨팅 도입 확대, 인프라 프로젝트 증가, 그리고 열악하고 외딴 환경에서의 안정적인 컴퓨팅 솔루션 수요 증가에 힘입어 빠르게 성장하고 있습니다. 여기에 5G 연결성 발전, 사물 인터넷(IoT) 도입 증가, 정부 현대화 사업, 그리고 실시간 데이터 처리 수요 증가가 더해져 시장 성장을 견인하고 있습니다.
견고한 서버 시장의 성장률은 산업 발전 수준, 국방비 지출, 인프라 성숙도, 환경 조건 및 기술 채택률의 차이로 인해 지역별로 다릅니다. 아래는 지역별 시장 점유율 및 동향에 대한 요약입니다.
1. 북미
- 시장 점유율: 세계 시장에서 상당한 비중을 차지하고 있습니다.
-
주요 동인:
- 강력한 국방 및 군사 현대화 프로그램: 미국의 강력한 국방 투자는 견고한 서버에 대한 수요를 촉진합니다. 군사 작전에는 극한의 전장 환경에서도 작동할 수 있는 내구성이 뛰어나고 안전하며 신뢰할 수 있는 컴퓨팅 시스템이 필요하기 때문입니다.
- 엣지 컴퓨팅 기술의 높은 도입률
- 첨단 산업 자동화 및 IIoT 통합
- 동향: 지역화된 엣지 데이터 센터의 구축이 증가함에 따라 저지연 처리가 지원되고 원격 및 중요 업무 환경에서 견고한 서버의 성능이 향상됩니다.
2. 유럽
- 시장 점유율: EU의 초기 엄격한 규제 덕분에 상당한 점유율을 확보함
-
주요 동인:
- 스마트 제조에 대한 관심 증가: 유럽이 인더스트리 4.0에 따라 스마트 공장으로의 전환을 추진함에 따라 열악한 제조 환경에서 실시간 모니터링, 자동화 및 데이터 처리를 가능하게 하는 견고한 서버에 대한 수요가 증가하고 있습니다.
- 교통 인프라 투자 확대
- 엄격한 산업 안전 및 신뢰성 기준.
- 동향: 환경 규제 증가.
3. 아시아 태평양
- 시장 점유율: 가장 빠르게 성장하는 지역이자 시장 점유율이 가장 높은 지역
-
주요 동인:
- 급속한 산업화 및 도시화: 중국과 인도와 같은 국가들의 급속한 산업 성장은 안정적인 운영, 자동화 및 실시간 데이터 처리를 지원하는 견고한 서버에 대한 필요성을 증가시키고 있습니다.
- 신흥 경제국의 국방 예산 증가
- 통신 및 5G 인프라 확장
- 동향: 통신망 확장 및 5G 구축 증가.
4. 중동 및 아프리카
- 시장 점유율: 시장 점유율은 낮지만 빠르게 성장하고 있습니다.
-
주요 동인:
- 석유 및 가스 부문 확장: 석유 및 가스 사업의 성장은 극한 온도 및 외딴 사막 환경에서 최소한의 인프라 지원만으로도 안정적인 데이터 처리, 모니터링 및 제어를 가능하게 하는 견고한 서버에 대한 수요를 증가시킵니다.
- 스마트 시티 사업 확대
- 국방 및 안보 분야 투자 증가
- 동향: 스마트 시티 프로젝트로 인해 견고한 서버 구축이 촉진되고 있습니다.
5. 남미 및 중앙아메리카
- 시장 점유율: 꾸준히 증가하는 시장 점유율
-
주요 동인:
- 광업 및 석유 산업의 성장; 광업 및 석유 탐사 활동의 확장은 견고한 서버에 대한 수요를 촉진합니다. 이러한 산업은 외딴 지역, 열악한 환경 등 까다로운 조건에서도 효율적으로 운영하기 위해 강력한 컴퓨팅 시스템을 필요로 하기 때문입니다.
- 증가하는 인프라 개발 프로젝트
- 원격 모니터링 시스템 도입 증가
- 동향: 광업 및 석유 부문에서 견고한 서버 사용이 증가하고 있습니다.
높은 시장 밀도와 경쟁
이 시장은 Core Systems, CP North America, Crystal Group Inc., Dell Inc., Mercury Systems Inc., Systel Inc., Trenton Systems Inc., Kontron AG, Advantech Co., Ltd., Hiper Global, Rugged Science, H3 Platform, Inc., General Micro Systems, Inc., Parry Labs, Curtiss-Wright Corporation, RAVE Computers, 및 Zmicro, Inc.와 같은 주요 글로벌 업체들이 존재하여 경쟁이 매우 치열합니다.
이처럼 치열한 경쟁 속에서 기업들은 다음과 같은 차별화된 서비스를 제공함으로써 두각을 나타내야 합니다.
- 혁신적이고 고성능의 견고한 서버 솔루션
- 5G 및 IoT 통합을 포함한 고급 연결 기능
- 맞춤 설정 및 모듈식 구성 기능
- 신뢰할 수 있고 안전하며 실시간 데이터 처리 기능을 제공합니다.
- 확장된 제품 포트폴리오
기회와 전략적 움직임
- 엣지 컴퓨팅 시장으로의 확장 – 기업은 원격 환경에서 저지연 실시간 처리를 위해 설계된 견고한 서버를 제공함으로써 증가하는 엣지 컴퓨팅 구축 추세를 활용할 수 있습니다.
- 5G 및 IoT 생태계와의 통합 – 5G 및 IoT를 활용하여 연결성과 성능을 향상시키고 다양한 산업 분야에 새로운 응용 분야를 개척합니다.
면책 조항: 위에 나열된 회사들은 특정 순서대로 순위가 매겨진 것이 아닙니다.
연구 과정에서 다른 회사들도 분석되었습니다.
- 캡텍 그룹 주식회사
- 스리테크
- 유니트로닉스 AU
- Acme Portable Machines, Inc.
- 펜타곤 러기드 시스템즈 주식회사
- NCS 테크놀로지스 주식회사
- 엘마 일렉트로닉
- 벨트로닉 IPC AG
- 유로테크 SpA
견고한 서버 시장 뉴스 및 최근 동향
- 크리스탈 그룹, IEC 61850-3 인증 획득 - 중요 인프라를 위한 고성능 견고한 컴퓨팅 솔루션 제공업체인 크리스탈 그룹은 2026년 1월, 자사의 ES3604L24 변전소 서버가 IEC 61850-3 인증을 획득했다고 발표했습니다. 이번 인증 획득은 상호 운용성, 신뢰성 및 표준 기반 전력망 현대화에 대한 회사의 노력을 더욱 강화하는 것입니다.
- 크리스탈 그룹, 차세대 프로세싱 부품을 제품 포트폴리오에 통합 - 크리스탈 그룹은 2026년 2월, 자사의 서버 및 임베디드 컴퓨터 포트폴리오에 차세대 프로세싱 부품을 통합했다고 발표했습니다. 업계를 선도하는 파트너들과 긴밀히 협력하여, 크리스탈 그룹은 견고한 솔루션에 최신 기술을 적극적으로 접목하는 데 주력하고 있습니다.
견고한 서버 시장 보고서 범위 및 제공 내용
"견고한 서버 시장 규모 및 전망(2021~2034)" 보고서는 다음과 같은 영역을 포함하여 시장에 대한 자세한 분석을 제공합니다.
- 본 보고서에서는 글로벌, 지역 및 국가 수준에서 주요 시장 부문을 모두 포함하는 견고한 서버 시장 규모 및 전망을 제시합니다.
- 견고한 서버 시장 동향과 함께 시장 동인, 제약 요인 및 주요 기회와 같은 시장 역학을 분석합니다.
- 상세한 PEST 및 SWOT 분석
- 견고한 서버 시장 분석은 주요 시장 동향, 글로벌 및 지역별 시장 환경, 주요 업체, 규제 및 최근 시장 동향을 다룹니다.
- 본 보고서는 견고한 서버 시장의 시장 현황 및 경쟁 분석을 제공하며, 시장 집중도, 히트맵 분석, 주요 업체 및 최근 개발 동향을 다룹니다.
- 상세 기업 프로필

나빈은 맞춤형, 신디케이트 및 컨설팅 프로젝트 전반에 걸쳐 9년 이상의 전문 지식을 보유한 시장 조사 및 컨설팅 전문가입니다. 현재 부사장으로 재직 중이며, 프로젝트 가치 사슬 전반의 이해관계자들을 성공적으로 관리해 왔으며, 100편 이상의 연구 보고서와 30건 이상의 컨설팅 업무를 수행했습니다. 그는 산업 및 정부 프로젝트 전반에 걸쳐 다양한 업무를 수행하며 고객 성공과 데이터 기반 의사 결정에 크게 기여하고 있습니다.
나빈은 카르나타카주 VTU에서 전자통신 공학 학위를, 마니팔 대학교에서 마케팅 및 운영 MBA를 취득했습니다. 그는 9년 동안 IEEE 회원으로 활발하게 활동하며 컨퍼런스, 기술 심포지엄에 참여하고 지역 및 지역 차원에서 자원봉사 활동을 해왔습니다. 현재 직책을 맡기 전에는 IndustryARC에서 준전략 컨설턴트로, 휴렛팩커드(HP Global)에서 산업용 서버 컨설턴트로 근무했습니다.
- 포괄적인 시장 규모 산정 및 전망 분석
- 상세 시장 세분화 분석
- 심층적인 시장 동향 및 요인 분석
- 지역 및 국가별 인사이트
- 경쟁 구도 및 기업 벤치마킹
- 전략적 비즈니스 인텔리전스
사용 후기
Insight Partners의 SCADA 시스템 시장 보고서는 포괄적이며, 현재 동향과 미래 전망에 대한 귀중한 통찰력을 제공합니다. 팀은 매우 전문적이고, 신속하게 대응하며, 처음부터 끝까지 지원해 주었습니다. 저희는 매우 만족하며 Insight Partners의 서비스를 적극 추천합니다.
란 케뎀 파트너, Reali Technologies LTDs아주 구체적인 소프트웨어 시장에 대한 보고서를 요청했는데, 팀에서 며칠 만에 보고서를 작성해 주셨습니다. 정보는 매우 관련성이 높고 잘 정리되어 있었습니다. 그 후 보고서에 몇 가지 수정과 추가 사항을 요청했습니다. 팀원들의 응답도 매우 빨랐고, 일주일도 채 되지 않아 최종 보고서를 받았습니다.
장-에르브 젠 의장, 퓨처 애널리티카The Insight Partners와 함께 중요한 시장 조사 및 예측 작업을 진행했습니다. Insight Partners는 기회와 위험에 대한 명확한 통찰력을 제공하여 계획을 세우는 데 큰 도움이 되었습니다. The Insight Partners의 조사는 사용하기 쉬웠고, 탄탄한 데이터를 기반으로 했습니다. 덕분에 현명하고 자신 있는 결정을 내릴 수 있었습니다. The Insight Partners를 강력 추천합니다.
피유시 나그팔 수석 부사장, 하이빔 글로벌Insight Partners는 탄탄한 분야 전문성을 바탕으로 통찰력 있고 체계적인 시장 조사를 제공했습니다. Insight Partners 팀은 처음부터 끝까지 전문적이고 신속하게 대응했습니다. 사용자 친화적인 웹사이트 덕분에 업계 보고서에 쉽게 접근할 수 있었습니다. 신뢰할 수 있고 고품질의 조사 서비스를 원하신다면 Insight Partners를 강력 추천합니다.
아다치 유키히코 대표이사, 딥블루 주식회사The Insight Partners에서 시장 보고서를 구매한 것은 이번이 처음입니다. 처음에는 확신이 없었지만, 웹사이트를 방문하고 나서 위험을 감수하고 시장 보고서를 구매하는 것이 더 편하다는 것을 알게 되었습니다. 보고서의 품질과 고객 서비스에 매우 만족합니다. 처음 보고서를 보고 몇 가지 질문과 의견이 있었지만, 분석가와 이메일로 몇 차례 대화를 나눈 후, 전략 기획 과정에 참고할 수 있는 보고서를 확보했다고 생각합니다. 시간을 내어 긍정적인 경험을 선사해 주셔서 정말 감사합니다. 다른 사람들에게도 귀사의 서비스를 적극 추천할 것이며, 추가적인 시장 데이터가 필요할 때면 가장 먼저 귀사에 연락하겠습니다.
존 스즈키 사장 겸 최고 경영자, 이사회 이사, BK 테크놀로지스나이지리아 감염성 질환 IVD 시장 관련 정보 요청에 응해 주신 귀사의 지원과 전문성에 감사드립니다. 귀사의 인내심과 지도, 그리고 할인 혜택을 기꺼이 제공해 주셔서 결국 계약을 성사시킬 수 있었습니다. 첫 만남을 통해 귀사가 저에게 심어주신 좋은 인상을 바탕으로 앞으로도 The Insight Partners와 함께할 수 있기를 기대합니다.
치지오케 박사 오니아 전무이사, 파인크레스트 헬스케어 유한회사구매 이유
- 정보에 기반한 의사 결정
- 시장 역학 이해
- 경쟁 분석
- 고객 인사이트
- 시장 예측
- 위험 완화
- 전략 기획
- 투자 타당성 분석
- 신흥 시장 파악
- 마케팅 전략 강화
- 운영 효율성 향상
- 규제 동향에 발맞춰 대응


