전자 및 반도체 시장 개요, 성장, 동향, 분석, 연구 보고서(2021-2030)에 대한 지출 분석
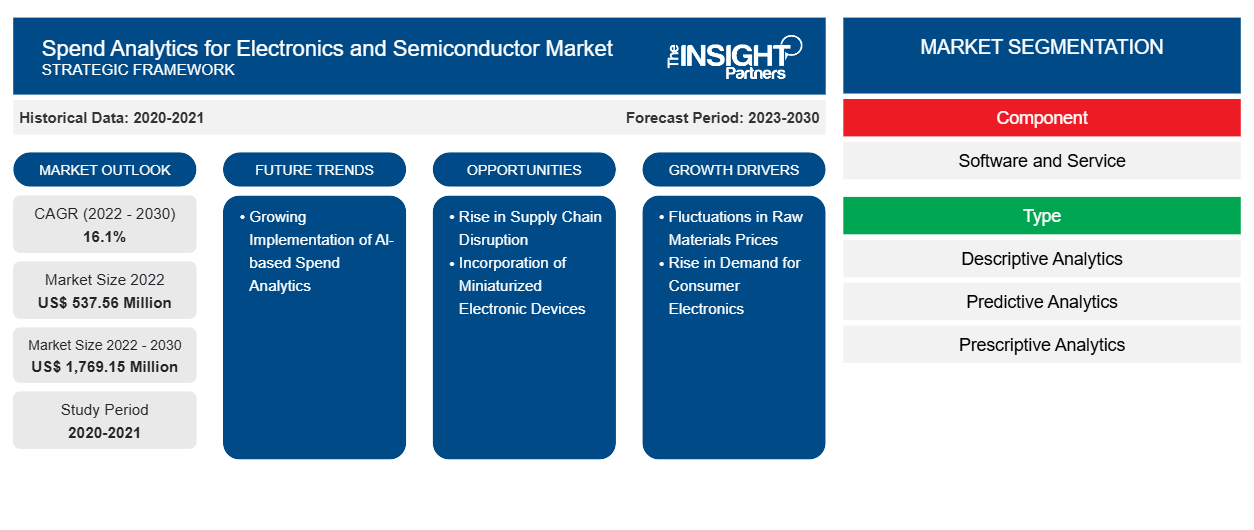
이전 데이터 : 2020-2021 | 기준 연도 : 2022 | 예측 기간 : 2023-2030전자 및 반도체 시장 규모 및 예측(2020~2030년)에 대한 지출 분석, 구성 요소(소프트웨어 및 서비스), 유형(설명적 분석, 예측 분석 및 처방적 분석), 배포(온프레미스 및 클라우드), 애플리케이션(재무 관리, 위험 관리, 거버넌스 및 규정 준수 관리, 공급업체 소싱 및 성과 관리, 수요 및 공급 예측 등)별 글로벌 및 지역별 점유율, 추세 및 성장 기회 분석
- 상태 : 게시됨
- 보고서 코드 : TIPRE00038938
- 범주 : 기술, 미디어 및 통신
- 페이지 수 : 162
- 사용 가능한 보고서 형식 :


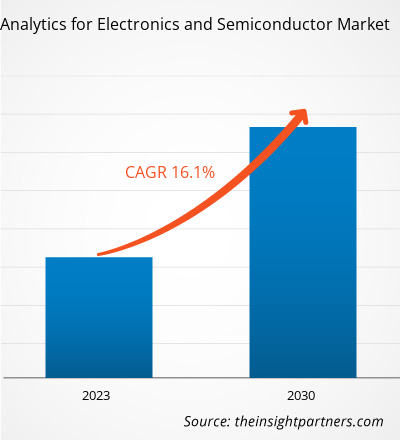
[연구 보고서] 전자 및 반도체 시장 규모에 대한 지출 분석은 2022년에 5억 3,756만 달러로 평가되었으며, 2030년까지 1,769.15만 달러에 도달할 것으로 예상됩니다. 2022년부터 2030년까지 16.1%의 CAGR을 기록할 것으로 추산됩니다.
전자 및 반도체 시장 분석가 관점에 대한 지출 분석:
인공 지능(AI), 생성 AI, 빅데이터 분석, 사물 인터넷(IoT), 클라우드 컴퓨팅, 로봇 프로세스 자동화(RPA), 이미지 인식 및 기타 기술의 통합은 향후 몇 년 동안 지출 분석 솔루션의 기능을 향상시킬 것으로 예상됩니다. 지출 분석과 관련된 기술적 발전은 인공 지능(AI) 통합에 의해 주도됩니다. AI는 기계와 소프트웨어 애플리케이션이 인간의 인지처럼 추론하고, 학습하고, 행동할 수 있도록 합니다. 이 기능을 통해 AI 시스템은 복잡한 데이터 세트를 분석하고, 패턴을 인식하고, 사용 가능한 정보를 기반으로 정보에 입각한 결정을 내릴 수 있습니다. AI 기술의 부상으로 인해 강력하고 효율적인 반도체 칩에 대한 수요도 증가했습니다. AI 시스템은 대량의 데이터를 실시간으로 처리하고 분석하기 위해 고성능 컴퓨팅 기능이 필요합니다. 이러한 수요는 AI 워크로드에 최적화된 특수 AI 칩의 개발을 촉진했습니다. 따라서 AI 기반 지출 분석의 증가는 향후 몇 년 동안 전자 및 반도체 시장 성장을 위한 지출 분석에 대한 충분한 기회를 창출할 것으로 예상됩니다.
전자 및 반도체 시장 개요에 대한 지출 분석:
전자 및 반도체 시장 동향에 대한 글로벌 지출 분석은 상당한 성장을 이룰 수 있는 잠재력을 나타내며 향후 몇 년 동안 계속 확대될 것으로 예상됩니다. 데이터 통합 및 복잡한 데이터 분석의 발전은 전자 및 반도체 시장 성장에 대한 지출 분석에 상당한 영향을 미칠 것으로 예상됩니다. 시장 생태계에는 소프트웨어 개발자, 컨설팅 및 자문 회사, 최종 사용자를 포함한 다양한 이해 관계자가 포함됩니다. 소프트웨어 개발자는 전자 및 반도체 산업의 기업의 공통적 또는 특정 요구 사항에 따라 지출 분석 소프트웨어를 만들고 유지 관리하는 데 필수적입니다. 컨설팅 및 자문 회사는 전자 및 반도체 회사에서 지출 분석 소프트웨어를 배포하는 데 중요한 역할을 합니다. 이들의 전문 지식은 기술적 능력과 비즈니스 요구 사항 간의 격차를 메워 분석 솔루션의 성공적인 채택을 보장합니다. 전자 및 반도체 지출 분석의 최종 사용자로는 전자 제조 서비스 제공업체, 원래 장비 제조업체 등이 있습니다.
귀하의 요구 사항에 맞게 이 보고서를 사용자 정의하세요
이 보고서의 일부 또는 국가 수준 분석, Excel 데이터 팩을 포함하여 모든 보고서에 대한 사용자 정의를 무료로 받을 수 있으며 신생 기업 및 대학을 위한 훌륭한 혜택과 할인 혜택을 이용할 수 있습니다.
전자 및 반도체 시장을 위한 지출 분석: 전략적 통찰력
-
이 보고서의 주요 시장 동향을 알아보세요.이 무료 샘플에는 시장 동향부터 추정 및 예측까지 다양한 데이터 분석이 포함됩니다.
전자 및 반도체 시장을 위한 지출 분석: 드라이버
원자재 가격 변동은 전자 및 반도체 시장 성장을 위한 지출 분석을 촉진합니다.
전자 및 반도체 시장 예측에 대한 글로벌 지출 분석은 원자재 가격 변동의 영향을 포함한 다양한 요인에 대한 분석을 기반으로 합니다. 칩 판매와 수요 변화는 전자 및 반도체 산업에서 운영되는 회사의 전반적인 수익과 수익성에 영향을 미칠 수 있습니다. 특히, 최대 규모의 계약 칩 제조업체인 TSMC의 본거지인 대만은 가전제품, 모바일 기기, 데이터 센터, 군용 항공기를 포함한 다양한 도메인에서 널리 사용되는 반도체의 주요 생산자로서 중요한 역할을 했습니다. 시장에서 원자재 가격의 불확실성은 공급망을 혼란스럽게 만들어 전자 부품과 반도체의 가용성과 가격에 영향을 미칠 수 있습니다. 또한 반도체 부족은 원자재 가격과 COVID-19 팬데믹으로 인한 혼란과 같은 시장 변동성을 포함한 다양한 요인에 기인할 수 있습니다. 전자 및 반도체 회사는 경쟁력을 유지하면서 비용 효율적인 제품을 제공하기 위해 노력하면서 시장 변동성과 원자재 가격의 불확실성 속에서 전략적 결정을 내리는 과제에 직면합니다. 이는 차례로 전자 및 반도체 시장 예측에 대한 지출 분석의 채택 가능성을 높여 진행에 도움이 됩니다. 또한 원자재 가격의 변동은 어려운 시기를 헤쳐나가기 위한 전략적 의사 결정을 필요로 합니다. 따라서 지출 분석은 비효율성을 파악하고 조달 프로세스를 최적화하며 효과적인 비용 관리에 필요한 정보에 입각한 의사 결정을 내리는 데 도움이 되도록 통합됩니다. 지출 패턴, 공급업체 성과 및 시장 동향에 대한 귀중한 통찰력을 제공함으로써 지출 분석은 회사가 데이터 중심의 결과를 도출하고 이에 따라 전략을 조정할 수 있도록 지원합니다. 전자 및 반도체 시장에서 운영되는 회사는 지출 분석을 활용하여 지출 패턴을 종합적으로 이해하고, 비용 절감 기회를 파악하고, 위험을 완화하고, 시장 변동성과 불확실성에 직면하여 전반적인 재무 성과를 개선할 수 있습니다. 따라서 원자재 가격의 변동은 전자 및 반도체 시장 예측 가치에 대한 지출 분석의 성장에 기여합니다.
전자 및 반도체 시장을 위한 지출 분석: 세그먼트
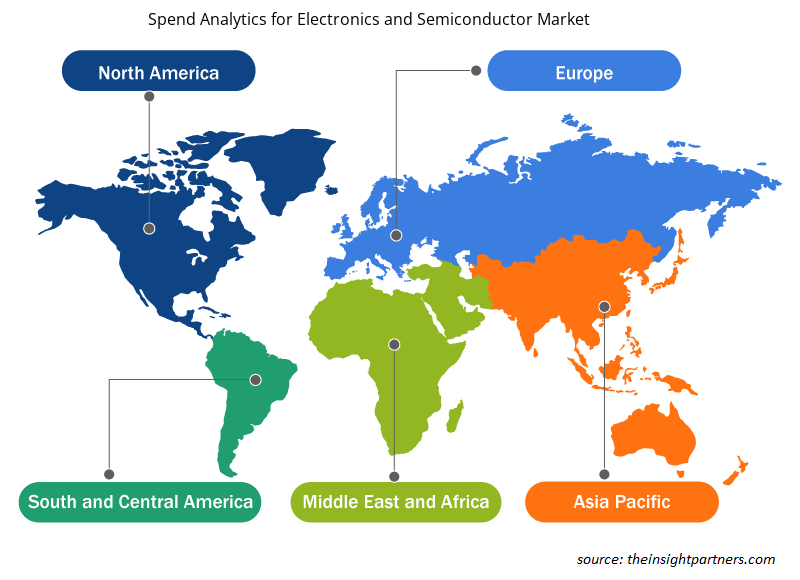
전자 및 반도체 시장의 글로벌 지출 분석은 구성 요소, 유형, 배포 및 애플리케이션을 기준으로 세분화됩니다. 구성 요소를 기준으로 시장은 소프트웨어와 서비스로 나뉩니다. 유형을 기준으로 시장은 예측 분석 , 처방 분석 및 설명 분석으로 세분화됩니다. 배포를 기준으로 시장은 온프레미스 및 클라우드로 나뉩니다. 애플리케이션을 기준으로 시장은 재무 관리, 위험 관리, 공급업체 소싱 및 성과 관리, 거버넌스 및 규정 준수 관리, 수요 및 공급 예측 등으로 세분화됩니다. 지리적으로 전자 및 반도체 시장의 지출 분석은 북미, 유럽, 아시아 태평양(APAC), 중동 및 아프리카(MEA), 남미(SAM)로 세분화됩니다.
지출 분석 소프트웨어에는 여러 소스와 분산 시스템(구매 카드, 미지급금, 구매 주문서 및 기타 모든 구매 채널)에서 모든 형식으로 기업 전체 지출 정보가 포함됩니다. 이 소프트웨어는 정보의 대량에서 의미를 추론하여 지출 데이터를 기회 측면에서 변환하고 표시합니다. 가시성을 통해 조달 활동을 변환하고 기업 전체 지출을 보다 효과적으로 제어할 수 있습니다. 전자 및 반도체 제품 제조의 급증으로 인해 방대한 양의 데이터가 빠르게 생성되었습니다. 이로 인해 지출 분석 소프트웨어를 사용하여 달성할 수 있는 향상된 데이터 품질에 대한 필요성이 발생합니다. 여러 업체가 전자 및 반도체 시장 점유율에 대한 지출 분석을 개선하기 위한 고급 솔루션을 출시했습니다. 예를 들어, 2022년 2월, Business Spend Management(BSM) 솔루션 공급업체인 Coupa Software는 차세대 지출 관리 솔루션 제품군인 Community.ai를 출시한다고 발표했습니다. Coupa는 데이터 기반 인공 지능의 힘과 개인 간 관계를 결합하여 구매자와 판매자 간의 상호 작용을 개선하여 B2B 커뮤니티를 혁신합니다.
전자 및 반도체 시장을 위한 지출 분석: 지역
전자 및 반도체에 대한 APAC 지출 분석 시장 규모는 2022년에 3억 3,216만 달러로 평가되었으며 2030년까지 1,151.18만 달러에 도달할 것으로 예상되며 2022년에서 2030년까지 16.8%의 CAGR을 기록할 것으로 예상됩니다. 아시아 태평양 지역의 전자 및 반도체에 대한 지출 분석 시장 규모는 향후 몇 년 동안 급속한 성장을 경험할 것으로 예상되며 이 지역은 예측 기간 내내 전자 및 반도체에 대한 지출 분석 시장 점유율이 가장 높을 것으로 예상됩니다. 이 지역의 시장 진전은 소비자와 기업 사이에서 분석 도구에 대한 수용이 증가하는 데 기인할 수 있습니다. 아시아 태평양 지역은 분석 도구 채택 증가, 빅데이터 및 분석 부문의 성장, 통신, 은행, 중앙 정부, 개별 제조 및 전문 서비스와 같은 산업의 특정 요구 사항에 의해 지출 분석 소프트웨어에 대한 수요가 증가하고 있습니다. 중국, 일본, 인도는 데이터 폭발, 도시화, 머신 러닝 개발 및 많은 MSME에 의해 주도되는 이 지역의 지출 분석 도입의 최전선에 있습니다. 아시아 태평양의 주요 전자 및 반도체 제조업체로는 Powerchip Semiconductor Manufacturing(PSMC), Taiwan Semiconductor Manufacturing Company(TSMC), United Microelectronics(UMC), Vanguard International Semiconductor(VIS)가 있으며, 이들은 전자 및 반도체 시장 분석을 위한 지출 분석에서 고려되는 주요 업체가 개발한 솔루션을 활용하거나 잠재 고객입니다.
지출 분석의 활용이 증가함에 따라 전자 및 반도체 부문의 조직은 구매 프로세스를 최적화하고 정보에 입각한 지출 결정을 내릴 수 있습니다. 지출 패턴을 분석함으로써 조직은 비용을 절감하고 공급업체를 효과적으로 관리하며 공급망의 중단으로 인해 발생하는 위험을 완화할 수 있는 기회를 파악할 수 있습니다. 지출 데이터를 면밀히 모니터링하고 분석함으로써 조직은 대체 공급업체를 파악하고 비용을 효과적으로 관리하며 전자 부품과 반도체의 안정적인 공급을 보장할 수 있습니다. 이러한 요인은 전자 및 반도체 시장 점유율에 대한 APAC 지출 분석의 성장을 촉진합니다.
전자 및 반도체 시장을 위한 지출 분석: 주요 참여자
Coupa Software Inc, IBM Corporation, Ivalua Inc, Lytica Inc, NB Ventures Inc(GEP), SAP SE, Scanmarket AS, Synertrade Inc, Vortal Connecting Business SA, Zycus Inc는 전자 및 반도체 시장 분석을 위한 지출 분석에서 다루는 주요 기업 중 일부입니다. 이 연구 조사에서 전자 및 반도체 시장 생태계를 위한 지출 분석에 대한 전체적인 관점을 얻기 위해 다른 여러 주요 기업을 분석했습니다.
전자 및 반도체 시장 지역 통찰력을 위한 지출 분석
Insight Partners의 분석가들은 예측 기간 동안 전자 및 반도체 시장 지출 분석에 영향을 미치는 지역적 추세와 요인을 철저히 설명했습니다. 이 섹션에서는 북미, 유럽, 아시아 태평양, 중동 및 아프리카, 남미 및 중미의 전자 및 반도체 시장 지출 분석 세그먼트와 지역에 대해서도 설명합니다.
- 전자 및 반도체 시장을 위한 지출 분석을 위한 지역별 데이터 얻기
전자 및 반도체 시장 보고서 범위에 대한 지출 분석
| 보고서 속성 | 세부 |
|---|---|
| 2022년 시장 규모 | 5억 3,756만 달러 |
| 2030년까지 시장 규모 | 1,769.15백만 달러 |
| 글로벌 CAGR (2022-2030) | 16.1% |
| 역사적 데이터 | 2020-2021 |
| 예측 기간 | 2023-2030 |
| 다루는 세그먼트 |
구성 요소별로
|
| 포함된 지역 및 국가 |
북아메리카
|
| 시장 선도 기업 및 주요 회사 프로필 |
|
시장 참여자 밀도: 비즈니스 역학에 미치는 영향 이해
전자 및 반도체 시장 지출 분석 시장은 소비자 선호도의 변화, 기술 발전, 제품의 이점에 대한 인식 증가와 같은 요인으로 인해 최종 사용자 수요가 증가함에 따라 빠르게 성장하고 있습니다. 수요가 증가함에 따라 기업은 제품을 확장하고, 소비자의 요구를 충족하기 위해 혁신하고, 새로운 트렌드를 활용하여 시장 성장을 더욱 촉진하고 있습니다.
시장 참여자 밀도는 특정 시장이나 산업 내에서 운영되는 회사나 기업의 분포를 말합니다. 주어진 시장 공간에 얼마나 많은 경쟁자(시장 참여자)가 존재하는지 그 규모나 전체 시장 가치에 비해 나타냅니다.
전자 및 반도체 지출 분석 시장에서 운영되는 주요 회사는 다음과 같습니다.
- 쿠파 소프트웨어 주식회사
- 인터내셔널 비즈니스 머신스 코퍼레이션
- 이발루아 주식회사
- 라이티카 주식회사
- NB 벤처스 주식회사
면책 조항 : 위에 나열된 회사는 어떤 특별한 순서에 따라 순위가 매겨지지 않았습니다.
- 전자 및 반도체 시장의 주요 기업 개요에 대한 지출 분석을 받아보세요
전자 및 반도체 시장 최근 동향에 대한 지출 분석:
전자 및 반도체 시장 참여자를 위한 지출 분석은 무기적 및 유기적 전략을 적극 채택합니다. 전자 및 반도체 시장 보고서의 지출 분석에 대한 몇 가지 주요 개발 사항은 다음과 같습니다.
- 2024년 1월, AW Rostamani Group(AWR)과 GEP는 협력하여 소스-투-페이(S2P) 프로세스를 혁신했습니다. AI 기반 조달 및 공급망 소프트웨어 공급업체 GEP는 AWR과 협력할 예정입니다. 후자는 GEP의 소프트웨어를 사용하여 소싱, 공급업체 및 계약 관리를 포함한 전체 소스-투-페이(S2P) 프로세스와 지출 분석을 혁신할 것이라고 확인했습니다.
- 2022년 2월, BSM 솔루션 제공업체인 Coupa Software는 차세대 지출 관리 도구 모음인 Community.ai 출시를 발표했습니다. Coupa는 데이터 기반 인공 지능의 기능과 개인 간 상호 작용을 결합하여 B2B 커뮤니티와 구매자와 판매자가 연결되는 방식을 개선합니다.

안키타는 기술, 미디어, 정보통신기술(ICT), 전자 및 반도체 분야에서 8년 이상의 경력을 보유한 역동적인 시장 조사 및 컨설팅 전문가입니다. Microsoft, Oracle, NEC Corporation, SAP, KPMG, Expeditors International 등 글로벌 고객을 대상으로 100건 이상의 컨설팅 및 조사 업무를 성공적으로 이끌고 수행했습니다. 그녀의 핵심 역량은 시장 평가, 데이터 분석, 예측, 전략 수립, 경쟁 정보 분석, 보고서 작성입니다.
안키타는 사전 판매 제안서 설계 및 고객 논의부터 실행 가능한 인사이트의 사후 판매까지 전체 프로젝트 주기를 능숙하게 처리합니다. 또한, 여러 부서의 팀을 관리하고, 복잡한 조사 모듈을 구성하며, 고객별 비즈니스 목표에 맞춰 솔루션을 조정하는 데 능숙합니다. 뛰어난 의사소통, 리더십, 그리고 프레젠테이션 능력을 바탕으로 빠르게 변화하는 시장 환경에서도 가치 중심의 성과를 꾸준히 달성해 왔습니다.
- 과거 분석(2년), 기준 연도, CAGR을 포함한 예측(7년)
- PEST 및 SWOT 분석
- 시장 규모 가치/거래량 - 글로벌, 지역, 국가
- 산업 및 경쟁 환경
- Excel 데이터세트
사용 후기
Insight Partners의 SCADA 시스템 시장 보고서는 포괄적이며, 현재 동향과 미래 전망에 대한 귀중한 통찰력을 제공합니다. 팀은 매우 전문적이고, 신속하게 대응하며, 처음부터 끝까지 지원해 주었습니다. 저희는 매우 만족하며 Insight Partners의 서비스를 적극 추천합니다.
란 케뎀 파트너, Reali Technologies LTDs아주 구체적인 소프트웨어 시장에 대한 보고서를 요청했는데, 팀에서 며칠 만에 보고서를 작성해 주셨습니다. 정보는 매우 관련성이 높고 잘 정리되어 있었습니다. 그 후 보고서에 몇 가지 수정과 추가 사항을 요청했습니다. 팀원들의 응답도 매우 빨랐고, 일주일도 채 되지 않아 최종 보고서를 받았습니다.
장-에르브 젠 의장, 퓨처 애널리티카The Insight Partners와 함께 중요한 시장 조사 및 예측 작업을 진행했습니다. Insight Partners는 기회와 위험에 대한 명확한 통찰력을 제공하여 계획을 세우는 데 큰 도움이 되었습니다. The Insight Partners의 조사는 사용하기 쉬웠고, 탄탄한 데이터를 기반으로 했습니다. 덕분에 현명하고 자신 있는 결정을 내릴 수 있었습니다. The Insight Partners를 강력 추천합니다.
피유시 나그팔 수석 부사장, 하이빔 글로벌Insight Partners는 탄탄한 분야 전문성을 바탕으로 통찰력 있고 체계적인 시장 조사를 제공했습니다. Insight Partners 팀은 처음부터 끝까지 전문적이고 신속하게 대응했습니다. 사용자 친화적인 웹사이트 덕분에 업계 보고서에 쉽게 접근할 수 있었습니다. 신뢰할 수 있고 고품질의 조사 서비스를 원하신다면 Insight Partners를 강력 추천합니다.
아다치 유키히코 대표이사, 딥블루 주식회사The Insight Partners에서 시장 보고서를 구매한 것은 이번이 처음입니다. 처음에는 확신이 없었지만, 웹사이트를 방문하고 나서 위험을 감수하고 시장 보고서를 구매하는 것이 더 편하다는 것을 알게 되었습니다. 보고서의 품질과 고객 서비스에 매우 만족합니다. 처음 보고서를 보고 몇 가지 질문과 의견이 있었지만, 분석가와 이메일로 몇 차례 대화를 나눈 후, 전략 기획 과정에 참고할 수 있는 보고서를 확보했다고 생각합니다. 시간을 내어 긍정적인 경험을 선사해 주셔서 정말 감사합니다. 다른 사람들에게도 귀사의 서비스를 적극 추천할 것이며, 추가적인 시장 데이터가 필요할 때면 가장 먼저 귀사에 연락하겠습니다.
존 스즈키 사장 겸 최고 경영자, 이사회 이사, BK 테크놀로지스나이지리아 감염성 질환 IVD 시장 관련 정보 요청에 응해 주신 귀사의 지원과 전문성에 감사드립니다. 귀사의 인내심과 지도, 그리고 할인 혜택을 기꺼이 제공해 주셔서 결국 계약을 성사시킬 수 있었습니다. 첫 만남을 통해 귀사가 저에게 심어주신 좋은 인상을 바탕으로 앞으로도 The Insight Partners와 함께할 수 있기를 기대합니다.
치지오케 박사 오니아 전무이사, 파인크레스트 헬스케어 유한회사구매 이유
- 정보에 기반한 의사 결정
- 시장 역학 이해
- 경쟁 분석
- 고객 인사이트
- 시장 예측
- 위험 완화
- 전략 기획
- 투자 타당성 분석
- 신흥 시장 파악
- 마케팅 전략 강화
- 운영 효율성 향상
- 규제 동향에 발맞춰 대응


 무료 샘플 받기 - 전자 및 반도체 시장 지출 분석