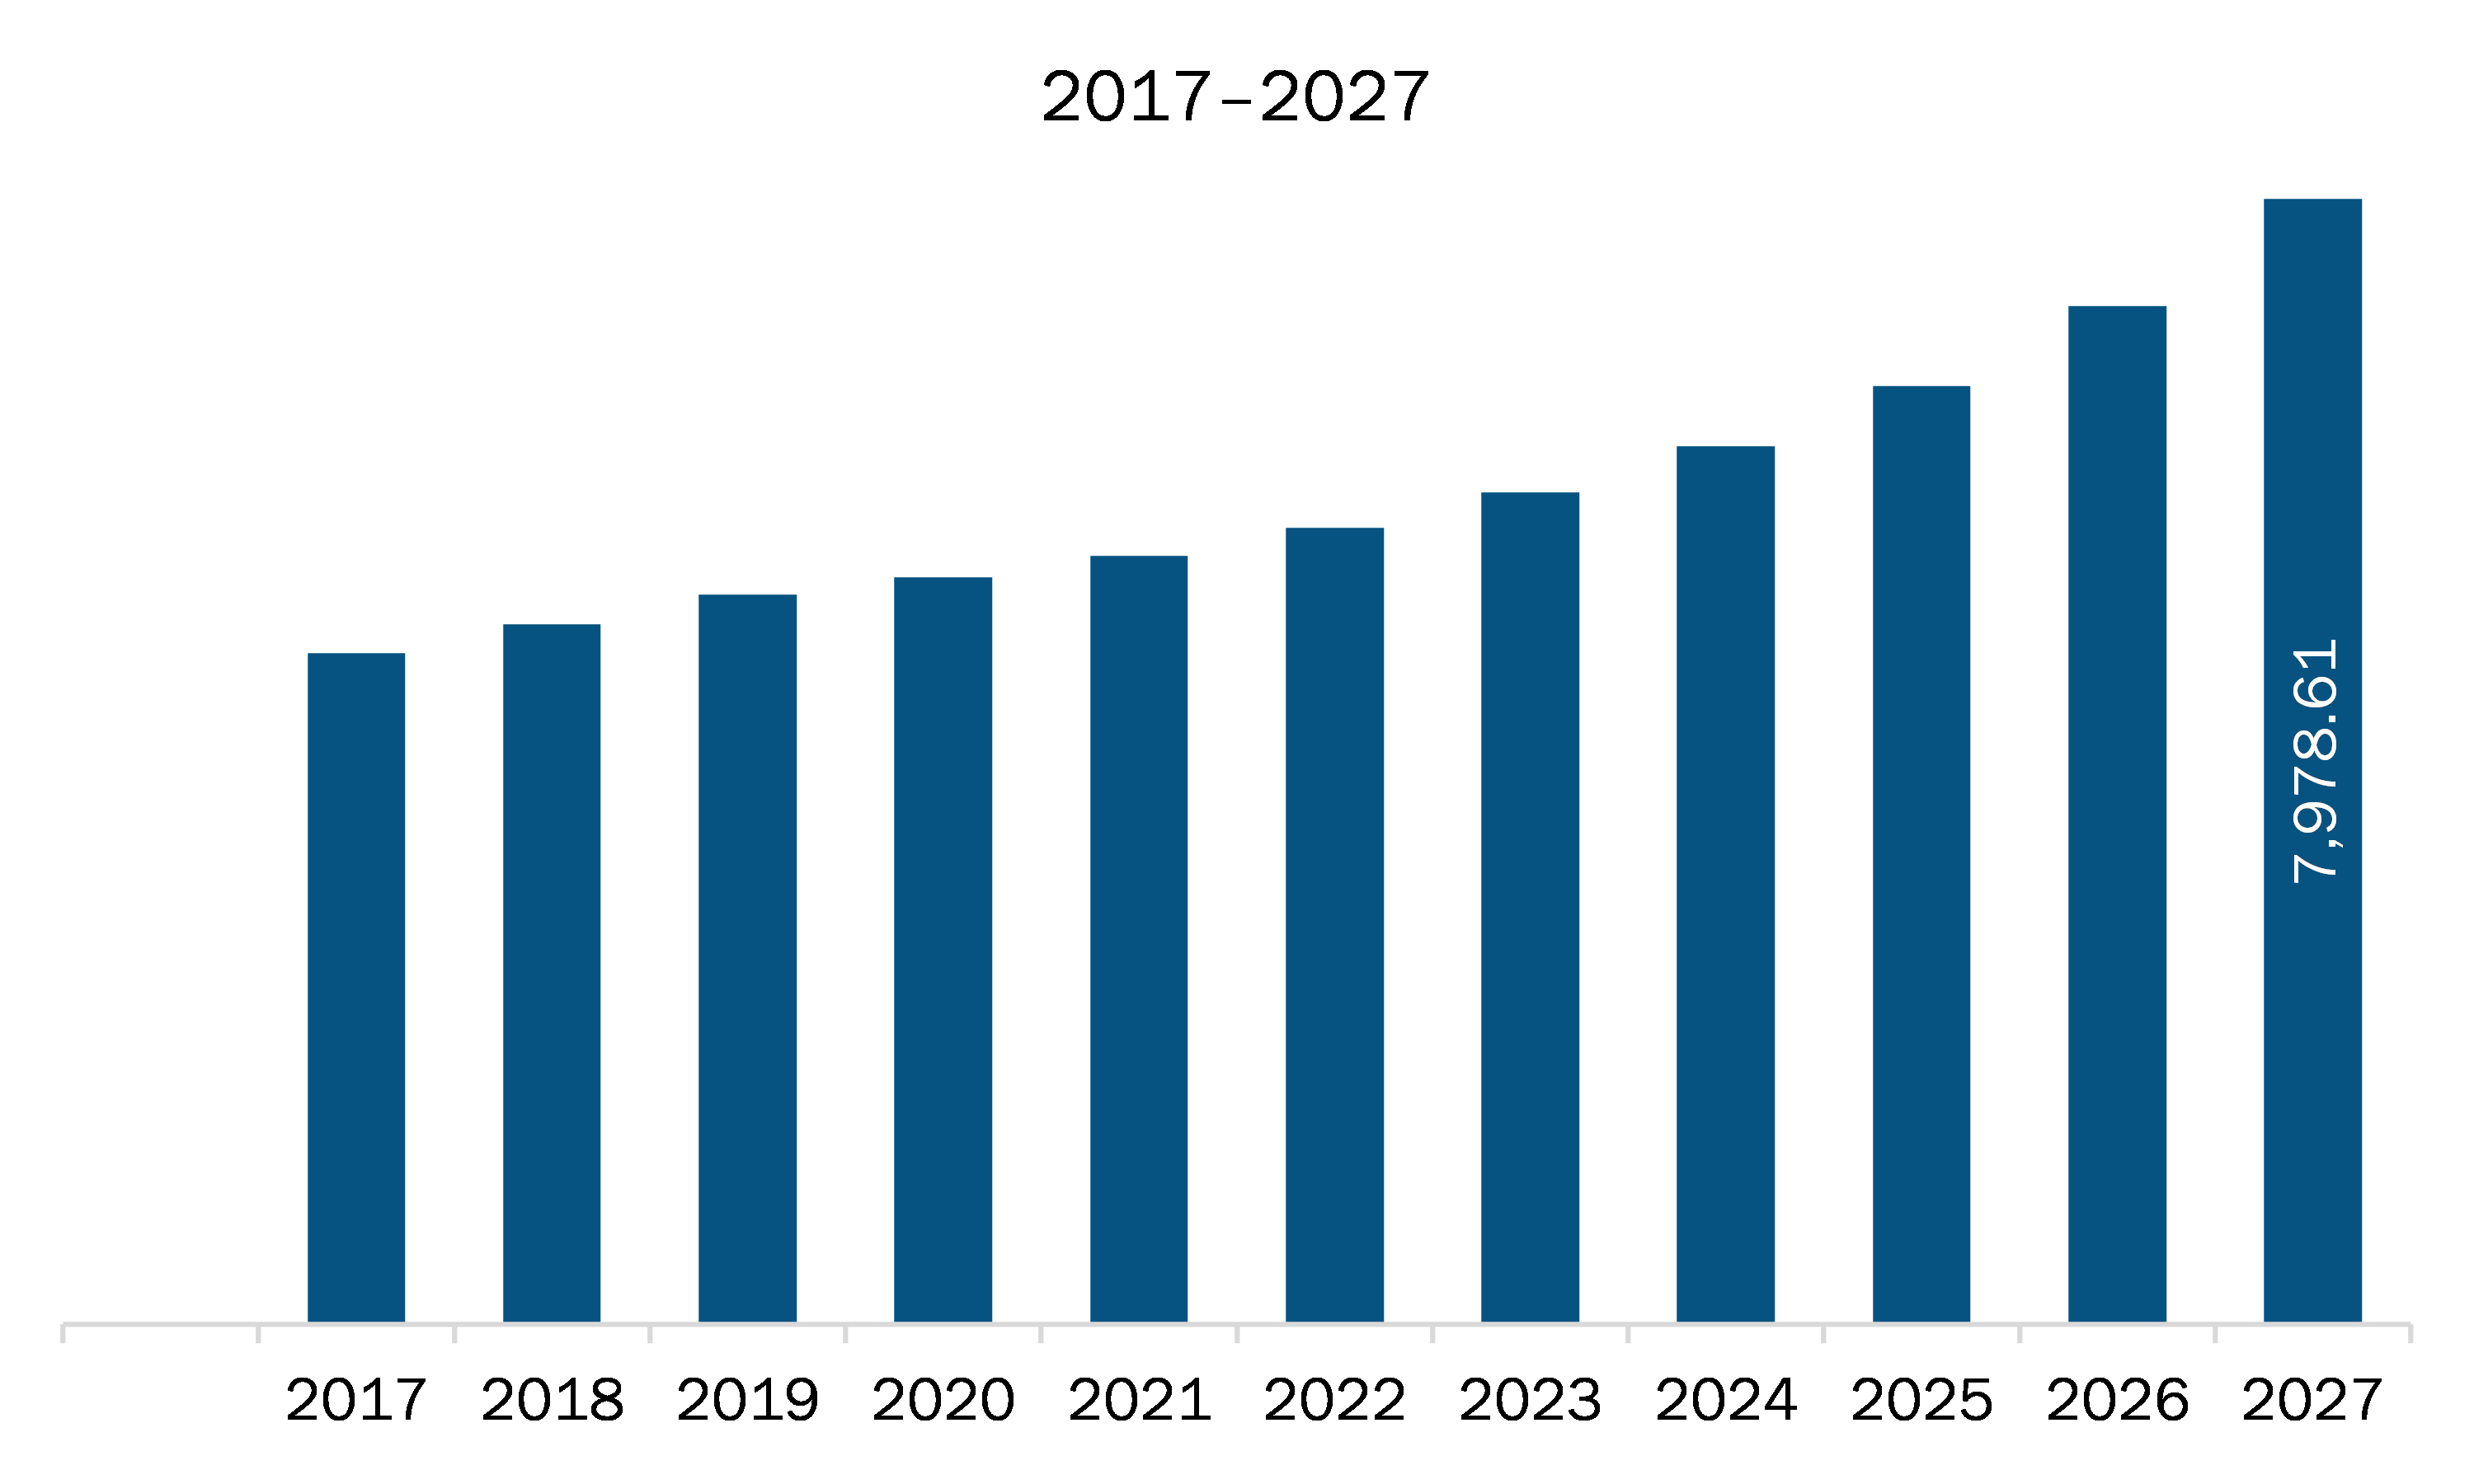
The smart retail devices market in Europe is expected to grow from US$ 5,175.76 million in 2019 to US$ 7,978.61 million by 2027; it is estimated to grow at a CAGR of 6.0% from 2020 to 2027.
The UK, Germany, France, Italy, Russia, rest of Europe are major economies in Europe. Animatronics and robotics usage increasing is the major factor driving the Europe smart retail devices market. Animatronics is the process of manufacturing and operating lifelike robots that are used for entertainment or films, whereas robotics is the process of designing, constructing, and operating robots. Robots offer enhanced services such as data collection for understanding customer behavior, personalized services, and improved in-store services, and enhanced logistics and delivery of goods. Furthermore, the growing adoption of robots by prominent retail chains such as Walmart is expected to drive the growth of the market. For example, in January 2020, Walmart introduced its robot named Alphabot. The system can pick and pack orders 10 times faster than human packs. The increasing competition in the retail industry is encouraging large enterprises such as Amazon, Walmart, and Kroger to invest in smart technologies such as robots to understand customer behavior, offer enhanced shopping experience, ensure better inventory management, and reduce logistics and delivery time. Therefore, the growing adoption of robots and animatronics to provide enhanced shopping experience to customers is driving the growth of the Europe smart retail devices market
Spain, Italy, Germany, the UK, and France are some of the worst affected member states in the European region due to the COVID-19 outbreak. Businesses in the region are facing severe economic difficulties as they had to either suspend their operations or substantially reduce their activities. Owing to business shutdowns, travel bans, and supply chain disruptions, the region faced an economic slowdown in 2020, which is most likely continue in 2021 as well. Italy, Spain, and Germany have implemented drastic measures and travel restrictions to limit the spread of coronavirus among its citizens. European countries represent a significant market for smart retail devices, owing to the high purchasing power of individual customers and booming retail industry. However, due to the COVID-19 outbreak, the retail sector has seen a sharp decline in the European countries. The retail and transportation & logistics industries are expected to be under stress in 2021, and they will require time to stabilize. All these factors are expected to impact smart retail devices market growth in European countries. The markets in Italy, Spain, Germany, the UK, and France are anticipated to see negative impact in 2021.
With the new features and technologies, vendors can attract new customers and expand their footprints in emerging markets. This factor is likely to drive the Europe smart retail devices market. The Europe smart retail devices market is expected to grow at a good CAGR during the forecast period.
- Sample PDF showcases the content structure and the nature of the information with qualitative and quantitative analysis.
- Request discounts available for Start-Ups & Universities
Europe Smart Retail Devices Market Segmentation
- Sample PDF showcases the content structure and the nature of the information with qualitative and quantitative analysis.
- Request discounts available for Start-Ups & Universities
Europe Smart Retail Devices Market – By Technology
- Digital Signage
- Smart Labels
- Smart Payments
- Smart Carts
- Others
Europe Smart Retail Devices Market – By Application
- Predictive Equipment Maintenance
- Inventory Management
- Smart Fitting Room
- Foot Traffic Monitoring
- Others
Europe Smart Retail Devices Market, by Country
- UK
- Germany
- France
- Italy
- Russia
- Rest of Europe
Europe Smart Retail Devices Market - Companies Mentioned
- Intel Corporation
- LG Electronics
- Nvidia Corporation
- Panasonic Corporation
- Samsung Group
- Zebra Technologies Corporation

Report Coverage
Revenue forecast, Company Analysis, Industry landscape, Growth factors, and Trends

Segment Covered
Technology, and Application

Regional Scope
North America, Europe, Asia Pacific, Middle East & Africa, South & Central America

Country Scope
UK, Germany, France, Italy, Russia
1. Introduction
1.1 Study Scope
1.2 The Insight Partners Research Report Guidance
1.3 Market Segmentation
2. Key Takeaways
3. Research Methodology
3.1 Coverage
3.2 Secondary Research
3.3 Primary Research
4. Europe Smart Retail Devices Market Landscape
4.1 Market Overview
4.2 Europe PEST Analysis
4.3 Ecosystem Analysis
4.4 Expert Opinions
5. Europe Smart Retail Devices Market – Key Market Dynamics
5.1 Market Drivers
5.1.1 Smart Transportation at High Demand
5.1.2 Animatronics and Robotics Usage Increasing
5.2 Market Restraints
5.2.1 Development and Maintenance of Smart Retail Devices are Costly
5.3 Market Opportunities
5.3.1 Surge in Demand for Smart Retail and Transportation & Logistics
5.4 Future Trends
5.4.1 Blockchain Technology Leveraging Smart Payments
5.5 Impact Analysis of Drivers and Restraints
6. Smart Retail Devices Market – Europe Analysis
6.1 Overview
6.2 Europe Smart Retail Devices Market – Revenue and Forecast to 2027 (US$ Million)
7. Europe Smart Retail Devices Market Analysis, by Technology
7.1 Overview
7.2 Europe Smart Retail Devices Market, by Technology (2019 and 2027)
7.3 Digital Signage
7.3.1 Overview
7.3.2 Digital Signage: Smart Retail Devices Market Revenue and Forecast to 2027 (US$ Million)
7.4 Smart Labels
7.4.1 Overview
7.4.2 Smart Labels: Smart Retail Devices Market Revenue and Forecast to 2027 (US$ Million)
7.5 Smart Payments
7.5.1 Overview
7.5.2 Smart Payments: Smart Retail Devices Market Revenue and Forecast to 2027 (US$ Million)
7.6 Smart Carts
7.6.1 Overview
7.6.2 Smart Carts: Smart Retail Devices Market Revenue and Forecast to 2027 (US$ Million)
7.7 Others
7.7.1 Overview
7.7.2 Others: Smart Retail Devices Market Revenue and Forecast to 2027 (US$ Million)
8. Europe Smart Retail Devices Market, by Application
8.1 Overview
8.2 Europe Smart Retail Devices Market, by Application (2019 and 2027)
8.3 Predictive Equipment Maintenance
8.3.1 Overview
8.3.2 Predictive Equipment Maintenance: Smart Retail Devices Market Revenue and Forecast to 2027 (US$ Million)
8.4 Inventory Management
8.4.1 Overview
8.4.2 Inventory Management: Smart Retail Devices Market Revenue and Forecast to 2027 (US$ Million)
8.5 Smart Fitting Rooms
8.5.1 Overview
8.5.2 Smart Fitting Room: Smart Retail Devices Market Revenue and Forecast to 2027 (US$ Million)
8.6 Foot Traffic Monitoring
8.6.1 Overview
8.6.2 Foot Traffic Monitoring: Smart Retail Devices Market Revenue and Forecast to 2027 (US$ Million)
8.7 Others
8.7.1 Overview
8.7.2 Others: Smart Retail Devices Market Revenue and Forecast to 2027 (US$ Million)
9. Europe Smart Retail Devices Market – Country Analysis
9.1 Overview
9.1.1 Europe: Smart Retail Devices Market, By Key Country
9.1.1.1 UK: Smart Retail Devices Market – Revenue and Forecast to 2027 (US$ Million)
9.1.1.1.1 UK: Smart Retail Devices Market, By Technology
9.1.1.1.2 UK: Smart Retail Devices Market, By Application
9.1.1.2 Germany: Smart Retail Devices Market – Revenue and Forecast to 2027 (US$ Million)
9.1.1.2.1 Germany: Smart Retail Devices Market, By Technology
9.1.1.2.2 Germany: Smart Retail Devices Market, By Application
9.1.1.3 France: Smart Retail Devices Market – Revenue and Forecast to 2027 (US$ Million)
9.1.1.3.1 France: Smart Retail Devices Market, By Technology
9.1.1.3.2 France: Smart Retail Devices Market, By Application
9.1.1.4 Italy: Smart Retail Devices Market – Revenue and Forecast to 2027 (US$ Million)
9.1.1.4.1 Italy: Smart Retail Devices Market, By Technology
9.1.1.4.2 Italy: Smart Retail Devices Market, By Application
9.1.1.5 Russia: Smart Retail Devices Market – Revenue and Forecast to 2027 (US$ Million)
9.1.1.5.1 Russia: Smart Retail Devices Market, By Technology
9.1.1.5.2 Russia: Smart Retail Devices Market, By Application
9.1.1.6 Rest of Europe: Smart Retail Devices Market – Revenue and Forecast to 2027 (US$ Million)
9.1.1.6.1 Rest of Europe: Smart Retail Devices Market, By Technology
9.1.1.6.2 Rest of Europe: Smart Retail Devices Market, By Application
10. Impact of COVID-19 Pandemic
10.1 Europe
11. Industry Landscape
11.1 Overview
11.2 Market Initiative
11.3 New Product Development
11.4 Partnership
12. COMPANY PROFILES
12.1 Intel Corporation
12.1.1 Key Facts
12.1.2 Business Description
12.1.3 Products and Services
12.1.4 Financial Overview
12.1.5 SWOT Analysis
12.1.6 Key Developments
12.2 Samsung Group
12.2.1 Key Facts
12.2.2 Business Description
12.2.3 Products and Services
12.2.4 Financial Overview
12.2.5 SWOT Analysis
12.2.6 Key Developments
12.3 NVIDIA CORPORATION
12.3.1 Key Facts
12.3.2 Business Description
12.3.3 Products and Services
12.3.4 Financial Overview
12.3.5 SWOT Analysis
12.3.6 Key Developments
12.4 LG Electronics
12.4.1 Key Facts
12.4.2 Business Description
12.4.3 Products and Services
12.4.4 Financial Overview
12.4.5 SWOT Analysis
12.4.6 Key Developments
12.5 Zebra Technologies Corporation
12.5.1 Key Facts
12.5.2 Business Description
12.5.3 Products and Services
12.5.4 Financial Overview
12.5.5 SWOT Analysis
12.5.6 Key Developments
12.6 Panasonic Corporation
12.6.1 Key Facts
12.6.2 Business Description
12.6.3 Products and Services
12.6.4 Financial Overview
12.6.5 SWOT Analysis
12.6.6 Key Developments
12.7 Diebold Nixdorf, Incorporated
12.7.1 Key Facts
12.7.2 Business Description
12.7.3 Products and Services
12.7.4 Financial Overview
12.7.5 SWOT Analysis
12.7.6 Key Developments
13. Appendix
13.1 About The Insight Partners
13.2 Word Index
LIST OF TABLES
Table 1. Europe Smart Retail Devices Market – Revenue, and Forecast to 2027 (US$ Million)
Table 2. Europe Smart Retail Devices Market, By Country – Revenue and Forecast to 2027 (USD Million)
Table 3. UK: Smart Retail Devices Market, By Technology –Revenue and Forecast to 2027 (US$ Million)
Table 4. UK: Smart Retail Devices Market, By Application –Revenue and Forecast to 2027 (US$ Million)
Table 5. Germany: Smart Retail Devices Market, By Technology –Revenue and Forecast to 2027 (US$ Million)
Table 6. Germany: Smart Retail Devices Market, By Application –Revenue and Forecast to 2027 (US$ Million)
Table 7. France: Smart Retail Devices Market, By Technology –Revenue and Forecast to 2027 (US$ Million)
Table 8. France: Smart Retail Devices Market, By Application –Revenue and Forecast to 2027 (US$ Million)
Table 9. Italy: Smart Retail Devices Market, By Technology –Revenue and Forecast to 2027 (US$ Million)
Table 10. Italy: Smart Retail Devices Market, By Application –Revenue and Forecast to 2027 (US$ Million)
Table 11. Russia: Smart Retail Devices Market, By Technology –Revenue and Forecast to 2027 (US$ Million)
Table 12. Russia: Smart Retail Devices Market, By Application –Revenue and Forecast to 2027 (US$ Million)
Table 13. Rest of Europe: Smart Retail Devices Market, By Technology –Revenue and Forecast to 2027 (US$ Million)
Table 14. Rest of Europe: Smart Retail Devices Market, By Application –Revenue and Forecast to 2027 (US$ Million)
Table 15. List of Abbreviation
LIST OF FIGURES
Figure 1. Europe Smart Retail Devices Market Segmentation
Figure 2. Europe Smart Retail Devices Market Segmentation – By Country
Figure 3. Europe Smart Retail Devices Market Overview
Figure 4. Europe Smart Retail Devices Market, By Technology
Figure 5. Europe Smart Retail Devices Market, By Application
Figure 6. Europe Smart Retail Devices Market, by Country
Figure 7. Europe – PEST Analysis
Figure 8. Europe Smart Retail Devices Market: Ecosystem Analysis
Figure 9. Europe Smart Retail Devices Market: Impact Analysis of Drivers and Restraints
Figure 10. Europe Smart Retail Devices Market – Revenue and Forecast to 2027 (US$ Million)
Figure 11. Europe Smart Retail Devices Market Revenue Share, by Technology (2019 and 2027)
Figure 12. Europe Digital Signage: Smart Retail Devices Market Revenue and Forecast to 2027 (US$ Million)
Figure 13. Europe Smart Labels: Smart Retail Devices Market Revenue and Forecast to 2027 (US$ Million)
Figure 14. Europe Smart Payments: Smart Retail Devices Market Revenue and Forecast to 2027 (US$ Million)
Figure 15. Europe Smart Carts: Smart Retail Devices Market Revenue and Forecast to 2027 (US$ Million)
Figure 16. Europe Others: Smart Retail Devices Market Revenue and Forecast to 2027 (US$ Million)
Figure 17. Europe Smart Retail Devices Market Revenue Share, by Application (2019 and 2027)
Figure 18. Europe Predictive Equipment Maintenance: Smart Retail Devices Market Revenue and Forecast to 2027 (US$ Million)
Figure 19. Europe Inventory Management: Smart Retail Devices Market Revenue and Forecast to 2027 (US$ Million)
Figure 20. Europe Smart Fitting Room: Smart Retail Devices Market Revenue and Forecast to 2027 (US$ Million)
Figure 21. Europe Foot Traffic Monitoring: Smart Retail Devices Market Revenue and Forecast to 2027 (US$ Million)
Figure 22. Europe Others: Smart Retail Devices Market Revenue and Forecast to 2027 (US$ Million)
Figure 23. Europe: Smart Retail Devices Market, By Key County - Revenue (2019) (USD Million)
Figure 24. Europe: Smart Retail Devices Market Revenue Share, By Key Country (2020 & 2027)
Figure 25. UK: Smart Retail Devices Market – Revenue and Forecast to 2027 (US$ Million)
Figure 26. Germany: Smart Retail Devices Market – Revenue and Forecast to 2027 (US$ Million)
Figure 27. France: Smart Retail Devices Market – Revenue and Forecast to 2027 (US$ Million)
Figure 28. Italy: Smart Retail Devices Market – Revenue and Forecast to 2027 (US$ Million)
Figure 29. Russia: Smart Retail Devices Market – Revenue and Forecast to 2027 (US$ Million)
Figure 30. Rest of Europe: Smart Retail Devices Market – Revenue and Forecast to 2027 (US$ Million)
Figure 31. Impact of COVID-19 Pandemic in Europe Country Markets
- Intel Corporation
- LG Electronics
- Nvidia Corporation
- Panasonic Corporation
- Samsung Group
- Zebra Technologies Corporation
The Insight Partners performs research in 4 major stages: Data Collection & Secondary Research, Primary Research, Data Analysis and Data Triangulation & Final Review.
- Data Collection and Secondary Research:
As a market research and consulting firm operating from a decade, we have published many reports and advised several clients across the globe. First step for any study will start with an assessment of currently available data and insights from existing reports. Further, historical and current market information is collected from Investor Presentations, Annual Reports, SEC Filings, etc., and other information related to company’s performance and market positioning are gathered from Paid Databases (Factiva, Hoovers, and Reuters) and various other publications available in public domain.
Several associations trade associates, technical forums, institutes, societies and organizations are accessed to gain technical as well as market related insights through their publications such as research papers, blogs and press releases related to the studies are referred to get cues about the market. Further, white papers, journals, magazines, and other news articles published in the last 3 years are scrutinized and analyzed to understand the current market trends.
- Primary Research:
The primarily interview analysis comprise of data obtained from industry participants interview and answers to survey questions gathered by in-house primary team.
For primary research, interviews are conducted with industry experts/CEOs/Marketing Managers/Sales Managers/VPs/Subject Matter Experts from both demand and supply side to get a 360-degree view of the market. The primary team conducts several interviews based on the complexity of the markets to understand the various market trends and dynamics which makes research more credible and precise.
A typical research interview fulfils the following functions:
- Provides first-hand information on the market size, market trends, growth trends, competitive landscape, and outlook
- Validates and strengthens in-house secondary research findings
- Develops the analysis team’s expertise and market understanding
Primary research involves email interactions and telephone interviews for each market, category, segment, and sub-segment across geographies. The participants who typically take part in such a process include, but are not limited to:
- Industry participants: VPs, business development managers, market intelligence managers and national sales managers
- Outside experts: Valuation experts, research analysts and key opinion leaders specializing in the electronics and semiconductor industry.
Below is the breakup of our primary respondents by company, designation, and region:

Once we receive the confirmation from primary research sources or primary respondents, we finalize the base year market estimation and forecast the data as per the macroeconomic and microeconomic factors assessed during data collection.
- Data Analysis:
Once data is validated through both secondary as well as primary respondents, we finalize the market estimations by hypothesis formulation and factor analysis at regional and country level.
- 3.1 Macro-Economic Factor Analysis:
We analyse macroeconomic indicators such the gross domestic product (GDP), increase in the demand for goods and services across industries, technological advancement, regional economic growth, governmental policies, the influence of COVID-19, PEST analysis, and other aspects. This analysis aids in setting benchmarks for various nations/regions and approximating market splits. Additionally, the general trend of the aforementioned components aid in determining the market's development possibilities.
- 3.2 Country Level Data:
Various factors that are especially aligned to the country are taken into account to determine the market size for a certain area and country, including the presence of vendors, such as headquarters and offices, the country's GDP, demand patterns, and industry growth. To comprehend the market dynamics for the nation, a number of growth variables, inhibitors, application areas, and current market trends are researched. The aforementioned elements aid in determining the country's overall market's growth potential.
- 3.3 Company Profile:
The “Table of Contents” is formulated by listing and analyzing more than 25 - 30 companies operating in the market ecosystem across geographies. However, we profile only 10 companies as a standard practice in our syndicate reports. These 10 companies comprise leading, emerging, and regional players. Nonetheless, our analysis is not restricted to the 10 listed companies, we also analyze other companies present in the market to develop a holistic view and understand the prevailing trends. The “Company Profiles” section in the report covers key facts, business description, products & services, financial information, SWOT analysis, and key developments. The financial information presented is extracted from the annual reports and official documents of the publicly listed companies. Upon collecting the information for the sections of respective companies, we verify them via various primary sources and then compile the data in respective company profiles. The company level information helps us in deriving the base number as well as in forecasting the market size.
- 3.4 Developing Base Number:
Aggregation of sales statistics (2020-2022) and macro-economic factor, and other secondary and primary research insights are utilized to arrive at base number and related market shares for 2022. The data gaps are identified in this step and relevant market data is analyzed, collected from paid primary interviews or databases. On finalizing the base year market size, forecasts are developed on the basis of macro-economic, industry and market growth factors and company level analysis.
- Data Triangulation and Final Review:
The market findings and base year market size calculations are validated from supply as well as demand side. Demand side validations are based on macro-economic factor analysis and benchmarks for respective regions and countries. In case of supply side validations, revenues of major companies are estimated (in case not available) based on industry benchmark, approximate number of employees, product portfolio, and primary interviews revenues are gathered. Further revenue from target product/service segment is assessed to avoid overshooting of market statistics. In case of heavy deviations between supply and demand side values, all thes steps are repeated to achieve synchronization.
We follow an iterative model, wherein we share our research findings with Subject Matter Experts (SME’s) and Key Opinion Leaders (KOLs) until consensus view of the market is not formulated – this model negates any drastic deviation in the opinions of experts. Only validated and universally acceptable research findings are quoted in our reports.
We have important check points that we use to validate our research findings – which we call – data triangulation, where we validate the information, we generate from secondary sources with primary interviews and then we re-validate with our internal data bases and Subject matter experts. This comprehensive model enables us to deliver high quality, reliable data in shortest possible time.
 Get Free Sample For