
2031 年 AR 波导市场报告(按细分市场、地域、动态、最新发展和战略洞察)
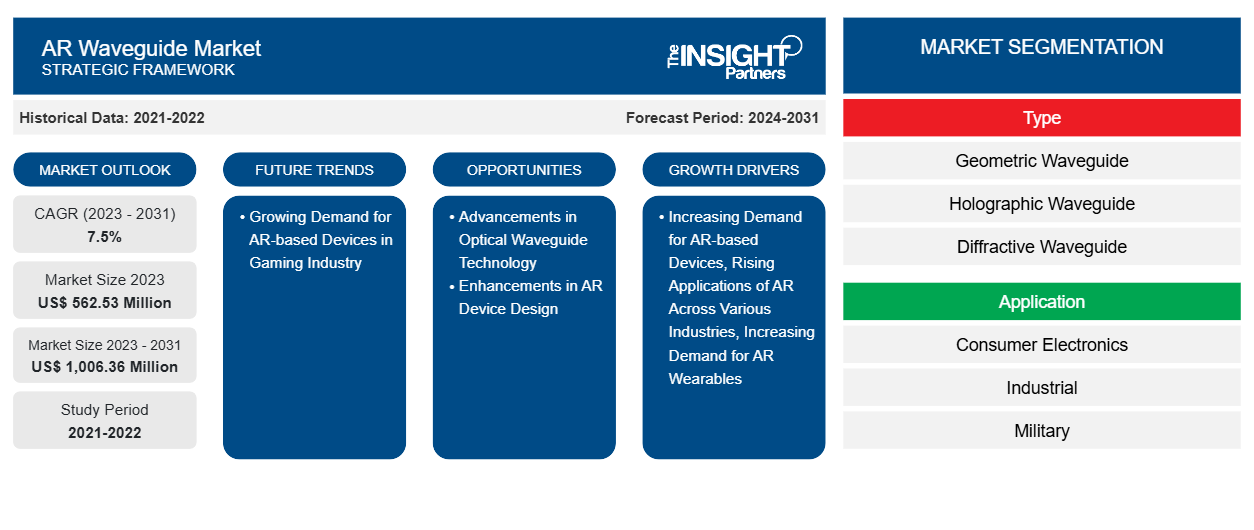
AR 波导市场规模和预测(2021-2031 年)、全球和区域份额、趋势和增长机会分析报告覆盖范围:按类型(几何波导、全息波导和衍射波导)、应用(消费电子、工业、军事和其他)和地理
- 状态 : 已发布
- 报告代码 : TIPRE00016956
- 类别 : 电子和半导体
- 页数 : 144
- 可用报告格式 :


- 最后更新日期 : June 14, 2024

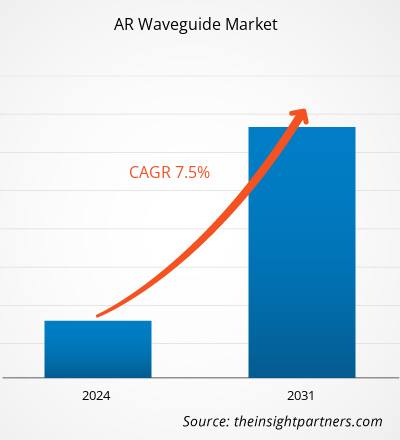
2023 年 AR 波导市场规模价值 5.6253 亿美元,预计到 2031 年将达到 10.0636 亿美元;预计 2023 年至 2031 年的复合年增长率为 7.5%。
报告根据当前AR 波导市场趋势和影响市场增长的驱动因素,介绍了增长前景。一些市场趋势包括技术进步和对 AR 可穿戴设备的需求不断增长。
AR波导市场分析
全球 AR 波导市场的收入正在经历显著增长,这得益于各行各业对增强现实 ( AR ) 应用的需求不断增长。AR 波导提供无缝且身临其境的 AR 体验,增强了用户与现实世界中数字内容的参与度和互动。在游戏和娱乐行业,AR 波导为用户提供了新颖且刺激的与内容互动的方式。通过在现实世界中叠加数字元素,AR 游戏提供了高效的视觉效果、图形和声音,为参与者创造了身临其境的体验。
AR波导市场概览
AR波导市场是一种尖端技术,有可能彻底改变各个商业领域使用增强现实 (AR) 的体验。它是一种透明的光学元件,可引导虚拟图像并将其投射到现实世界,增强用户的视觉感知并提供无缝的 AR 体验。AR波导具有巨大的潜力,可以改变众多行业,包括制造业、零售业、医疗保健和教育业。该技术的主要优势之一是它能够将数字信息叠加到物理环境中,为用户提供实时数据和上下文信息,从而显著增强他们的决策过程。此外,AR波导结合了透明显示系统,可将计算机生成的视觉效果叠加到物理环境中。通过利用全内反射原理,波导可以有效地引导光线,从而在观看者眼前创建虚拟图像。
AR 波导市场驱动因素和机遇
AR 可穿戴设备需求增长,利于市场增长
全球范围内对智能眼镜和耳机等 AR 可穿戴设备的需求正在增长。配备波导技术的 AR 可穿戴设备为用户提供免提和沉浸式 AR 体验,使其成为消费电子、工业和军事等各个行业广泛使用的产品。基于 AR 的解决方案提供沉浸式体验,这是支持技术和电子商务企业采用此类解决方案的关键功能。
尤其是 AR 眼镜,它在帮助人们做出明智的购买决定方面发挥着关键作用,促进了眼镜和太阳镜的销售。例如,Lenskart Solutions Pvt Ltd. 已将增强现实 (AR) 技术集成到其智能手机应用程序中,让用户可以在购买前虚拟试戴眼镜、太阳镜和其他产品。同样,LG Corporation 在其电子产品网站上整合了 AR 功能,让客户能够使用移动设备直观地看到特定电视机在家中的摆放方式,从而帮助客户做出决策。因此,对 AR 可穿戴设备的需求不断增长推动了 AR 波导市场的发展。
定制此报告以满足您的需求
您可以免费定制任何报告,包括本报告的部分内容、国家级分析、Excel 数据包,以及为初创企业和大学提供优惠和折扣
AR 波导市场:战略洞察
-
获取此报告的关键市场趋势。这个免费样品将包括数据分析,从市场趋势到估计和预测。
光波导技术的进步
光波导技术的一些进步包括衍射波导和全息波导。这些技术在汽车、医疗保健、航空航天和国防、教育和零售等各个领域的 AR 设备部署中发挥着关键作用。衍射波导被认为是最常用的 AR 组合器技术,并用于 Microsoft HoloLens、Magic Leap One 和 Vuzix M4000 等流行设备。这些波导使用衍射光学元件 (DOE) 将光注入波导,将其分配到大出射光瞳,并将其提取到眼睛。它们提供符合人体工程学的设计和高质量的投影图像,有助于提供身临其境的 AR 体验。例如,2023 年 6 月,Apple 在其年度全球开发者大会 (WWDC) 上宣布了增强现实 (AR) 耳机 Vision Pro。该耳机具有超过 2300 万像素的高分辨率显示屏,超过了 4K 电视的质量。它由苹果的 M2 芯片驱动,该芯片也用于 MacBook 笔记本电脑,以及专为耳机设计的新芯片 R1。R1芯片处理大量相关数据,包括来自 12 个摄像头和面向用户眼睛的传感器的输入。这种设计旨在减少延迟并最大限度地减少晕动症。Vision Pro 插电后可以全天使用,但无线使用时电池寿命限制为两小时。
AR 波导市场报告细分分析
有助于得出 AR 波导市场分析的关键部分是类型、应用和地理位置。
- 根据类型,市场分为几何波导、全息波导和衍射波导。几何波导部分在 2023 年占据了最大的市场份额。
- 几何波导是一种光学元件,可将来自显示源(例如微显示器)的光线引导至观看者的眼睛,同时还允许他们看到外部环境。它是 AR 眼镜的关键组件,使眼镜能够将数字信息叠加到用户的视野中,而不会妨碍他们对物理环境的视觉。几何光波导采用传统几何光学概念和工艺进行设计和制造,无需涉及微或纳米级结构。因此,图像质量(包括颜色和对比度)可以得到显着改善。几何波导因其广泛的应用而在微型轻量级 AR 眼镜的开发中发挥着重要作用。
- 根据最终用户,主板管理软件市场细分为消费电子、工业、军事和其他。消费电子领域在 2023 年占据了最大的市场份额。
AR 波导市场份额(按地区)分析
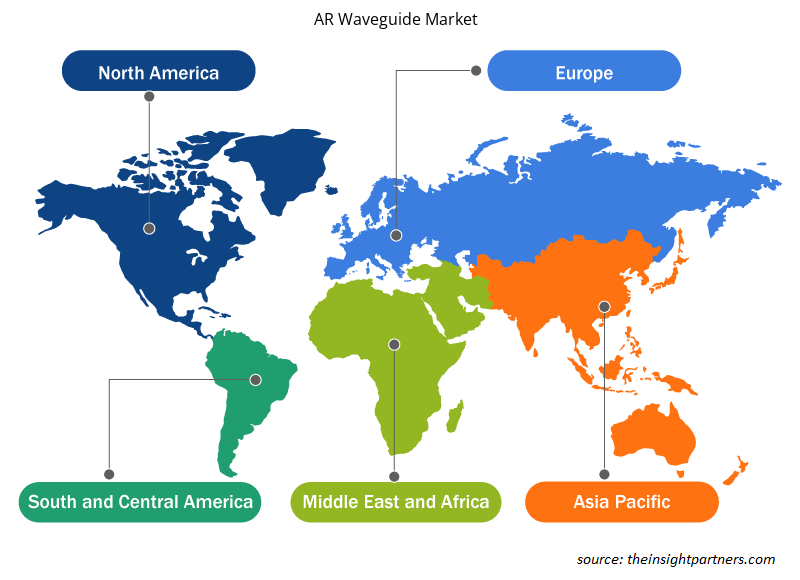
AR 波导市场报告的地理范围主要分为五个区域:北美、亚太、欧洲、中东和非洲、南美和中美。
- 欧洲 AR 波导市场细分为德国、法国、意大利、英国、俄罗斯和欧洲其他地区。欧洲以其强大的技术和高质量的制造而闻名,这极大地促进了 AR 设备的使用。欧洲各地的各个委员会都已授予批量生产高质量 AR 波导的合同。例如,2023 年 6 月,Morphotonics 获得了欧洲创新委员会 (EIC) 加速器资助。EIC 加速器支持中小企业开发和扩大创新。此外,欧洲还有多家知名的 AR 波导制造商;这些参与者包括 Waveoptics、Lumus、LetinAR、Holoptics、Optinvent 和 Goertek。
- 在欧洲,各种会议都召开了,首席产品官在会上解释了 AR 及其应用的好处。2022 年欧洲 AWE 大会以波导技术为主题,重点突出了欧洲的行业兴趣。Dispelix 首席产品官简要介绍了 Dispelix DPX Selva 产品线以及衍射波导技术如何集成以推出利用 AR 单层和全彩轻量波导的解决方案,并讨论了 LED 和 LBS AR 波导解决方案及其优势。因此,该地区的此类举措推动了 AR 波导市场的增长。
AR 波导市场区域洞察
Insight Partners 的分析师已详细解释了预测期内影响 AR 波导市场的区域趋势和因素。本节还讨论了北美、欧洲、亚太地区、中东和非洲以及南美和中美洲的 AR 波导市场细分和地理位置。
- 获取 AR 波导市场的区域特定数据
AR 波导市场报告范围
| 报告属性 | 细节 |
|---|---|
| 2023 年的市场规模 | 5.6253亿美元 |
| 2031 年市场规模 | 10.0636亿美元 |
| 全球复合年增长率(2023 - 2031) | 7.5% |
| 史料 | 2021-2022 |
| 预测期 | 2024-2031 |
| 涵盖的领域 |
按类型
|
| 覆盖地区和国家 |
北美
|
| 市场领导者和主要公司简介 |
|
市场参与者密度:了解其对商业动态的影响
由于消费者偏好的不断变化、技术进步以及对产品优势的认识不断提高等因素,最终用户需求不断增加,推动了 AR 波导市场快速增长。随着需求的增加,企业正在扩大其产品范围,进行创新以满足消费者需求,并利用新兴趋势,从而进一步推动市场增长。
市场参与者密度是指在特定市场或行业内运营的企业或公司的分布情况。它表明相对于给定市场空间的规模或总市场价值,有多少竞争对手(市场参与者)存在于该市场空间中。
在 AR 波导市场运营的主要公司有:
- 水晶光电
- DigiLens 公司
- 驱散
- 歌尔
- 鲁默斯
免责声明:上面列出的公司没有按照任何特定顺序排列。
- 获取 AR 波导市场顶级关键参与者概览
AR 波导市场新闻和最新发展
通过收集一手和二手研究后的定性和定量数据来评估 AR 波导市场,其中包括重要的公司出版物、协会数据和数据库。以下是 AR 波导市场的发展列表:
- 2022 年,Lochn Optics 在全息波导自动化曝光和全彩显示技术方面取得突破。(来源:Azeus Convene,新闻稿,2022 年)
- 2022 年,Lochn Optics 发布了 LBS 衍射波导 AR 模块。自 2021 年中期以来,Lochn Optics 在意法半导体的全力支持下开发了适合该技术的定制衍射波导和工艺。(来源:Azeus Convene,新闻稿,2022 年)
- 2024 年,LetinAR Inc. 推出了“PinTILT”镜头,将 AR 光学技术提升到了一个新的水平,并与其全球客户(包括 Jorjin、Nimo 等)一起实现了成功的商业化案例。该技术主要是为了解决当前产品中存在的常见缺陷,例如笨重且昂贵的硬件以及功能不足,这些缺陷阻碍了真正眼镜形设计的创造,并使可穿戴性和可用性充其量只能达到低于标准。(来源:Azeus Convene,新闻稿,2024 年)
- 2024 年,先进光学解决方案领导者 NIL Technology (NILT) 宣布推出 metaEye,这是一款基于超紧凑型超透镜的相机,可用于眼动追踪、智能锁、生物识别、SLAM 和无处不在的感知,涉及游戏、存在检测和智能家电等一系列应用。这款革命性的超透镜相机采用正在申请专利的镜头架构,只有超透镜才能实现这种架构,从而提供超紧凑的外形尺寸、良好的性能和环境稳健性。(来源:Azeus Convene,新闻稿,2024 年)
AR 波导市场报告覆盖范围和交付成果
“AR 波导市场规模和预测(2021-2031)”报告对以下领域进行了详细的市场分析:
- 范围内所有主要细分市场的全球、区域和国家层面的市场规模和预测
- 市场动态,如驱动因素、限制因素和关键机遇
- 未来主要趋势
- 详细的 PEST 和 SWOT 分析
- 全球和区域市场分析涵盖关键市场趋势、主要参与者、法规和最新市场发展
- 行业格局和竞争分析,涵盖市场集中度、热点图分析、知名参与者和最新发展
- 详细的公司简介

Naveen 是一位经验丰富的市场研究和咨询专业人士,在定制项目、联合项目和咨询项目方面拥有超过 9 年的专业经验。他目前担任副总裁,成功管理了项目价值链中的利益相关者,撰写了 100 多份研究报告和 30 多项咨询项目。他的工作涵盖工业和政府项目,为客户的成功和数据驱动的决策做出了重要贡献。
Naveen 拥有卡纳塔克邦 VTU 的电子与通信工程学位,以及马尼帕尔大学的市场营销与运营 MBA 学位。他已担任 IEEE 会员 9 年,积极参与各种会议、技术研讨会,并在分部和地区层面担任志愿者。在此之前,他曾担任 IndustryARC 的助理战略顾问和惠普(惠普全球)的工业服务器顾问。
- 全面的市场规模与预测分析
- 详细的细分市场分析
- 深入的市场动态评估
- 区域及国家级洞察
- 竞争格局与企业对标分析
- 战略性商业情报
客户评价
Insight Partners 的 SCADA 系统市场报告内容全面,对当前趋势和未来预测提供了宝贵的见解。该团队始终高度专业、响应迅速且乐于助人。我们非常满意,强烈推荐他们的服务。
兰·凯德姆 伙伴, Reali Technologies LTD我请求一份关于特定软件市场的报告,团队在几天内就完成了。报告信息非常相关,而且呈现得非常出色。之后,我请求对报告进行一些修改和补充。团队再次迅速响应,不到一周我就收到了最终报告。
让-埃尔韦·詹恩 主席, 未来分析公司我们与 Insight Partners 合作进行了一项重要的市场研究和预测。他们清晰地洞察了机遇和风险,帮助我们制定了计划。他们的研究简单易用,数据可靠,帮助我们做出了明智而自信的决策。我们强烈推荐他们。
皮尤什·纳格帕尔 高级副总裁, 远光全球Insight Partners 凭借其深厚的行业专业知识,提供了富有洞察力、结构合理的市场研究。他们的团队始终专业且响应迅速。用户友好的网站让访问行业报告变得顺畅无阻。我们强烈推荐他们可靠、高质量的研究服务。
安达幸彦 首席执行官, 深蓝有限责任公司这是我第一次从The Insight Partners购买市场报告。起初我有些犹豫,但访问了他们的网站后,我更放心地冒险购买市场报告。我对报告的质量和客户服务非常满意。我对最初的报告有一些疑问和意见,但在与他们的分析师通过电子邮件沟通了几次后,我相信这份报告可以作为我们战略规划流程的参考。非常感谢您抽出宝贵的时间,让这次体验如此愉快。我一定会向其他人推荐你们的服务,当我们需要更多市场数据时,你们将是我的首选。
约翰·铃木 总裁兼首席执行官、董事会董事, BK科技感谢您在处理我关于尼日利亚传染病体外诊断市场信息请求的过程中所展现的支持和专业精神。感谢您的耐心、指导,以及您愿意提供的折扣,最终促成了这笔交易。我期待未来与 Insight Partners 继续合作,这一切都要归功于您与我初次接触后留下的良好印象。
奇吉奥克博士 ONYIA 董事总经理, PineCrest 医疗保健有限公司购买理由
- 明智的决策
- 了解市场动态
- 竞争分析
- 客户洞察
- 市场预测
- 风险规避
- 战略规划
- 投资论证
- 识别新兴市场
- 优化营销策略
- 提升运营效率
- 顺应监管趋势


