
牙科洁牙机市场趋势及增长洞察(2034 年)
牙科洁牙机市场规模及预测(2021-2034年),全球及区域份额、趋势和增长机会分析报告涵盖范围:按产品(电动牙科洁牙机、手持式牙科洁牙机、洁牙机配件);应用(牙周病学、牙髓病学);最终用户(医院、牙科诊所);以及地域划分
- 状态 : 数据发布
- 报告代码 : TIPRE00029442
- 类别 : 生命科学
- 页数 : 150
- 可用报告格式 :


- 最后更新日期 : January 27, 2026

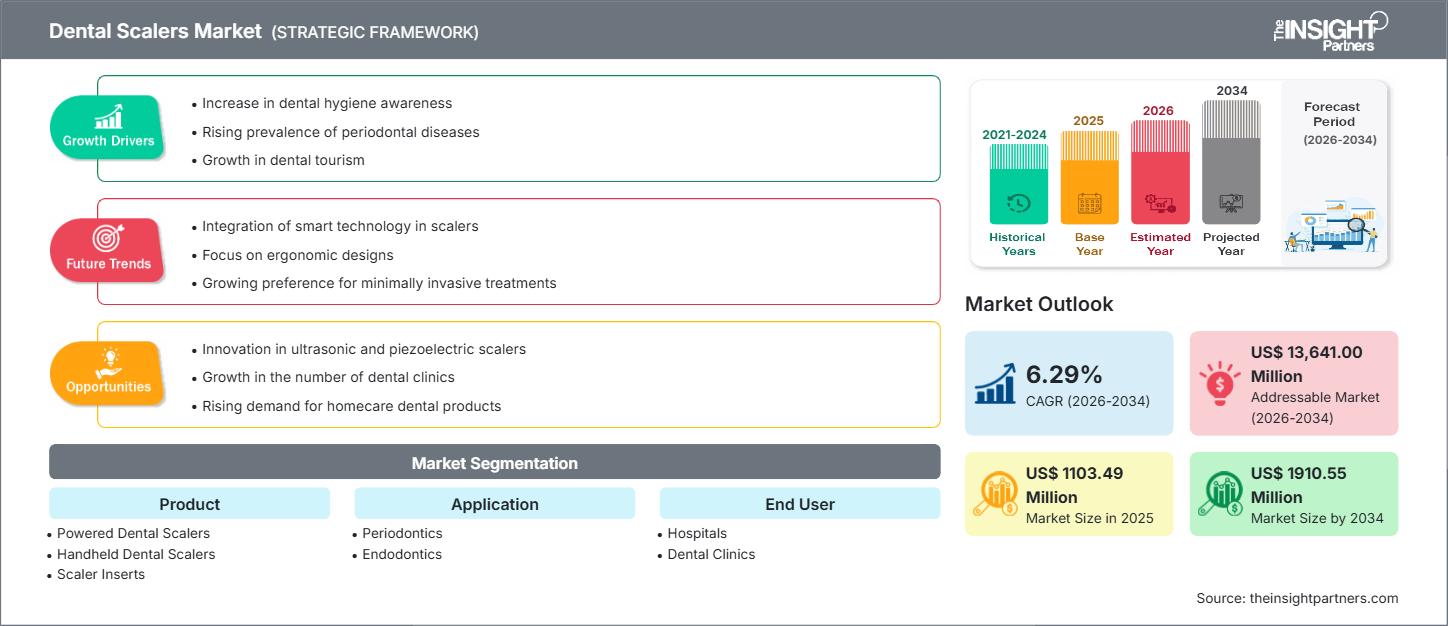
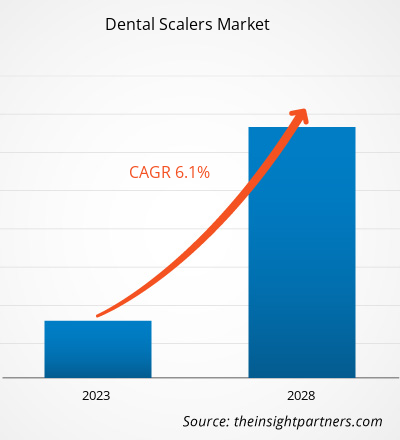
预计到2034年,牙科洁牙机市场规模将从2025年的11亿美元增长至19.1亿美元。预计2026年至2034年期间,该市场将以6.29%的复合年增长率增长。
牙科洁牙机市场分析
牙科洁牙机市场,尤其是超声波洁牙机市场,正快速扩张,这主要归因于全球牙周疾病患病率的上升以及人们对预防性牙科护理和口腔卫生的日益重视。压电式和磁致伸缩式洁牙机等技术的进步,提高了洁牙机在牙科诊所的普及率。洁牙机是清除牙菌斑、牙结石和牙垢的重要工具,可用于龈上和龈下(龈上和龈下洁治)。市场正朝着微创技术方向发展,超声波洁牙机因其能够提供更精准的洁治效果,且与传统手动器械相比,患者不适感和组织损伤更小而备受青睐。领先企业正致力于开发符合人体工程学、改进尖端设计并配备先进水/抗菌剂输送系统的产品。随着新兴经济体牙科诊所和医院的扩张,以及老年人口的增长(他们需要更频繁的牙科治疗),预计该市场将快速增长。
牙科洁牙机市场概览
牙周刮治器是现代牙科中不可或缺的工具,用于牙周刮治和日常预防。市场上的牙周刮治器主要分为手动刮治器和电动刮治器(超声波和声波)。电动刮治器利用高频振动来清除牙结石,提供更彻底、通常也更快捷的清洁体验。先进的牙周刮治技术有助于提高患者的舒适度、治疗效率和临床效果。随着口腔健康日益被认为是整体健康的重要组成部分,人们对用于早期诊断和治疗牙周疾病的高效刮治工具的需求也在不断增长。
根据您的需求定制此报告
获取免费定制服务牙科洁牙机市场:战略洞察
-
获取本报告的主要市场趋势。这份免费样品将包含数据分析,内容涵盖市场趋势、估算和预测等。
牙科洁牙机市场驱动因素和机遇
市场驱动因素:
- 牙周疾病日益普遍:全球龋齿、牙龈炎和牙周炎的发病率不断上升,需要定期进行洁牙手术,这直接推动了对洁牙器的需求。
- 口腔卫生和预防保健意识的提高:全球意识宣传活动和对预防性牙科保健的日益重视,导致患者更频繁地进行专业清洁,从而推动了洁牙器的持续使用。
- 洁牙机设计技术进步:电动洁牙机的不断创新,包括改进的人体工程学、增强的频率/振幅控制和更优质的尖端材料,正在提高牙科诊所的采用率。
市场机遇:
- 新兴市场的扩张:亚太地区和南美及中美洲等地区牙科基础设施的快速增长、可支配收入的增加以及牙科旅游业的兴起,为洁牙器制造商提供了巨大的未开发潜力。
- 对微创和符合人体工程学的解决方案的需求:向微创手术的转变以及对临床医生舒适度的关注,为下一代产品创造了机会,例如免磨牙手动洁牙器和带有柔性喷嘴和更符合人体工程学手柄的先进超声波洁牙器。
- 数字和智能技术的融合:开发具有集成功能(如 LED 照明和数字功能)的智能超声波洁牙机,可以提高精度和易用性,这其中存在着机遇。
牙科洁牙机市场报告细分分析
通过对牙科洁牙机市场份额的各个细分市场进行分析,可以更清楚地了解其结构、增长潜力和新兴趋势。
按产品分类:
- 电动牙科洁牙机
- 手持式牙科洁牙器
- 缩放器插入
按申请方式:
- 牙周病学
- 牙髓病学
最终用户:
- 医院
- 牙科诊所
按地理位置:
- 北美
- 欧洲
- 亚太地区
- 南美洲和中美洲
- 中东和非洲 (MEA)
牙科洁牙机市场区域洞察
The Insight Partners 的分析师对预测期内影响牙科洁牙机市场的区域趋势和因素进行了详尽的阐述。本节还探讨了北美、欧洲、亚太、中东和非洲以及南美和中美洲等地区的牙科洁牙机市场细分和地域分布。
牙科洁牙机市场报告范围
| 报告属性 | 细节 |
|---|---|
| 2025年市场规模 | 11亿美元 |
| 到2034年市场规模 | 19.1亿美元 |
| 全球复合年增长率(2026-2034 年) | 6.29% |
| 史料 | 2021-2024 |
| 预测期 | 2026-2034 |
| 涵盖部分 |
副产品
|
| 覆盖地区和国家 |
北美
|
| 市场领导者和主要公司简介 |
|
牙科洁牙机市场参与者密度:了解其对业务动态的影响
牙科洁牙机市场正快速增长,这主要得益于终端用户需求的不断增长,而终端用户需求的增长又源于消费者偏好的转变、技术的进步以及消费者对产品益处的认知度提高。随着需求的增长,企业不断拓展产品线、创新以满足消费者需求并把握新兴趋势,这些都进一步推动了市场增长。
- 获取牙科洁牙机市场主要参与者概览
按地区划分的牙科洁牙机市场份额分析
北美在牙科洁牙机市场占据主导地位。其主导地位的驱动因素包括完善的医疗保健基础设施、较高的牙科保健意识、较高的牙科支出,以及先进的牙科设施和领先的市场参与者。
亚太地区被认为是增长最快的区域市场。这一增长得益于政府支持的改善口腔健康的举措、不断涌现的新牙科诊所,以及可支配收入增长和医疗旅游带来的患者群体扩大。
各个地区的市场增长轨迹各不相同:
-
北美
- 市场份额:拥有最高的市场份额,这得益于较高的牙科支出和对先进电动洁牙机的早期采用。
- 主要驱动因素:先进超声波技术的广泛应用、对美容和预防牙科的强劲需求以及主要制造商的存在。
- 趋势:注重符合人体工程学的设计和高质量的耗材/针头,以获得更佳的临床效果。
-
欧洲
- 市场份额:得益于先进的医疗保健系统和完善的牙科护理规范,市场份额显著。
- 关键驱动因素:牙科护理的高标准、严格的质量和监管规范(例如,与医疗器械相关的规范),以及公共和私人医疗保健对预防牙科的重视。
- 趋势:高性能压电装置的市场不断增长,便携式称重系统在非传统环境中得到应用。
-
亚太地区
- 市场份额:增长最快的区域市场。
- 主要驱动因素:牙科诊所的快速扩张、生活方式因素导致牙科疾病患病率上升,以及中国和印度等国家对医疗保健基础设施的投资增加和新技术的采用。
- 趋势:对经济实惠的洁牙机需求旺盛,现代化诊所正在迅速从手动洁牙机转向超声波洁牙机。
-
南美洲和中美洲
- 市场份额:新兴地区,市场接受度不断提高。
- 关键驱动因素:电子商务和娱乐行业对数字营销的采用率不断提高;全球技术提供商不断推出价格合理的云端人工智能解决方案。
- 趋势:支持社交分析平台的数字基础设施逐步现代化。
-
中东和非洲
- 市场份额:新兴市场,具有强劲的增长潜力。
- 关键驱动因素:国家层面的重大数字化和人工智能战略,旨在促进社交互动领域的创新;人工智能聊天机器人与社区管理系统的融合度不断提高。
- 趋势:基于人工智能的受众情绪追踪、影响者欺诈检测以及通过机器学习进行多语言内容审核。
牙科洁牙机市场参与者密度:了解其对业务动态的影响
牙科洁牙机市场呈现分散化趋势,既有全球大型牙科设备制造商的竞争,也有众多专注于特定领域的专业厂商。各公司正积极创新,致力于提升产品的耐用性、效率和人体工程学设计,以巩固其市场地位。
竞争格局促使供应商通过以下方式实现差异化:
- 开发具有自动调谐频率、集成喷水(灌溉系统)和 LED 照明等功能的缩放器,以提高可视性。
- 引入轻巧的树脂或硅胶手柄器械,并使用钛等高性能材料,以减少临床医生的手部疲劳并提高器械的使用寿命。
- 专注于并购和分销合作,以打入高增长的新兴市场,尤其是在亚太地区。
机遇与战略举措
- 技术整合:利用材料科学的进步来制造高耐用性尖端,并将智能功能集成到电动洁牙机中,以增强控制和定制患者治疗。
- 专注于耗材:对一次性吸头和专用插件的需求不断增长,以提高卫生水平并满足不同的临床程序(例如,用于植入物、深袋),从而创造了持续的收入来源。
- 收购与合作:大型牙科设备企业收购专业的洁牙机和手动器械制造商,以快速整合先进技术并扩展其产品组合。
牙科洁牙机市场的主要企业有:
- 登士柏西罗纳公司
- 亨利·沙因公司
- Den-Mat Holdings, LLC
- 胡弗里迪制造有限公司
- 布拉塞勒美国
- 恩维斯塔控股公司
- 科尔特恩集团
- 贝耶斯
- 中西株式会社
免责声明:以上列出的公司不分先后顺序。
牙科洁牙机市场新闻及最新动态
- 例如,2025年8月12日,唾液检测领域的领先创新者Oral Genome宣布与全球最大的诊所牙科和医疗从业人员医疗保健解决方案提供商Henry Schein建立战略合作伙伴关系。此次合作旨在将Oral Genome的尖端即时唾液检测技术推广至全美各地的牙科和医疗机构,从而促进口腔健康与全身健康护理的融合。
- 2025年3月25日,全球领先的牙科耗材及小型设备开发商和制造商COLTENE集团在世界最大的牙科展会之一——国际牙科展(IDS)上宣布推出一系列在感染控制、牙髓治疗和修复牙科领域具有创新性的产品。我们先进的解决方案能够提升临床疗效,优化工作流程效率,并确保器械消毒符合相关法规标准,同时助力现代牙科诊疗的可持续发展。
牙科洁牙机市场报告涵盖范围及成果
《牙科洁牙机市场规模及预测(2021-2034)》报告对市场进行了详细分析,涵盖以下领域:
- 本报告涵盖全球、区域和国家层面的牙科洁牙机市场规模及预测,包括所有主要细分市场。
- 牙科洁牙机市场趋势,以及市场动态,例如驱动因素、制约因素和主要机遇。
- 详细的PEST和SWOT分析
- 牙科洁牙机市场分析,涵盖关键市场趋势、全球和区域框架、主要参与者、法规以及近期市场发展动态。
- 牙科洁牙机市场行业格局及竞争分析,涵盖市场集中度、热力图分析、主要参与者及最新发展动态。提供详细的公司简介。

Mrinal 是一位经验丰富的研究分析师,在生命科学市场情报和咨询领域拥有超过 8 年的经验。凭借战略思维和对卓越的不懈追求,她在医药预测、市场机遇评估和行业基准制定方面积累了深厚的专业知识。她的工作致力于提供切实可行的洞察,帮助客户做出明智的战略决策。
Mrinal 的核心优势在于将复杂的定量数据集转化为有意义的商业智能。她敏锐的分析能力有助于制定市场进入 (GTM) 战略,并发掘制药和医疗器械行业的增长机会。作为一名值得信赖的顾问,她始终致力于简化工作流程并建立最佳实践,从而为客户推动创新并提高运营效率。
- 全面的市场规模与预测分析
- 详细的细分市场分析
- 深入的市场动态评估
- 区域及国家级洞察
- 竞争格局与企业对标分析
- 战略性商业情报
客户评价
Insight Partners 的 SCADA 系统市场报告内容全面,对当前趋势和未来预测提供了宝贵的见解。该团队始终高度专业、响应迅速且乐于助人。我们非常满意,强烈推荐他们的服务。
兰·凯德姆 伙伴, Reali Technologies LTD我请求一份关于特定软件市场的报告,团队在几天内就完成了。报告信息非常相关,而且呈现得非常出色。之后,我请求对报告进行一些修改和补充。团队再次迅速响应,不到一周我就收到了最终报告。
让-埃尔韦·詹恩 主席, 未来分析公司我们与 Insight Partners 合作进行了一项重要的市场研究和预测。他们清晰地洞察了机遇和风险,帮助我们制定了计划。他们的研究简单易用,数据可靠,帮助我们做出了明智而自信的决策。我们强烈推荐他们。
皮尤什·纳格帕尔 高级副总裁, 远光全球Insight Partners 凭借其深厚的行业专业知识,提供了富有洞察力、结构合理的市场研究。他们的团队始终专业且响应迅速。用户友好的网站让访问行业报告变得顺畅无阻。我们强烈推荐他们可靠、高质量的研究服务。
安达幸彦 首席执行官, 深蓝有限责任公司这是我第一次从The Insight Partners购买市场报告。起初我有些犹豫,但访问了他们的网站后,我更放心地冒险购买市场报告。我对报告的质量和客户服务非常满意。我对最初的报告有一些疑问和意见,但在与他们的分析师通过电子邮件沟通了几次后,我相信这份报告可以作为我们战略规划流程的参考。非常感谢您抽出宝贵的时间,让这次体验如此愉快。我一定会向其他人推荐你们的服务,当我们需要更多市场数据时,你们将是我的首选。
约翰·铃木 总裁兼首席执行官、董事会董事, BK科技感谢您在处理我关于尼日利亚传染病体外诊断市场信息请求的过程中所展现的支持和专业精神。感谢您的耐心、指导,以及您愿意提供的折扣,最终促成了这笔交易。我期待未来与 Insight Partners 继续合作,这一切都要归功于您与我初次接触后留下的良好印象。
奇吉奥克博士 ONYIA 董事总经理, PineCrest 医疗保健有限公司购买理由
- 明智的决策
- 了解市场动态
- 竞争分析
- 客户洞察
- 市场预测
- 风险规避
- 战略规划
- 投资论证
- 识别新兴市场
- 优化营销策略
- 提升运营效率
- 顺应监管趋势


