
肌肉骨骼疾病治疗市场基于(主要区域、市场参与者、规模和份额)- 预测至 2031 年
肌肉骨骼疾病治疗市场规模和预测(2021-2031 年)、全球和区域份额、趋势和增长机会分析报告覆盖范围:按疾病(关节炎、骨关节炎、骨质疏松症、脊椎炎等)、成像方式(磁共振成像、计算机断层扫描、超声波等)和地理
- 状态 : 数据发布
- 报告代码 : TIPMD00002090
- 类别 : 生命科学
- 页数 : 150
- 可用报告格式 :


- 最后更新日期 : May 16, 2024

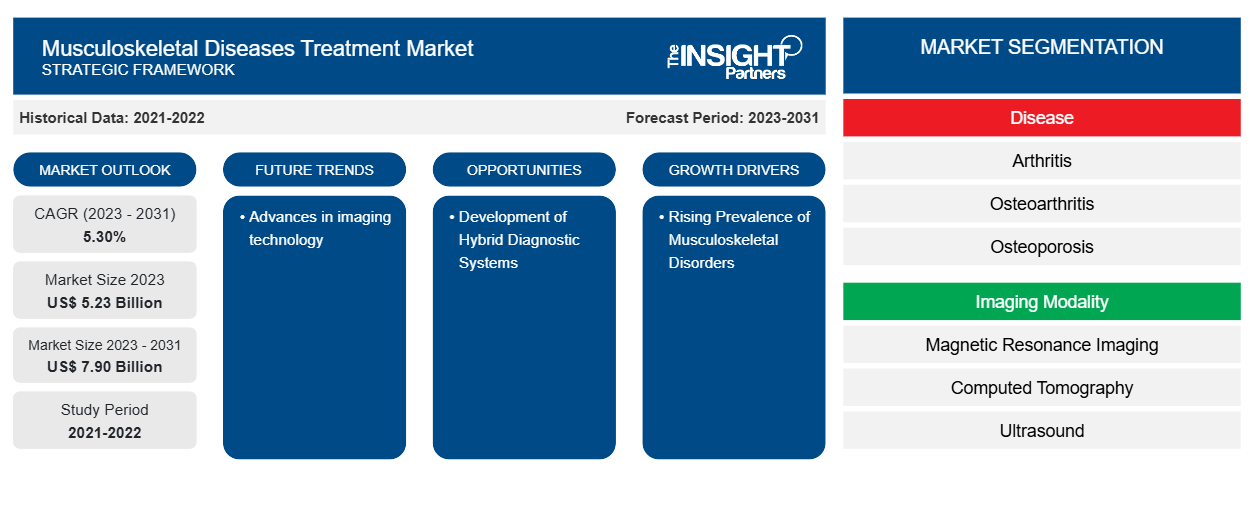
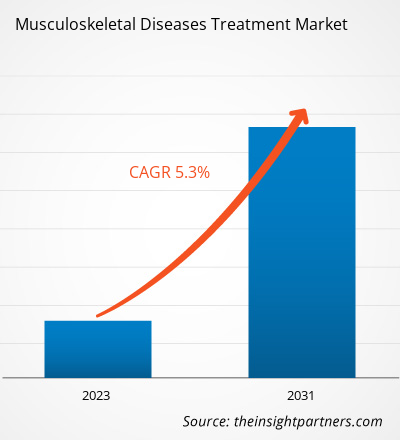
肌肉骨骼疾病治疗市场规模预计将从 2023 年的 52.3 亿美元增至 2031 年的 79.0 亿美元。预计 2023-2031 年期间市场复合年增长率为 5.30%。成像技术的进步和介入手术的增多可能仍是肌肉骨骼疾病治疗市场的主要趋势。
肌肉骨骼疾病治疗市场分析
肌肉骨骼疾病是指对肌肉、关节、骨骼和其他人体部位产生不利影响的一组疾病。肌腱炎、骨关节炎、脊椎炎和骨质疏松症是最常见的肌肉骨骼疾病。医生通常主要根据患者的病史或通过进行几次身体检查来诊断肌肉骨骼疾病。推动肌肉骨骼疾病治疗市场发展的关键因素是肌肉骨骼疾病患病率的上升、老年人口的增加以及肌肉骨骼疾病诊断的技术进步。然而,诊断系统的高成本和缺乏熟练的专业人员阻碍了市场的增长。
肌肉骨骼疾病治疗市场概况
北美是最大的肌肉骨骼疾病治疗市场,其中美国占有最大的区域市场份额,其次是加拿大。北美市场的增长得益于超声波、PET、SPECT 和磁共振成像公司对创新产品日益增长的需求;主要市场参与者的存在;以及各种学术和研究机构进行的广泛研发。此外,人们越来越关注在医疗保健、政府和私人举措中采用先进方法以促进早期诊断,政府和私人机构为肌肉骨骼研究投入的大量资金为北美肌肉骨骼疾病治疗市场创造了收入。北美在全球肌肉骨骼疾病治疗市场中的收入和全球经济地位。
定制此报告以满足您的需求
您可以免费定制任何报告,包括本报告的部分内容、国家级分析、Excel 数据包,以及为初创企业和大学提供优惠和折扣
肌肉骨骼疾病治疗市场:战略洞察
-
获取此报告的关键市场趋势。这个免费样品将包括数据分析,从市场趋势到估计和预测。
肌肉骨骼疾病治疗市场驱动因素和机遇
肌肉骨骼疾病患病率上升有利于市场
运动损伤、职业损伤和与年龄相关的功能障碍都可能导致肌肉骨骼疾病。背痛、类风湿性关节炎、骨关节炎、骨质疏松症、化脓性关节炎、痛风、重症肌无力和系统性红斑狼疮 (SLE) 是最常见的肌肉骨骼疾病。肌肉骨骼系统是诊断和治疗所有对肌肉骨骼系统产生不利影响的急性和慢性疾病,包括骨骼、肌肉、肌腱、关节和韧带,以及治疗肌肉骨骼系统的非手术损伤。近 300,000 名婴儿和儿童患有关节炎或风湿病。最常见的关节炎类型是骨关节炎,影响了约 3100 万美国人。到 2040 年底,预计医生诊断患有关节炎的人数将超过 7800 万。因此,肌肉骨骼疾病患病率的上升推动了肌肉骨骼疾病治疗市场的增长。
混合诊断系统的开发
混合 MRI 系统是指将两种模式相结合以提供人体解剖和生理信息的复杂微创成像技术。MRI 可以与各种其他成像技术相结合,包括计算机断层扫描 (CT) 和正电子发射断层扫描 (PET),或可用于成像的简单工具,例如 X 射线荧光透视。随着现代诊断技术集中于分子和基因水平,多模式成像变得尤为重要。过去十年,PET 和 MRI 的结合在基础临床和临床前研究中已被证明非常成功。这些混合技术正在逐渐进入临床应用,以深入了解各种医疗状况、疾病、生物途径和治疗评估。
肌肉骨骼疾病治疗市场报告细分分析
有助于得出肌肉骨骼疾病治疗市场分析的关键部分是疾病和成像方式。
- 根据疾病,肌肉骨骼疾病治疗市场细分为关节炎、骨关节炎、骨质疏松症、脊椎炎等。关节炎领域在 2023 年占据了最大的市场份额。
- 根据成像方式,市场分为磁共振成像 (MRI)、计算机断层扫描 (CT)、超声波等。计算机断层扫描 (CT) 领域在 2023 年占据了最大的市场份额。
肌肉骨骼疾病治疗市场份额(按地区)分析
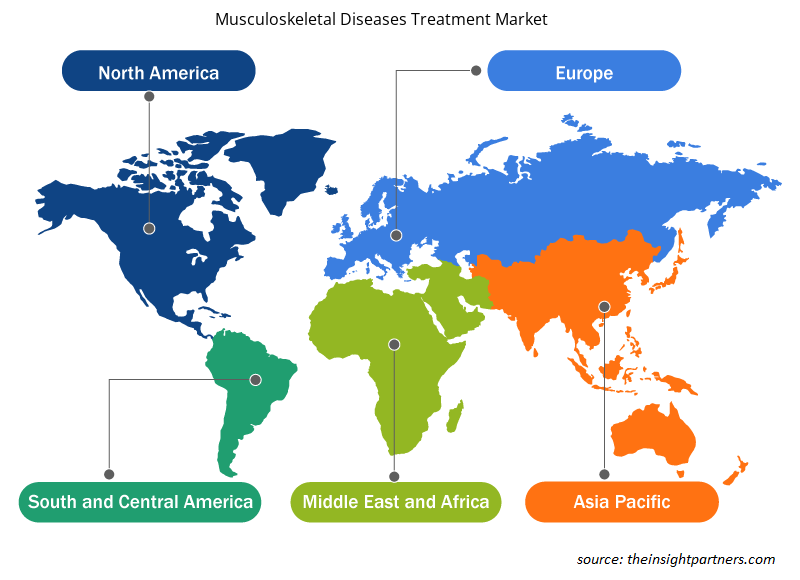
肌肉骨骼疾病治疗市场报告的地理范围主要分为五个区域:北美、亚太、欧洲、中东和非洲、南美和中美。
北美主导着肌肉骨骼疾病治疗市场。对于数百万美国人来说,医疗保健的质量由其所在地区的放射治疗质量来象征。根据美国放射技术协会 2023 年的数据,美国每年进行约 2.75 亿次常规放射治疗。政府制定法规来测试和标记被动植入物在磁共振 (MR) 环境中的安全性和兼容性。在美国,美国食品药品监督管理局 (FDA) 设备和放射健康中心 (CDRH) 内的放射健康司提供医疗设备的安全性和有效性以及辐射电子产品的安全性。此外,美国政府已决定加强对超声波机器和类似成像设备的控制,以防止滥用这些机器进行性别选择和其他问题。
肌肉骨骼疾病治疗市场区域洞察
Insight Partners 的分析师已详尽解释了预测期内影响肌肉骨骼疾病治疗市场的区域趋势和因素。本节还讨论了北美、欧洲、亚太地区、中东和非洲以及南美和中美洲的肌肉骨骼疾病治疗市场细分和地理位置。
- 获取肌肉骨骼疾病治疗市场的区域特定数据
肌肉骨骼疾病治疗市场报告范围
| 报告属性 | 细节 |
|---|---|
| 2023 年的市场规模 | 52.3亿美元 |
| 2031 年市场规模 | 79亿美元 |
| 全球复合年增长率(2023 - 2031) | 5.30% |
| 史料 | 2021-2022 |
| 预测期 | 2023-2031 |
| 涵盖的领域 |
按疾病分类
|
| 覆盖地区和国家 |
北美
|
| 市场领导者和主要公司简介 |
|
肌肉骨骼疾病治疗市场参与者密度:了解其对业务动态的影响
肌肉骨骼疾病治疗市场正在快速增长,这得益于终端用户需求的不断增长,而这些需求又源于消费者偏好的不断变化、技术进步以及对产品优势的认识不断提高等因素。随着需求的增加,企业正在扩大其产品范围,进行创新以满足消费者的需求,并利用新兴趋势,从而进一步推动市场增长。
市场参与者密度是指在特定市场或行业内运营的企业或公司的分布情况。它表明在给定市场空间中,相对于其规模或总市场价值,有多少竞争对手(市场参与者)存在。
在肌肉骨骼疾病治疗市场运营的主要公司有:
- 通用电气
- 荷兰皇家飞利浦公司
- 西门子股份公司
- 佳能医疗系统株式会社
- 日立制作所
- Accuray 公司
免责声明:上面列出的公司没有按照任何特定顺序排列。
- 了解肌肉骨骼疾病治疗市场顶级关键参与者概况
肌肉骨骼疾病治疗市场新闻和最新发展
肌肉骨骼疾病治疗市场通过收集一级和二级研究后的定性和定量数据进行评估,其中包括重要的公司出版物、协会数据和数据库。以下列出了肌肉骨骼疾病治疗市场的一些发展情况:
- Solera Health 通过顶级数字 MSK 治疗解决方案 SWORD Health、Kaia Health 和 Sworkit 推出了新的肌肉骨骼 (MSK) 产品。该公司声称,其新的 MSK 产品将通过亚临床服务解决一系列肌肉骨骼疾病,这些服务涵盖预防性健康、伤害和慢性病管理,以及通过其不断扩展的一流、循证数字干预网络进行术前和术后康复。(来源:Solera Health,新闻稿,2021 年)
肌肉骨骼疾病治疗市场报告覆盖范围和交付成果
“肌肉骨骼疾病治疗市场规模和预测(2021-2031 年)”报告对以下领域进行了详细的市场分析:
- 范围内涵盖的所有主要细分市场的全球、区域和国家层面的肌肉骨骼疾病治疗市场规模和预测
- 肌肉骨骼疾病治疗市场趋势以及市场动态,如驱动因素、限制因素和关键机遇
- 详细的 PEST/波特五力分析和 SWOT 分析
- 肌肉骨骼疾病治疗市场分析涵盖主要市场趋势、全球和区域框架、主要参与者、法规和最新市场发展
- 行业格局和竞争分析,涵盖市场集中度、热图分析、知名参与者以及肌肉骨骼疾病治疗市场的最新发展
- 详细的公司简介

Mrinal 是一位经验丰富的研究分析师,在生命科学市场情报和咨询领域拥有超过 8 年的经验。凭借战略思维和对卓越的不懈追求,她在医药预测、市场机遇评估和行业基准制定方面积累了深厚的专业知识。她的工作致力于提供切实可行的洞察,帮助客户做出明智的战略决策。
Mrinal 的核心优势在于将复杂的定量数据集转化为有意义的商业智能。她敏锐的分析能力有助于制定市场进入 (GTM) 战略,并发掘制药和医疗器械行业的增长机会。作为一名值得信赖的顾问,她始终致力于简化工作流程并建立最佳实践,从而为客户推动创新并提高运营效率。
- 全面的市场规模与预测分析
- 详细的细分市场分析
- 深入的市场动态评估
- 区域及国家级洞察
- 竞争格局与企业对标分析
- 战略性商业情报
客户评价
Insight Partners 的 SCADA 系统市场报告内容全面,对当前趋势和未来预测提供了宝贵的见解。该团队始终高度专业、响应迅速且乐于助人。我们非常满意,强烈推荐他们的服务。
兰·凯德姆 伙伴, Reali Technologies LTD我请求一份关于特定软件市场的报告,团队在几天内就完成了。报告信息非常相关,而且呈现得非常出色。之后,我请求对报告进行一些修改和补充。团队再次迅速响应,不到一周我就收到了最终报告。
让-埃尔韦·詹恩 主席, 未来分析公司我们与 Insight Partners 合作进行了一项重要的市场研究和预测。他们清晰地洞察了机遇和风险,帮助我们制定了计划。他们的研究简单易用,数据可靠,帮助我们做出了明智而自信的决策。我们强烈推荐他们。
皮尤什·纳格帕尔 高级副总裁, 远光全球Insight Partners 凭借其深厚的行业专业知识,提供了富有洞察力、结构合理的市场研究。他们的团队始终专业且响应迅速。用户友好的网站让访问行业报告变得顺畅无阻。我们强烈推荐他们可靠、高质量的研究服务。
安达幸彦 首席执行官, 深蓝有限责任公司这是我第一次从The Insight Partners购买市场报告。起初我有些犹豫,但访问了他们的网站后,我更放心地冒险购买市场报告。我对报告的质量和客户服务非常满意。我对最初的报告有一些疑问和意见,但在与他们的分析师通过电子邮件沟通了几次后,我相信这份报告可以作为我们战略规划流程的参考。非常感谢您抽出宝贵的时间,让这次体验如此愉快。我一定会向其他人推荐你们的服务,当我们需要更多市场数据时,你们将是我的首选。
约翰·铃木 总裁兼首席执行官、董事会董事, BK科技感谢您在处理我关于尼日利亚传染病体外诊断市场信息请求的过程中所展现的支持和专业精神。感谢您的耐心、指导,以及您愿意提供的折扣,最终促成了这笔交易。我期待未来与 Insight Partners 继续合作,这一切都要归功于您与我初次接触后留下的良好印象。
奇吉奥克博士 ONYIA 董事总经理, PineCrest 医疗保健有限公司购买理由
- 明智的决策
- 了解市场动态
- 竞争分析
- 客户洞察
- 市场预测
- 风险规避
- 战略规划
- 投资论证
- 识别新兴市场
- 优化营销策略
- 提升运营效率
- 顺应监管趋势


