
水下连接器市场需求、趋势及至2034年预测
水下连接器市场规模及预测(2021-2034 年)、全球及区域份额、趋势及增长机会分析报告涵盖范围:按类型(橡胶模制、感应耦合、充液式水下可插拔连接器和刚性外壳/隔板式)、连接方式(电气、光纤和混合)、应用领域(军事与国防、石油和天然气、电信、海洋学、ROV/AUV 及其他)和地域(北美、欧洲、亚太、中东和非洲以及南美和中美洲)划分。
- 状态 : 已发布
- 报告代码 : TIPRE00006137
- 类别 : 电子和半导体
- 页数 : 244
- 可用报告格式 :


- 最后更新日期 : June 10, 2026

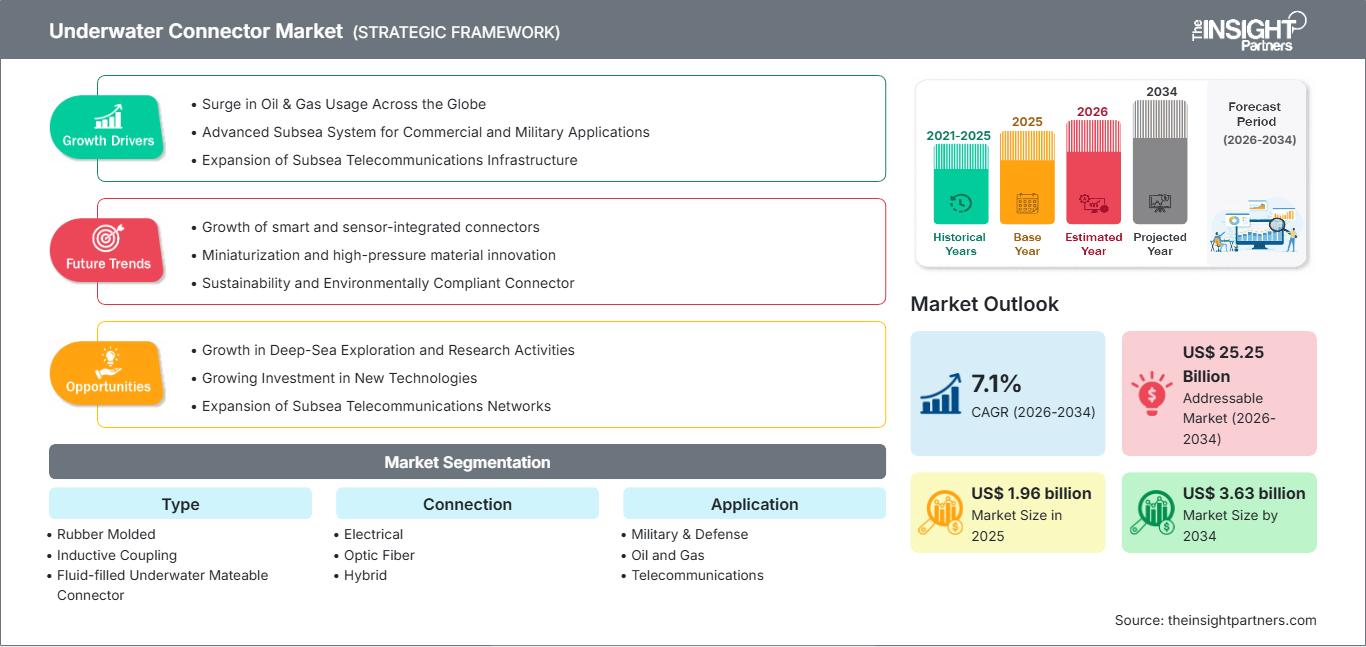
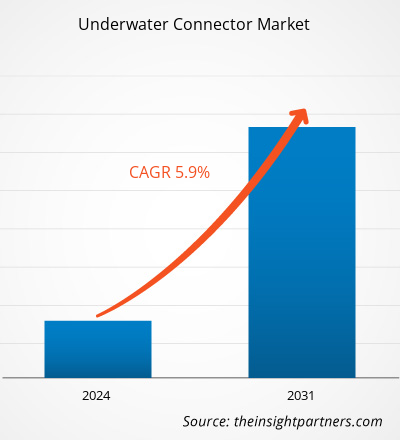
预计到2034年,水下连接器市场规模将从2025年的19.6亿美元增长至36.3亿美元。预计2026年至2034年期间,该市场将以7.1%的复合年增长率增长。
水下连接器市场分析
水下连接器市场正稳步扩张,这主要得益于海底作业日益复杂化以及在恶劣海洋环境中对可靠电力和数据传输的需求。海上油气勘探活动的增加、海底通信网络的扩展以及海上可再生能源项目投资的增长是推动市场增长的关键因素。自主式和遥控式水下航行器在国防、科研和检测活动中的应用,加速了对高性能连接器的需求。技术进步正在重塑市场格局,重点在于耐用、耐腐蚀的材料以及能够承受极端压力和温度条件的紧凑型设计。光纤连接器和混合连接器的集成增强了高速数据传输能力。从区域来看,海上基础设施和海洋勘探的强劲发展正在推动市场需求,尤其是在新兴经济体。持续的创新和不断扩展的海底应用为市场前景提供了支撑。
水下连接器市场概览
随着海底系统日益先进,各行业互联互通程度不断提高,水下连接器市场也在不断发展。这些连接器能够在水下环境中实现可靠的电气、信号和数据传输,满足对耐用性和稳定性能的高要求作业需求。随着海上能源平台、水下监测系统和海洋研究基础设施的扩展,水下连接器的重要性日益凸显。水下连接器市场的增长与电信、国防和海洋勘探等领域对海底技术的日益广泛应用密切相关。数字化和实时数据交换的趋势推动了能够处理更高带宽并与现代海底设备无缝集成的连接器的应用。创新仍然是该市场的关键特征,制造商致力于开发紧凑型设计、改进密封技术以及适用于长期水下部署的材料。随着各行业不断探索更深、更复杂的海洋环境,水下连接器正成为全球海底连接解决方案的重要组成部分。
市场评估与洞察
- 到2025年,欧洲将以33.9%的市场份额占据主导地位。
- 亚太地区预计在预测期内将以 11.4% 的复合年增长率增长。
- 预计美国市场在预测期内将以 7% 的复合年增长率增长。
- 按类型划分,橡胶模压件在 2025 年占据了最大的市场份额,达到 37.5%。
- 按连接类型划分,光纤细分市场预计将实现最快增长,在预测期内复合年增长率将达到 8.1%。
- 按应用领域划分,电信领域在 2025 年占据最大的市场份额,达到 38.1%。
- 该报告重点介绍了伊顿公司、TE Connectivity Ltd、Glenair, Inc.、Fischer Connectors SA、Teledyne Technologies Inc、Amphenol Corporation、Hydro Group、BIRNS Aquamate LLC、GISMA Steckverbinder GmbH、AK Industries等主要行业参与者,同时分析了可能重塑未来市场的新理念、颠覆性产品和创新服务的关键发展,并揭示了整个行业的新兴主题。
根据您的需求定制此报告
获取免费定制服务水下连接器市场:战略洞察
-
获取本报告的主要市场趋势。这份免费样品将包含数据分析,内容涵盖市场趋势、估算和预测等。
水下连接器市场驱动因素和机遇
市场驱动因素:
- 海上能源勘探蓬勃发展:日益增长的海上能源活动带动了对水下连接器的需求。石油、天然气和海上风电项目都需要可靠的海底电力和数据传输系统。连接器能够确保设备在深水环境中高效运行,随着勘探活动向更复杂、更偏远的海域推进,这些连接器能够保障设备的长期部署、安全性和性能。
- 海底通信网络扩展:全球海底通信基础设施的快速扩张正在推动连接器的应用。互联网使用量和数据传输需求的不断增长,促使人们对海底电缆系统进行更多投资。水下连接器可确保稳定、高速的信号传输,从而实现洲际间的可靠连接,并支持数字通信和云服务的持续发展。
市场机遇:
- 自主水下航行器发展迅猛:自主式和遥控式水下航行器的日益普及带来了巨大的发展机遇。这些航行器广泛应用于国防、科研和海上巡检等领域。水下连接器支持这些系统内部的电力分配和数据交换,从而为专为移动式水下应用量身定制的先进、紧凑型和高性能连接器解决方案创造了机遇。
- 海洋研究与监测的进展:对海洋探索和环境监测的日益重视创造了大量机遇。科学家和研究机构依靠水下传感器和设备进行数据采集。连接器确保这些系统的可靠运行,从而促进创新解决方案的开发,以支持在各种海洋条件下进行长期部署和精确数据传输。
水下连接器市场报告细分分析
为了解水下连接器市场的结构、增长前景和新兴趋势,可将其划分为不同的细分市场。以下是行业报告中常用的标准细分方法:
按类型:
- 橡胶模制连接器:橡胶模制连接器具有很高的柔韧性和良好的防水密封性,使其适用于需要耐用性和可靠性的浅海和中海应用。
- 感应耦合连接器:感应耦合连接器可实现水下非接触式电源和数据传输,减少机械磨损,并确保频繁连接循环的海底系统的长期可靠性。
- 充液式水下连接器:充液式连接器使用介电液来平衡压力并防止水侵入,从而能够在具有极端压力条件和恶劣环境的深海环境中可靠运行。
- 刚性外壳/舱壁连接器:刚性外壳或舱壁连接器提供坚固的结构保护和牢固的固定安装,常用于海上平台,在这些平台上需要稳定、长期的水下电气和信号连接。
通过连接:
- 电气连接器:水下电气连接器传输电力和低频信号,确保海上平台、ROV 和海洋工业应用中使用的水下设备的可靠能源分配。
- 光纤连接器:水下光纤连接器可实现高速数据传输,损耗极小,支持需要大带宽的潜艇通信系统、深海勘探和实时监控操作。
- 混合连接器:混合水下连接器结合了电和光纤功能,可同时进行供电和数据传输,从而提高效率并降低海底装置的系统复杂性。
按申请方式:
- 军事与国防
- 石油和天然气
- 电信
- 海洋学
- ROV/AUV
- 其他的
按地理位置:
- 北美
- 欧洲
- 亚太地区
- 南美洲和中美洲
- 中东和非洲
水下连接器市场报告范围
| 报告属性 | 细节 |
|---|---|
| 2025年市场规模 | 19.6亿美元 |
| 到2034年市场规模 | 36.3亿美元 |
| 全球复合年增长率(2026-2034 年) | 7.1% |
| 史料 | 2021-2025 |
| 预测期 | 2026-2034 |
| 涵盖的领域 |
按类型
|
| 覆盖地区和国家 |
北美
|
| 市场领导者和主要公司简介 |
|
水下连接器市场参与者密度:了解其对业务动态的影响
水下连接器市场正快速增长,这主要得益于终端用户需求的不断增长,而终端用户需求的增长又源于消费者偏好的转变、技术的进步以及对产品优势认知的提高。随着需求的增长,企业不断拓展产品和服务,持续创新以满足消费者需求,并把握新兴趋势,这些都进一步推动了市场增长。
水下连接器市场份额地域分析
亚太地区水下连接器市场正经历快速增长,这主要得益于海上能源项目、海底电缆网络以及该地区日益活跃的海洋勘探活动。此外,海上风能投资的增加、国防现代化项目的推进以及各行业对先进水下监测和通信系统的日益普及,也进一步推动了市场增长。
由于海上能源开发、海底通信基础设施、国防开支、海洋研究活动以及海底行业技术应用等方面的差异,水下连接器市场增长在不同地区有所不同。以下是各地区市场份额和趋势概述:
1. 北美洲
- 市场份额:占据全球市场相当大的份额
-
关键驱动因素:
- 海上能源扩张:强劲的海上石油、天然气和风能项目增加了对耐用水下连接器的需求,以支持深水作业和可靠的海底电力和数据传输系统。
- 国防和海军现代化
- 海底通信基础设施增长
- 趋势:智能传感器在海上平台中的日益普及增强了实时监控能力,并增加了对先进水下连接解决方案的依赖。
2. 欧洲
- 市场份额:由于欧盟早期出台的严格法规,占据了相当大的份额。
-
关键驱动因素:
- 海上风电开发:海上风电场的快速增长增加了对用于电力传输和系统集成的坚固水下连接器的需求。
- 海底电缆网络
- 海洋研究计划。
- 趋势:对可持续海上基础设施的关注正在加速欧洲水域环保耐腐蚀水下连接器技术的应用。
3. 亚太地区
- 市场份额:增长最快的地区,占据主导市场份额
-
关键驱动因素:
- 海上能源投资:亚太地区的海上能源投资正在增加对水下连接器的需求,因为各国正在开发深水油田和海上风电场,这些都需要可靠的海底连接来进行能源和数据传输。
- 海底电缆扩容
- 海军陆战队防御计划
- 趋势:自主水下航行器在检查和勘探活动中的应用日益增多,推动了对先进连接器系统的需求。
4. 中东和非洲
- 市场份额:虽然规模较小,但增长迅速。
-
关键驱动因素:
- 海上油气主导地位:中东和非洲海上油气主导地位正在推动水下连接器需求,因为广泛的深水开采需要可靠的海底系统来实现连续作业、安全和高效的资源运输。
- 海底管道扩建
- 国防海事投资
- 趋势:深水区海上勘探的扩张正在推动先进的耐高压水下连接器技术的应用。
5. 南美洲和中美洲
- 市场份额:市场稳步增长
-
关键驱动因素:
- 海上石油勘探:南美洲和中美洲的海上石油勘探正在推动对水下连接器的需求,因为深水钻井项目需要在恶劣环境下提供可靠的海底电力、通信和操作安全系统。
- 海底基础设施开发
- 可再生能源项目
- 趋势:对海上勘探技术的投资不断增加,推动了耐用、高性能水下连接解决方案的普及。
市场密度高,竞争激烈
一些全球主要企业也参与其中,例如 BIRNS Aquamate LLC;Hydro Group;Glenair, Inc.;Fischer Connectors SA;GISMA Steckverbinder GmbH;Eaton Corporation plc;TE Connectivity Ltd;AK Industries;Amphenol Corporation;以及 Teledyne Technologies Inc.。
激烈的竞争促使企业通过提供以下服务来脱颖而出:
- 更快的响应速度和更低的延迟
- 先进的耐压设计
- 高速光纤集成
- 卓越的密封技术
- 使用耐腐蚀材料。
机遇与战略举措
- 海上风能项目的不断发展,对可靠的水下连接器产生了强劲的需求,以支持全球海底电力传输和长期可再生能源基础设施的扩张。
- 各公司正致力于开发集成电源和高速数据传输的混合连接器,以降低系统复杂性并提高海底应用的运行效率。
研究过程中还分析了其他公司。
- ITT Cannon
- 史密斯互连
- ODU GmbH & Co. KG
- 布尔金有限公司
- Radial SA
- 贝尔保险丝公司
- PEI-Genesis
- 哈贝尔公司
- 西门子股份公司
- 斯伦贝谢有限公司。
水下连接器市场新闻及最新进展
- BIRNS公司宣布与JOWO Systemtechnik AG建立授权经销商合作关系:2025年1月,全球领先的高性能海底连接器、定制电缆组件和照明系统设计与制造商BIRNS公司宣布与JOWO Systemtechnik AG建立授权经销商合作关系。JOWO总部位于德国,专注于为海洋和水下应用、海上和国防技术、广播解决方案、航空航天工程以及危险区域提供电气和光纤连接器及系统。
- 海林电子宣布新增 SeaKing WetMate 系列:2025 年 9 月,海林电子宣布在其丰富的互连解决方案产品组合中新增由 Glenair 公司开发的 SeaKing WetMate 系列。该系列产品基于 SeaKing 平台久经考验的耐用性和高精度设计,旨在为实际水下环境提供可靠的性能,即使在完全浸没的情况下也能实现连接器的牢固连接。
水下连接器市场报告涵盖范围及成果
《水下连接器市场规模及预测(2021-2034)》报告对以下领域进行了详细的市场分析:
- 水下连接器市场规模及预测,涵盖全球、区域和国家层面的所有关键细分市场。
- 水下连接器市场趋势,以及驱动因素、制约因素和关键机遇等市场动态
- 详细的PEST和SWOT分析
- 水下连接器市场分析,涵盖关键市场趋势、全球和区域框架、主要参与者、法规以及近期市场发展动态。
- 水下连接器市场行业格局及竞争分析,涵盖市场集中度、热力图分析、主要参与者及最新发展动态
- 公司详细概况

Naveen 是一位经验丰富的市场研究和咨询专业人士,在定制项目、联合项目和咨询项目方面拥有超过 9 年的专业经验。他目前担任副总裁,成功管理了项目价值链中的利益相关者,撰写了 100 多份研究报告和 30 多项咨询项目。他的工作涵盖工业和政府项目,为客户的成功和数据驱动的决策做出了重要贡献。
Naveen 拥有卡纳塔克邦 VTU 的电子与通信工程学位,以及马尼帕尔大学的市场营销与运营 MBA 学位。他已担任 IEEE 会员 9 年,积极参与各种会议、技术研讨会,并在分部和地区层面担任志愿者。在此之前,他曾担任 IndustryARC 的助理战略顾问和惠普(惠普全球)的工业服务器顾问。
- 全面的市场规模与预测分析
- 详细的细分市场分析
- 深入的市场动态评估
- 区域及国家级洞察
- 竞争格局与企业对标分析
- 战略性商业情报
客户评价
Insight Partners 的 SCADA 系统市场报告内容全面,对当前趋势和未来预测提供了宝贵的见解。该团队始终高度专业、响应迅速且乐于助人。我们非常满意,强烈推荐他们的服务。
兰·凯德姆 伙伴, Reali Technologies LTD我请求一份关于特定软件市场的报告,团队在几天内就完成了。报告信息非常相关,而且呈现得非常出色。之后,我请求对报告进行一些修改和补充。团队再次迅速响应,不到一周我就收到了最终报告。
让-埃尔韦·詹恩 主席, 未来分析公司我们与 Insight Partners 合作进行了一项重要的市场研究和预测。他们清晰地洞察了机遇和风险,帮助我们制定了计划。他们的研究简单易用,数据可靠,帮助我们做出了明智而自信的决策。我们强烈推荐他们。
皮尤什·纳格帕尔 高级副总裁, 远光全球Insight Partners 凭借其深厚的行业专业知识,提供了富有洞察力、结构合理的市场研究。他们的团队始终专业且响应迅速。用户友好的网站让访问行业报告变得顺畅无阻。我们强烈推荐他们可靠、高质量的研究服务。
安达幸彦 首席执行官, 深蓝有限责任公司这是我第一次从The Insight Partners购买市场报告。起初我有些犹豫,但访问了他们的网站后,我更放心地冒险购买市场报告。我对报告的质量和客户服务非常满意。我对最初的报告有一些疑问和意见,但在与他们的分析师通过电子邮件沟通了几次后,我相信这份报告可以作为我们战略规划流程的参考。非常感谢您抽出宝贵的时间,让这次体验如此愉快。我一定会向其他人推荐你们的服务,当我们需要更多市场数据时,你们将是我的首选。
约翰·铃木 总裁兼首席执行官、董事会董事, BK科技感谢您在处理我关于尼日利亚传染病体外诊断市场信息请求的过程中所展现的支持和专业精神。感谢您的耐心、指导,以及您愿意提供的折扣,最终促成了这笔交易。我期待未来与 Insight Partners 继续合作,这一切都要归功于您与我初次接触后留下的良好印象。
奇吉奥克博士 ONYIA 董事总经理, PineCrest 医疗保健有限公司购买理由
- 明智的决策
- 了解市场动态
- 竞争分析
- 客户洞察
- 市场预测
- 风险规避
- 战略规划
- 投资论证
- 识别新兴市场
- 优化营销策略
- 提升运营效率
- 顺应监管趋势


