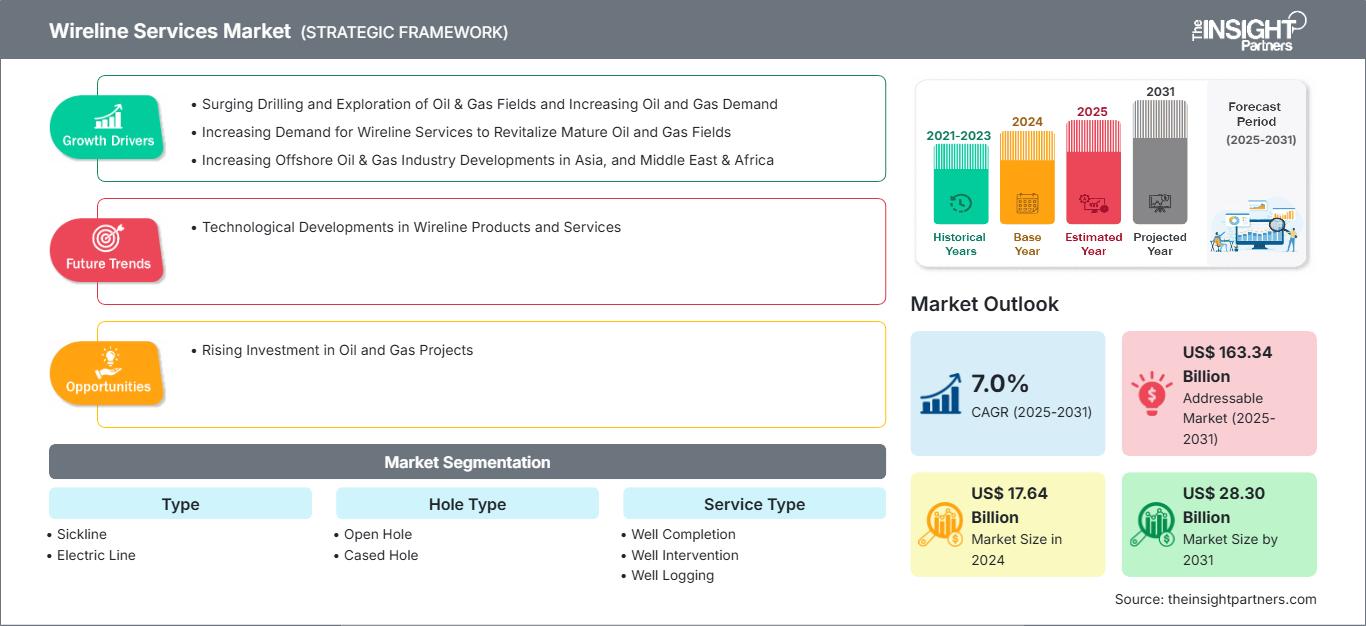
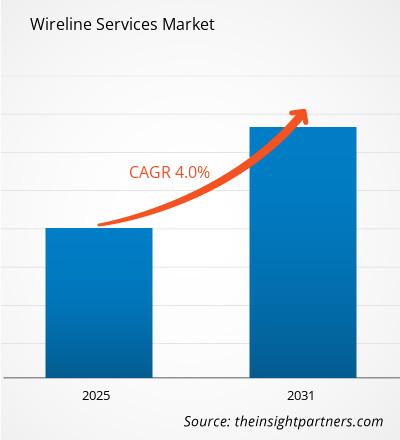
有线服务市场规模预计将从2024年的176.4887亿美元增至2031年的283.0565亿美元。预计2025年至2031年期间,该市场的复合年增长率将达到7.0%。密集的研发活动正在推动高质量有线产品的开发,这些产品很可能在未来几年为市场带来新的趋势。
有线服务市场分析
为满足日益增长的石油和天然气需求,石油和天然气田的钻探和勘探活动不断增加,为振兴成熟石油和天然气田而对有线服务的需求不断增加,以及亚洲、中东和非洲海上石油和天然气工业的不断发展,是推动有线服务市场增长的主要因素
海上油田,尤其是深水和超深水油田,正日益受到重视,这推动了对有线服务的需求。此外,非常规和复杂的成熟油田需要持续的监测和维护才能维持生产。有线服务对于干预活动至关重要,例如识别生产问题和提高采收率。油田运营中数字技术的采用可能会为有线服务提供商创造未来机遇。例如,实施数据分析和预测性维护可以改进干预活动并减少停机时间。有线服务市场概览
有线服务支持海上和陆上油气田的勘探、钻井、完井和生产作业。这些服务对于油藏评估、井下作业、管道恢复和测井作业至关重要。它们的使用有助于作业者提高效率、提升油井产能并优化资源开采。有线服务是指利用电缆或电线将工具和设备安装到油气井中。这些电缆将实时数据从井内传输到地面,使作业者能够了解油井状况、进行测量并执行必要的干预措施。
您可以免费定制任何报告,包括本报告的部分内容、国家级分析、Excel 数据包,以及为初创企业和大学提供优惠和折扣
有线服务市场:

- 获取此报告的顶级关键市场趋势。此免费样品将包括数据分析,从市场趋势到估计和预测。
有线服务市场驱动因素和机遇
油气田钻探勘探活动激增,油气需求增加
北美、中东和非洲以及亚太地区日益增多的钻井和勘探活动正在推动有线服务市场的增长。2025 年 4 月,土耳其能源和自然资源部长与石油和矿产资源部长签署了在陆上油田勘探和生产碳氢化合物的协议。土耳其在索马里发现了多达 200 亿桶原油。由于能源需求不断增长,全球对石油和天然气的需求也在增加。根据国际能源署 (IEA) 的分析,截至 2025 年 4 月,预计全球石油需求将在 2025 年增加 73 万桶/天 (kb/d),到 2026 年将增加 69 万桶/天。中国的石油总需求持续上升,增长主要来自石化原料,这些原料被转化为塑料和纤维,而不是作为燃料燃烧。随着新工厂的投产,2024年中国对石化产品的需求将增长近5%,预计这一趋势将在未来几年持续下去。
石油和天然气项目投资增加
政府举措和私营部门资本正致力于开发新的钻井场地、扩建现有油田以及升级生产设施。这些资金承诺确保了对关键管材产品的持续采购,从而维持了强劲的行业需求。2024年11月,巴西国有石油天然气巨头巴西国家石油公司公布了其2025-2029年新商业计划(BP 2025-2029)和2050年战略规划(SP 2050),概述了强化其长期愿景的优先事项。前者设想了一项数十亿美元的投资计划,而后者则展现了这家巴西企业在油气开发与低碳业务之间取得平衡的愿景。巴西国家石油公司的2024-2028年投资战略将其预计的1020亿美元投资中的大部分分配给了石油和天然气。该公司将这些能源视为关键的增长动力,对于推进和资助向更可持续的能源解决方案的转型至关重要。
有线服务市场报告细分分析
有助于得出有线服务市场分析的关键部分是类型、孔类型、服务类型和应用。
- 根据类型,市场分为医用线和电力线。2024年,电力线市场占据主导地位。
- 根据井眼类型,市场分为裸眼井和套管井。2024年,套管井占据市场主导地位。
- 根据服务类型,市场分为完井、修井和测井。2024年,测井领域占据市场主导地位。
- 根据应用,市场分为陆上和海上。2024年,陆上市场占据主导地位。
有线服务市场份额(按地区)分析
有线服务市场分为五大区域:北美、欧洲、亚太地区 (APAC)、中东和非洲 (MEA) 以及南美和中美 (SAM)。2024 年,北美占据市场主导地位,其次是中东和非洲 (MEA) 和亚太地区 (APAC)。
北美有线服务市场分为美国、加拿大和墨西哥。该地区是世界领先的石油和天然气出口区之一。美国占全球石油产量的18%以上,这表明该地区在陆上和海上拥有大量油田。需要油气田来评估该地区油田的生产能力。石油和天然气钻井平台数量的增加推动了对有线服务的需求,以最大限度地提高油藏知识并指导该地区油气田的生产决策。该地区在修井、测井和完井活动中对有线服务的需求激增,正在推动有线服务市场的增长。此外,预计原油产量的上升将在未来几年产生对有线服务的新需求。
根据国际能源署 (IEA) 的数据,中东和北非地区约 95% 的电力来自石油和天然气。该地区的火力发电厂每天消耗超过 2900 亿立方米的天然气,相当于该地区天然气产量的三分之一以上,以及 175 万桶石油。中东和北非地区的生产经济体依赖化石燃料,与全球平均水平相比,其发电碳强度增加了约五分之一。因此,该地区推动了固定电话服务的采购。2023 年 5 月,阿布扎比国家石油公司 (ADNOC) 授予了三份总额为 40 亿美元的合同,旨在减少碳排放,并在 2030 年前实现约 500 万桶/日 (mb/d) 的产能。石油和天然气公司对油藏情报、可操作的有线数据、生产评估、井下问题的评估和诊断、获取全方位测井数据等提高产量的需求不断增长,这推动了有线服务的采用。此外,海上石油和天然气钻探活动的增加、在这些地点建立钻井的新地点的发现以及海上石油和天然气生产的产量目标的提高,正在推动中东和非洲地区市场的增长。2023 年 1 月,总部位于新加坡的独立公司 Rex International 的子公司 Masirah Oil 宣布已完成在阿曼 50 区块的海上钻探活动。2023 年 10 月,钻井、工程和技术合作伙伴 KCA Deutag 在阿曼石油开发公司 (PDO) 仪式上宣布了其在阿曼制造的第一口本地制造的钻井平台。同样,2023 年 11 月,壳牌埃及公司宣布已完成其三口井勘探活动中的第一口井的钻探,该井位于地中海东北部 El-Amriya 区块的 Mina West。
有线服务市场区域洞察
Insight Partners 的分析师已详尽阐述了预测期内影响有线服务市场的区域趋势和因素。本节还讨论了北美、欧洲、亚太地区、中东和非洲以及南美和中美洲的有线服务市场细分和地域分布。

- 获取有线服务市场的区域特定数据
有线服务市场报告范围
报告属性 | 细节 |
---|---|
2024年的市场规模 | 176.4亿美元 |
2031年的市场规模 | 283亿美元 |
全球复合年增长率(2025-2031) | 7.0% |
史料 | 2021-2023 |
预测期 | 2025-2031 |
涵盖的领域 | 按类型
|
覆盖地区和国家 | 北美
|
市场领导者和主要公司简介 |
|
有线服务市场参与者密度:了解其对业务动态的影响
有线服务市场正在快速增长,这得益于终端用户需求的不断增长,而这些需求的驱动因素包括消费者偏好的不断变化、技术进步以及对产品优势的认知度不断提高。随着需求的增长,企业正在扩展其产品线,不断创新以满足消费者需求,并利用新兴趋势,从而进一步推动市场增长。
市场参与者密度是指特定市场或行业内企业或公司的分布情况。它表明特定市场空间内竞争对手(市场参与者)的数量相对于其规模或总市值而言。
有线服务市场的主要运营公司有:
- MB石油服务有限责任公司
- 服务负载平衡
- 哈里伯顿公司
- 贝克休斯公司
- Geoplex
- 威德福国际公司
免责声明:以上列出的公司没有按照任何特定顺序排列。

- 获取有线服务市场顶级关键参与者概览
有线服务市场新闻和最新发展
有线服务市场评估通过收集一手和二手资料进行定性和定量数据,这些数据包括重要的公司出版物、协会数据和数据库。有线服务市场的主要发展如下:
- 壳牌公司授予哈里伯顿公司在巴西、苏里南和圣多美和普林西比的多个重要项目。在巴西,哈里伯顿与壳牌公司签署的合同标志着桑托斯盆地盐下层加托杜马托深水油田开发项目的重要里程碑。哈里伯顿公司因其在钻井建设、完井和干预方面的一体化方法而获此殊荣。(来源:壳牌,新闻稿,2025年5月)
- 哈里伯顿公司与巴西石油公司签订合同,为巴西提供一体化修井和海上封堵服务,包括流体、完井设备、电缆、松弛线、回流服务和连续油管。(来源:哈里伯顿,新闻稿,2024年8月)
有线服务市场报告覆盖范围和交付成果
“有线服务市场规模和预测(2025-2031)”对以下领域进行了详细的市场分析:
- 有线服务市场规模以及涵盖范围内所有关键细分市场的全球、区域和国家层面的预测
- 有线服务市场趋势以及市场动态,例如驱动因素、限制因素和关键机遇
- 详细的 PEST 和 SWOT 分析
- 有线服务市场分析涵盖主要市场趋势、全球和区域框架、主要参与者、法规和最新市场发展
- 行业格局和竞争分析,涵盖市场集中度、热图分析、知名参与者以及有线服务市场的最新发展
- 详细的公司简介
- 历史分析(2 年)、基准年、预测(7 年)及复合年增长率
- PEST 和 SWOT 分析
- 市场规模价值/数量 - 全球、区域、国家
- 行业和竞争格局
- Excel 数据集


Report Coverage
Revenue forecast, Company Analysis, Industry landscape, Growth factors, and Trends

Segment Covered
This text is related
to segments covered.

Regional Scope
North America, Europe, Asia Pacific, Middle East & Africa, South & Central America

Country Scope
This text is related
to country scope.
常见问题
Technological developments in wireline products & services is the future trends of the global wireline services market.
The North America held the largest market share in 2024, followed by MEA and APAC.
The global wireline services market is expected to reach US$ 28.30 billion in the year 2031.
The key players, holding majority shares, in global wireline services market MB Petroleum Services LLC.; Halliburton Co; Baker Hughes Co; Geoplex, Weatherford International Plc; SLB; NexTier Oilfield Services, Inc.; Superior Energy Services Inc; Archer Ltd.; Yulin Machinery Corporation.
The global wireline services market was valued at US$ 17.64 billion in 2024 and is projected to reach US$ 28.30 billion by 2031; it is expected to grow at a CAGR of 7.0% during 2025–2031.
Surging drilling and exploration of oil & gas fields and increasing oil and gas demand, increasing demand for wireline services to revitalize mature oil and gas fields, increasing offshore oil & gas industry developments in Asia, and Middle East & Africa are the driving factors impacting the global wireline services market.
The List of Companies - Wireline Services Market
- MB Petroleum Services LLC.
- Halliburton Co
- Baker Hughes Co
- Geoplex
- Weatherford International Plc
- SLB
- NexTier Oilfield Services, Inc.
- Superior Energy Services Inc
- Archer Ltd.
- Yulin Machinery Corporation
The Insight Partners performs research in 4 major stages: Data Collection & Secondary Research, Primary Research, Data Analysis and Data Triangulation & Final Review.
- Data Collection and Secondary Research:
As a market research and consulting firm operating from a decade, we have published and advised several client across the globe. First step for any study will start with an assessment of currently available data and insights from existing reports. Further, historical and current market information is collected from Investor Presentations, Annual Reports, SEC Filings, etc., and other information related to company’s performance and market positioning are gathered from Paid Databases (Factiva, Hoovers, and Reuters) and various other publications available in public domain.
Several associations trade associates, technical forums, institutes, societies and organization are accessed to gain technical as well as market related insights through their publications such as research papers, blogs and press releases related to the studies are referred to get cues about the market. Further, white papers, journals, magazines, and other news articles published in last 3 years are scrutinized and analyzed to understand the current market trends.
- Primary Research:
The primarily interview analysis comprise of data obtained from industry participants interview and answers to survey questions gathered by in-house primary team.
For primary research, interviews are conducted with industry experts/CEOs/Marketing Managers/VPs/Subject Matter Experts from both demand and supply side to get a 360-degree view of the market. The primary team conducts several interviews based on the complexity of the markets to understand the various market trends and dynamics which makes research more credible and precise.
A typical research interview fulfils the following functions:
- Provides first-hand information on the market size, market trends, growth trends, competitive landscape, and outlook
- Validates and strengthens in-house secondary research findings
- Develops the analysis team’s expertise and market understanding
Primary research involves email interactions and telephone interviews for each market, category, segment, and sub-segment across geographies. The participants who typically take part in such a process include, but are not limited to:
- Industry participants: VPs, business development managers, market intelligence managers and national sales managers
- Outside experts: Valuation experts, research analysts and key opinion leaders specializing in the electronics and semiconductor industry.
Below is the breakup of our primary respondents by company, designation, and region:
Once we receive the confirmation from primary research sources or primary respondents, we finalize the base year market estimation and forecast the data as per the macroeconomic and microeconomic factors assessed during data collection.
- Data Analysis:
Once data is validated through both secondary as well as primary respondents, we finalize the market estimations by hypothesis formulation and factor analysis at regional and country level.
- Macro-Economic Factor Analysis:
We analyse macroeconomic indicators such the gross domestic product (GDP), increase in the demand for goods and services across industries, technological advancement, regional economic growth, governmental policies, the influence of COVID-19, PEST analysis, and other aspects. This analysis aids in setting benchmarks for various nations/regions and approximating market splits. Additionally, the general trend of the aforementioned components aid in determining the market's development possibilities.
- Country Level Data:
Various factors that are especially aligned to the country are taken into account to determine the market size for a certain area and country, including the presence of vendors, such as headquarters and offices, the country's GDP, demand patterns, and industry growth. To comprehend the market dynamics for the nation, a number of growth variables, inhibitors, application areas, and current market trends are researched. The aforementioned elements aid in determining the country's overall market's growth potential.
- Company Profile:
The “Table of Contents” is formulated by listing and analyzing more than 25 - 30 companies operating in the market ecosystem across geographies. However, we profile only 10 companies as a standard practice in our syndicate reports. These 10 companies comprise leading, emerging, and regional players. Nonetheless, our analysis is not restricted to the 10 listed companies, we also analyze other companies present in the market to develop a holistic view and understand the prevailing trends. The “Company Profiles” section in the report covers key facts, business description, products & services, financial information, SWOT analysis, and key developments. The financial information presented is extracted from the annual reports and official documents of the publicly listed companies. Upon collecting the information for the sections of respective companies, we verify them via various primary sources and then compile the data in respective company profiles. The company level information helps us in deriving the base number as well as in forecasting the market size.
- Developing Base Number:
Aggregation of sales statistics (2020-2022) and macro-economic factor, and other secondary and primary research insights are utilized to arrive at base number and related market shares for 2022. The data gaps are identified in this step and relevant market data is analyzed, collected from paid primary interviews or databases. On finalizing the base year market size, forecasts are developed on the basis of macro-economic, industry and market growth factors and company level analysis.
- Data Triangulation and Final Review:
The market findings and base year market size calculations are validated from supply as well as demand side. Demand side validations are based on macro-economic factor analysis and benchmarks for respective regions and countries. In case of supply side validations, revenues of major companies are estimated (in case not available) based on industry benchmark, approximate number of employees, product portfolio, and primary interviews revenues are gathered. Further revenue from target product/service segment is assessed to avoid overshooting of market statistics. In case of heavy deviations between supply and demand side values, all thes steps are repeated to achieve synchronization.
We follow an iterative model, wherein we share our research findings with Subject Matter Experts (SME’s) and Key Opinion Leaders (KOLs) until consensus view of the market is not formulated – this model negates any drastic deviation in the opinions of experts. Only validated and universally acceptable research findings are quoted in our reports.
We have important check points that we use to validate our research findings – which we call – data triangulation, where we validate the information, we generate from secondary sources with primary interviews and then we re-validate with our internal data bases and Subject matter experts. This comprehensive model enables us to deliver high quality, reliable data in shortest possible time.