أدوات كشف الاحتيال في الإعلانات تحليل السوق والتنبؤ بها حسب الحجم والمشاركة والنمو والاتجاهات 2028
البيانات التاريخية : | سنة الأساس : | فترة التنبؤ :توقعات سوق أدوات كشف الاحتيال الإعلاني حتى عام 2028 - تأثير كوفيد-19 والتحليل العالمي حسب النوع (موقع ويب وهاتف محمول) والمستخدم النهائي (التجارة الإلكترونية، والسفر، والتمويل، والألعاب، وغيرها)
- تاريخ التقرير : Mar 2026
- رمز التقرير : TIPRE00019813
- الفئة : التكنولوجيا والإعلام والاتصالات
- الحالة : قادم
- تنسيقات التقارير المتاحة :


- عدد الصفحات : 150
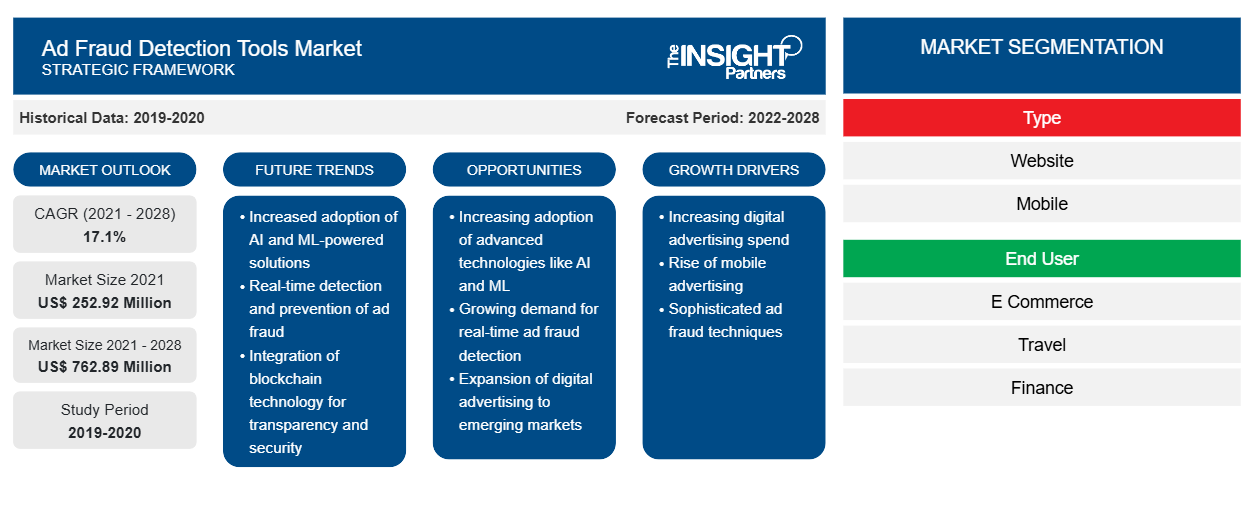
[تقرير بحثي] من المتوقع أن ينمو سوق أدوات الكشف عن الاحتيال الإعلاني من 252.92 مليون دولار أمريكي في عام 2021 إلى 762.89 مليون دولار أمريكي بحلول عام 2028؛ ومن المتوقع أن ينمو بمعدل نمو سنوي مركب قدره 17.1٪ خلال الفترة من 2021 إلى 2028.
مع تزايد عدد مستخدمي الإنترنت، يتزايد الطلب على الإعلانات الرقمية بسبب العديد من المنصات الرقمية للإعلان. أصبحت الإعلانات الرقمية الآن أكثر تطوراً وشخصية وأهمية. يقضي المستهلكون وقتًا أطول على الإنترنت أكثر من أي وقت مضى، وتوفر الإعلانات الرقمية طريقة مثالية للوصول إلى المستهلكين متعددي الأجهزة ومتعددي القنوات. كما أصبح المسوقون قادرين على استهداف المستهلكين بدقة متناهية كما لم يحدث من قبل. لم تعد العلامات التجارية مقتصرة على التركيبة السكانية والبيانات الديموغرافية للشركات فحسب، بل يمكنها استهداف الجمهور الدقيق الأكثر احتمالاً للشراء بناءً على آلاف المتغيرات المتعلقة بأسلوب الحياة والشخصية والسلوكيات وتجزئة نية الشراء. يعد الهاتف المحمول المحرك الرئيسي للنمو في الإعلانات الرقمية في الوقت الحاضر، حيث يمثل أكثر من 70٪ من الإعلانات الرقمية وأكثر من ربع إجمالي الإنفاق الإعلامي، وفقًا لبيانات موقع V12. علاوة على ذلك، يقضي الأمريكيون أكثر من 10 ساعات يوميًا على الشاشات، ويقضي حوالي خمس من هذه الساعات على هواتفهم الذكية.
يؤدي ظهور الإعلانات الرقمية إلى زيادة الاحتيال في الإعلانات الرقمية كما تسبب أيضًا في العديد من خسائر الإيرادات للشركات. على سبيل المثال، من المتوقع أن يكلف الاحتيال في الإعلانات الرقمية العلامات التجارية حوالي 44 مليار دولار أمريكي بسبب الأنشطة الاحتيالية بحلول عام 2022 ويصل إلى 45٪ من إجمالي الإنفاق، وفقًا لبيانات mFilterIt لشهر نوفمبر 2021. علاوة على ذلك، يطور المحتالون باستمرار تقنيات لخداع النظام البيئي، في حين تتطور شركات التكنولوجيا باستمرار لإيجاد طرق لوقف هؤلاء المحتالين. لذلك، لمنع حدوث مثل هذه الاحتيالات الإعلانية مع العلامات التجارية والمعلنين، تقدم شركات مثل mFilterIt حلولاً شاملة للاحتيال في الإعلانات الرقمية. يستخدم الحل خوارزميات معقدة لمراقبة المساحات السطحية وكذلك المظلمة على الويب بنشاط، ثم استخدام الذكاء الاصطناعي والتعلم الآلي لتحويلها إلى تقارير ذات مغزى وقابلة للتنفيذ تساعد أمناء العلامة التجارية وأصحاب المجتمع على الحماية بشكل استباقي من أي ضرر محتمل لهوية وخصوصية أعضاء مجتمعهم. وبالتالي، مع الإعلانات الرقمية المتزايدة، تتزايد أنشطة الاحتيال في الإعلانات الرقمية، مما يدفع الحاجة إلى أدوات الكشف عن الاحتيال في الإعلانات على مستوى العالم.
قم بتخصيص هذا التقرير ليناسب متطلباتك
ستحصل على تخصيص لأي تقرير - مجانًا - بما في ذلك أجزاء من هذا التقرير، أو تحليل على مستوى الدولة، وحزمة بيانات Excel، بالإضافة إلى الاستفادة من العروض والخصومات الرائعة للشركات الناشئة والجامعات
سوق أدوات الكشف عن الاحتيال الإعلاني: رؤى استراتيجية
-
احصل على أهم اتجاهات السوق الرئيسية لهذا التقرير.ستتضمن هذه العينة المجانية تحليلاً للبيانات، بدءًا من اتجاهات السوق وحتى التقديرات والتوقعات.
تأثير جائحة كوفيد-19 على سوق أدوات الكشف عن الاحتيال الإعلاني العالمي
في عام 2020، مع سيناريو تفشي مرض كوفيد-19، أدى الإغلاق الوطني لكل دولة إلى زيادة نطاق سوق التقنيات الرقمية. يستخدم عدد أكبر من الأشخاص الآن منصة رقمية واحدة أو أكثر لأسباب عديدة، مثل العمل من المنزل (WFH)، أو المعاملات عبر الإنترنت من خلال التطبيقات الرقمية للبنوك، أو عبر محافظ الأموال المحمولة/الرقمية. ومع هذا، تتزايد أيضًا عمليات الاحتيال الإعلانية من خلال نقرة واحدة فقط. وقد أدى ذلك إلى خسائر مختلفة في الإيرادات للشركة. على سبيل المثال، تُظهر البيانات من موقع matchseries.com أن الخسائر العالمية الناجمة عن الاحتيال الإعلاني في عام 2020 بلغت ما مجموعه 35 مليار دولار أمريكي، بينما وجد تقرير Campaign Asia المنشور في ديسمبر 2020 أن الاحتيال الإعلاني يسرق 20٪ من الإنفاق الإعلاني عبر الإنترنت في العالم. تساعد هذه الأرقام في توضيح مدى المشكلة التي يخلقها الاحتيال الإعلاني للشركات، والمجموعة الواسعة من منصات الإعلانات المختلفة والخيارات المتاحة للشركات تعني أن مستوى الهدر يمكن أن يختلف بشكل كبير. لا تقع الشركات الصغيرة والمتوسطة الحجم ضحية لمثل هذه الكميات الكبيرة من حركة المرور الاحتيالية فحسب، بل تتأثر أيضًا العديد من أكبر الشركات في العالم. لذلك، تم أيضًا اعتماد أدوات الكشف عن الاحتيال الإعلاني من قبل المزيد من الشركات. وبالتالي، شهد سوق أدوات الكشف عن الاحتيال الإعلاني العالمي نموًا إيجابيًا في عام 2020.
رؤى السوق حول أدوات الكشف عن الاحتيال في الإعلانات
زيادة استخدام الذكاء الاصطناعي والتعلم الآلي لتعزيز سوق أدوات الكشف عن الاحتيال الإعلاني خلال فترة التوقعات
يساعد استخدام الذكاء الاصطناعي والتعلم الآلي في معالجة أحدث أنواع الاحتيال الإعلاني بسبب قدرات التعلم الذاتي. يتبع نظام اكتشاف الاحتيال المدعوم بالذكاء الاصطناعي خوارزمية تعلم آلي تساعد النظام على التعلم من الأنشطة المشبوهة (النقرات، ومواضع الإعلانات) وبناء طبقات من الحماية. لا يعمل هذا النوع من النظام على تحسين نفسه وتكييفه لمعالجة أحدث أنواع الاحتيال الإعلاني فحسب، بل يمكنه أيضًا التعرف على الأنماط في مجموعة أكثر شمولاً من نقاط البيانات مقارنة بالأنظمة التقليدية. في المتوسط، يمكن لنظام اكتشاف الاحتيال القائم على الذكاء الاصطناعي تحليل أكثر من 80 بُعدًا في وقت واحد ويمكنه اكتشاف حتى أكثر عمليات الاحتيال الإعلانية تطورًا، مثل احتيال إعلان Methbot.
سوق أدوات الكشف عن الاحتيال الإعلاني – رؤى السوق القائمة على النوع
بناءً على النوع، ينقسم سوق أدوات الكشف عن الاحتيال في الإعلانات إلى موقع ويب وجهاز محمول. في عام 2021، قاد قطاع الأجهزة المحمولة سوق أدوات الكشف عن الاحتيال في الإعلانات واستحوذ على حصة سوقية أكبر.
سوق أدوات الكشف عن الاحتيال الإعلاني – رؤى السوق المستندة إلى المستخدم النهائي
بناءً على المستخدم النهائي، يتم تقسيم سوق أدوات الكشف عن الاحتيال الإعلاني إلى التجارة الإلكترونية والسفر والتمويل والألعاب وغيرها. في عام 2021، قاد قطاع التمويل سوق أدوات الكشف عن الاحتيال الإعلاني واستحوذ على أكبر حصة في السوق.
يتبنى اللاعبون العاملون في سوق أدوات الكشف عن الاحتيال في الإعلانات استراتيجيات مثل عمليات الدمج والاستحواذ والمبادرات السوقية للحفاظ على مواقعهم في السوق. وفيما يلي قائمة ببعض التطورات التي قام بها اللاعبون الرئيسيون:
- في فبراير 2021، استحوذت شركة Applovin Corporation على شركة Adjust GmbH. سيوفر هذا الاستحواذ أفضل الحلول في حزمة واحدة، مما يضع حلول القياس والتحليلات والنمو وتحقيق الربح في متناول كل مطور تطبيقات حول العالم.
- في فبراير 2020، حققت شركة App Samurai Inc. (منصة نمو الأجهزة المحمولة) استثمارًا بقيمة 2.4 مليون دولار أمريكي في جولة تمويلية بقيادة 212 مشروعًا، مع شركة Collective Spark و500 Startups وDegerhan Usluel، ليصل إجمالي الاستثمار إلى 4.6 مليون دولار أمريكي. ستستخدم شركة App Samurai التمويل لتطوير محفظة منتجاتها والعمل نحو التوسع العالمي.
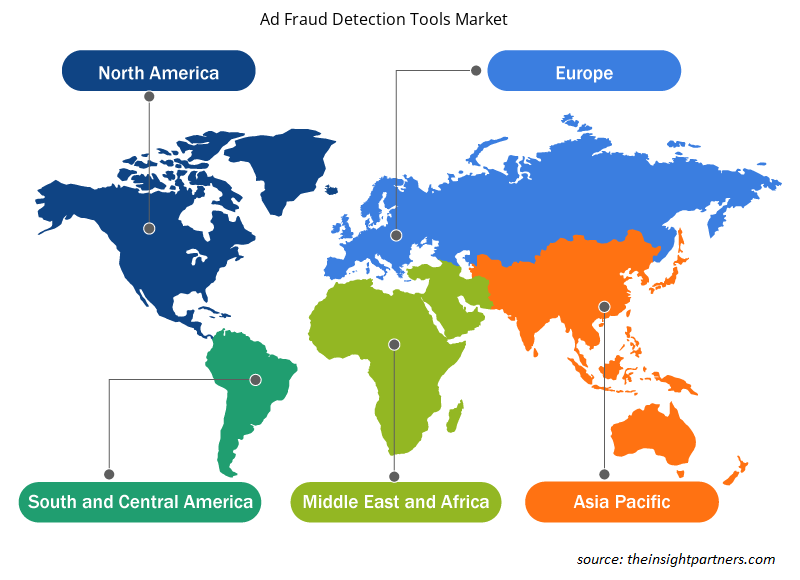
رؤى إقليمية حول سوق أدوات الكشف عن الاحتيال في الإعلانات
لقد قام المحللون في Insight Partners بشرح الاتجاهات والعوامل الإقليمية المؤثرة على سوق أدوات الكشف عن الاحتيال الإعلاني طوال فترة التوقعات بشكل شامل. يناقش هذا القسم أيضًا قطاعات سوق أدوات الكشف عن الاحتيال الإعلاني والجغرافيا في جميع أنحاء أمريكا الشمالية وأوروبا ومنطقة آسيا والمحيط الهادئ والشرق الأوسط وأفريقيا وأمريكا الجنوبية والوسطى.
- احصل على البيانات الإقليمية المحددة لسوق أدوات الكشف عن الاحتيال الإعلاني
تقرير نطاق سوق أدوات الكشف عن الاحتيال الإعلاني
| سمة التقرير | تفاصيل |
|---|---|
| حجم السوق في عام 2021 | 252.92 مليون دولار أمريكي |
| حجم السوق بحلول عام 2028 | 762.89 مليون دولار أمريكي |
| معدل النمو السنوي المركب العالمي (2021 - 2028) | 17.1% |
| البيانات التاريخية | 2019-2020 |
| فترة التنبؤ | 2022-2028 |
| القطاعات المغطاة |
حسب النوع
|
| المناطق والدول المغطاة |
أمريكا الشمالية
|
| قادة السوق وملفات تعريف الشركات الرئيسية |
|
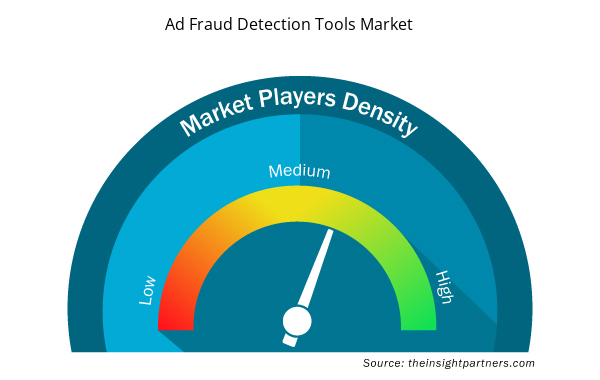
كثافة اللاعبين في سوق أدوات الكشف عن الاحتيال الإعلاني: فهم تأثيرها على ديناميكيات الأعمال
يشهد سوق أدوات الكشف عن الاحتيال الإعلاني نموًا سريعًا، مدفوعًا بالطلب المتزايد من المستخدم النهائي بسبب عوامل مثل تفضيلات المستهلكين المتطورة والتقدم التكنولوجي والوعي المتزايد بفوائد المنتج. ومع ارتفاع الطلب، تعمل الشركات على توسيع عروضها والابتكار لتلبية احتياجات المستهلكين والاستفادة من الاتجاهات الناشئة، مما يؤدي إلى زيادة نمو السوق.
تشير كثافة اللاعبين في السوق إلى توزيع الشركات أو المؤسسات العاملة في سوق أو صناعة معينة. وهي تشير إلى عدد المنافسين (اللاعبين في السوق) الموجودين في مساحة سوق معينة نسبة إلى حجمها أو قيمتها السوقية الإجمالية.
الشركات الرئيسية العاملة في سوق أدوات الكشف عن الاحتيال الإعلاني هي:
- شركة AppsFlyer المحدودة
- شركة ادجست المحدودة
- فرع القياسات، المحدودة
- برنامج FraudScore
- Interceptd (تطبيق Samurai Inc.)
إخلاء المسؤولية : الشركات المذكورة أعلاه ليست مرتبة بأي ترتيب معين.
- احصل على نظرة عامة على أهم اللاعبين الرئيسيين في سوق أدوات الكشف عن الاحتيال الإعلاني
نبذة عن الشركة
- شركة AppsFlyer المحدودة
- شركة ادجست المحدودة
- فرع القياسات، المحدودة
- برنامج FraudScore
- Interceptd (تطبيق Samurai Inc.)
- شركة ماشين للإعلان المحدودة
- أداء[cb]، ذ.م.م
- شركة سكالر
- مختبرات سينجولار، المحدودة
- شركة ترافيك جارد المحدودة
- ADEX (شركة ساموكالي المحدودة)

أنكيتا خبيرة ديناميكية في أبحاث السوق والاستشارات، تتمتع بخبرة تزيد عن 8 سنوات في قطاعات التكنولوجيا والإعلام وتكنولوجيا المعلومات والاتصالات والإلكترونيات وأشباه الموصلات. وقد قادت ونفذت بنجاح أكثر من 100 مهمة استشارية وبحثية لعملاء عالميين مثل مايكروسوفت وأوراكل وشركة NEC وSAP وKPMG وExpeditors International. تشمل كفاءاتها الأساسية تقييم السوق، وتحليل البيانات، والتنبؤ، وصياغة الاستراتيجيات، والاستخبارات التنافسية، وكتابة التقارير.
أنكيتا بارعة في إدارة دورات المشاريع الكاملة، بدءًا من تصميم عروض ما قبل البيع ومناقشات العملاء، وصولًا إلى تقديم رؤى عملية بعد البيع. كما أنها ماهرة في إدارة فرق متعددة الوظائف، وهيكلة وحدات بحثية معقدة، ومواءمة الحلول مع أهداف العمل الخاصة بالعملاء. وقد مكنتها مهاراتها الممتازة في التواصل والقيادة والعرض التقديمي من تحقيق نتائج قيّمة باستمرار في بيئات سوقية سريعة التطور.
- التحليل التاريخي (سنتان)، سنة الأساس، التوقعات (7 سنوات) مع معدل النمو السنوي المركب
- تحليل PEST و SWOT
- حجم السوق والقيمة / الحجم - عالمي، إقليمي، بلد
- الصناعة والمنافسة
- مجموعة بيانات إكسل
شهادات العملاء
تقرير سوق أنظمة SCADA من Insight Partners شامل، ويقدم رؤى قيّمة حول الاتجاهات الحالية والتوقعات المستقبلية. تميّز الفريق باحترافية عالية وسرعة في الاستجابة ودعم مستمر طوال الوقت. نحن راضون جدًا ونوصي بشدة بخدماتهم.
ران كيديم شريك, شركة ريالي تكنولوجيز المحدودةطلبتُ تقريرًا عن سوق برمجيات محدد، وأعدّه الفريق في غضون أيام قليلة. كانت المعلومات ذات صلة وثيقة وعرضها جيد. ثم طلبتُ بعض التعديلات والإضافات على التقرير. وكان الفريق متجاوبًا للغاية، وحصلتُ على التقرير النهائي في أقل من أسبوع.
جان هيرفيه جين رئيس مجلس الإدارة, فيوتشر أناليتيكاعملنا مع شركة "إنسايت بارتنرز" لإجراء دراسة سوقية وتوقعات مهمة. زودونا برؤى واضحة حول الفرص والمخاطر، مما ساعدنا في صياغة خططنا. كانت أبحاثهم سهلة الاستخدام ومبنية على بيانات دقيقة، مما ساعدنا على اتخاذ قرارات ذكية وواثقة. نوصي بهم بشدة.
بيوش ناجبال نائب الرئيس الأول, شعاع عالي عالميقدّمت شركة Insight Partners أبحاثًا سوقية ثاقبة ومنظمة جيدًا بخبرة واسعة في هذا المجال. تميّز فريقهم بالاحترافية وسرعة الاستجابة طوال الوقت. وسهّل موقعهم الإلكتروني سهل الاستخدام الوصول إلى تقارير القطاع. نوصي بهم بشدة لخدمات بحثية موثوقة وعالية الجودة.
يوكيهيكو أداتشي المدير التنفيذي, ديب بلو، ذ.م.م.هذه أول مرة أشتري فيها تقرير سوق من The Insight Partners. رغم أنني كنت مترددًا في البداية، إلا أنني زرت موقعهم الإلكتروني وشعرت براحة أكبر للمخاطرة وشراء تقرير السوق. أنا راضٍ تمامًا عن جودة التقرير وخدمة العملاء. كانت لديّ عدة أسئلة وتعليقات حول التقرير الأولي، ولكن بعد بضع محادثات عبر البريد الإلكتروني مع محللهم، أعتقد أن لديّ تقريرًا يمكنني استخدامه كمدخل لعملية التخطيط الاستراتيجي لدينا. شكرًا جزيلاً لكم على تخصيص وقتكم الإضافي وجعل هذه التجربة إيجابية. سأوصي بخدماتكم للآخرين بالتأكيد، وستكونون أول من ألجأ إليه عندما نحتاج إلى المزيد من بيانات السوق.
جون سوزوكي الرئيس والرئيس التنفيذي وعضو مجلس الإدارة, بي كيه تكنولوجيزأود أن أقدّر دعمكم واحترافيتكم في الاستجابة لطلبي للحصول على معلومات بشأن سوق التشخيص المخبري للأمراض المعدية في نيجيريا. كما أُقدّر صبركم وتوجيهكم، واستعدادكم لتقديم خصم، مما مكّننا في النهاية من إتمام الصفقة. أتطلع إلى التعامل مع "ذا إنسايت بارتنرز" مستقبلًا، كل ذلك بفضل الانطباع الذي تركتموه لديّ نتيجةً لهذا اللقاء الأول.
الدكتور تشيجيوك أونيا المدير الإداري, شركة باينكريست للرعاية الصحية المحدودةسبب الشراء
- اتخاذ قرارات مدروسة
- فهم ديناميكيات السوق
- تحليل المنافسة
- رؤى العملاء
- توقعات السوق
- تخفيف المخاطر
- التخطيط الاستراتيجي
- مبررات الاستثمار
- تحديد الأسواق الناشئة
- تحسين استراتيجيات التسويق
- تعزيز الكفاءة التشغيلية
- مواكبة التوجهات التنظيمية


 احصل على عينة مجانية ل - سوق أدوات كشف الاحتيال الإعلاني