استراتيجيات سوق بطاقات وقود الطيران، وأفضل اللاعبين، وفرص النمو، والتحليل والتنبؤ بحلول عام 2030
البيانات التاريخية : 2020-2021 | سنة الأساس : 2022 | فترة التنبؤ : 2022-2030حجم سوق بطاقات وقود الطيران وتوقعاته (2020-2030)، والحصة العالمية والإقليمية، والاتجاهات، وفرص النمو. يغطي التقرير: حسب النوع (تاجر، علامة تجارية)؛ والتطبيق (تجاري، خاص)؛ والجغرافيا.
- تاريخ التقرير : Dec 2023
- رمز التقرير : TIPRE00031432
- الفئة : الخدمات المصرفية والخدمات المالية والتأمين
- الحالة : نُشرت
- تنسيقات التقارير المتاحة :


- عدد الصفحات : 142
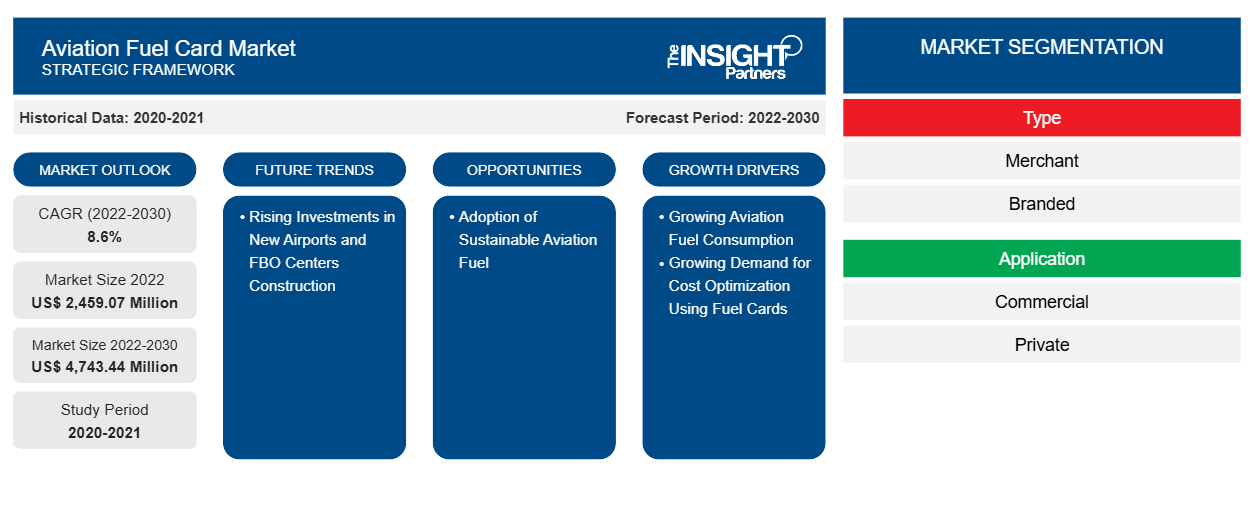
من المتوقع أن يصل حجم سوق بطاقات وقود الطيران إلى 4,743.44 مليون دولار أمريكي بحلول عام 2030 من 2,459.07 مليون دولار أمريكي في عام 2022. ومن المتوقع أن يسجل السوق معدل نمو سنوي مركب بنسبة 8.6٪ في الفترة 2022-2030.
تقليديًا، كانت صناعة الطيران تقوم بسداد مدفوعات الوقود بطرق متنوعة، اعتمادًا على الظروف الاقتصادية لصناعة الوقود وشركات الطيران والاتفاقيات القائمة. غالبًا ما تشتري شركات الطيران وصناعات الطيران الأخرى الوقود في السوق الفورية، إما مباشرة من شركات النفط أو من خلال وسطاء الوقود. في مثل هذه المواقف، من المرجح أن تدفع شركة الطيران ثمن الوقود بمزيج من النقد والائتمان. بشكل عام، سيتم تحديد طريقة الدفع المستخدمة من قبل صناعة الطيران للحصول على الوقود من خلال مجموعة متنوعة من المعايير، مثل حجم الشركة وموقعها واستراتيجية الشراء وظروف السوق والإمكانيات المتاحة. يمكن للبطاقات المؤسسية ذات الحد الأقصى المرتفع مع برنامج إدارة التكاليف المتكامل أن تجعل مراقبة مدفوعات الوقود أسهل بكثير. تتيح البطاقات ذات الحد الأقصى المرتفع للشركات مرونة أكبر في الدفع، مما يعني أنها يمكن أن تستمر في العمل دون مواجهة تأخيرات البنوك ورسوم الإقراض. بالإضافة إلى ذلك، على عكس بطاقات البنزين، والتي نادرًا ما ترتبط ببرنامج إدارة التكاليف ، تقدم بطاقات الائتمان المؤسسية ذات الحد الأقصى المرتفع من شركات إدارة الإنفاق تجربة متكاملة تمامًا. جعلت بطاقات الائتمان المؤسسية من السهل توحيد فواتير الوقود وتبسيط عملية إدارة النفقات الإجمالية. بدلاً من الاعتماد على طرق دفع مختلفة أو استرداد الأموال، يمكن استخدام بطاقة ائتمان واحدة لجميع المشتريات المتعلقة بالوقود، مما يجعل من الأسهل تتبع وإدارة الإنفاق. يمكن أن يساعد دمج نفقات الوقود ببطاقة ائتمان تجارية في تطوير علاقات أقوى مع مزودي الوقود. يمكن لشركات الطيران التي تستخدم بطاقة واحدة بشكل متكرر لمعاملات الوقود أن تتمتع بقوة تفاوضية أكبر مع مزودي الوقود من حيث الخصومات على الحجم أو الشروط المواتية. وبالتالي، فإن الفوائد التي توفرها الطرق البديلة الأخرى تعيق نمو سوق بطاقات وقود الطيران .
تحليل سوق بطاقات وقود الطيران
تتخذ العديد من شركات إنتاج الوقود وشركات الطيران مبادرات لتطوير وتبني وقود الطيران المستدام. في عام 2023، في معرض دبي للطيران، وقع مسؤولون من شركة بوينج وشركة زيرو بتروليوم اتفاقية لتسريع تطوير وقود الطيران المستدام الاصطناعي. في عام 2023، ساعدت شركة نستي مطار ترولهتان-فينيرسبورج وشركة الطيران فاستفليج لتصبح أول شركة طيران في العالم تستخدم وقود الطيران المستدام في جميع الرحلات الجوية. في عام 2023، وافقت طيران الإمارات على توريد ما يقرب من 300 ألف جالون من وقود الطيران المستدام المخلوط إلى المركز الدولي لشركة الطيران في دبي (DXB) من خلال شراكة مع شركة شل للطيران. ومن المتوقع أن تؤدي مثل هذه المبادرات إلى زيادة اعتماد وقود الطيران المستدام. يمكن لموردي بطاقات وقود الطيران توسيع أعمالهم من خلال تقديم عروض وخصومات جذابة على شراء وقود الطيران المستدام. سيؤدي هذا في النهاية إلى زيادة اعتماد واستخدام بطاقات وقود الطيران. علاوة على ذلك، من خلال الشراكة مع المشغلين الثابتين، يمكن لمقدمي خدمات بطاقات الوقود توسيع الشبكة لتزويد وقود الطيران المستدام. وبالتالي، من المتوقع أن يوفر ارتفاع معاملات الوقود المستدام للطيران فرصًا واسعة لنمو سوق بطاقات الوقود للطيران خلال الفترة المتوقعة.
نظرة عامة على سوق بطاقات وقود الطيران
إن دور موردي بطاقات الوقود في النظام البيئي لسوق بطاقات وقود الطيران أمر بالغ الأهمية لضمان الأداء السلس وموثوقية بطاقات الوقود. يلعب موردو بطاقات وقود الطيران دورًا مهمًا في تقديم خدمات بطاقات الوقود للمستخدمين النهائيين مثل شركات الطيران التجارية والخاصة. يضمن موردو بطاقات الوقود دورًا آمنًا وفعالًا في عمليات الدفع لوقود الطيران. يُطلق على كبار موردي الوقود الذين يقدمون خدمات بطاقات الوقود مصطلح موردي الوقود ذوي العلامات التجارية، بما في ذلك BP plc وShell Global وExxonMobil وTitan Aviation Fuels وJio-BP وAEGFUELS وTotalEnergies Aviation. تتحمل هذه الكيانات مسؤولية توريد وقود الطيران وبطاقات وقود الطيران بأنفسهم وبالتالي ضمان سلسلة توريد بطاقات وقود الطيران الموثوقة. يُطلق على الأطراف الثالثة والشركات الخاصة التي تقدم خدمات بطاقات الوقود مصطلح موردي وقود التجار، بما في ذلك World Fuel Services وCSI global-fleet وAviation Pros وAvfuel Corporation. موردو بطاقات وقود التجار هم كيانات تشارك في شراكة أو تعاون مع كبار موردي وقود الطيران وتضمن عملية دفع سلسة وآمنة. تتضمن هذه الشراكة أو التعاون دمج الأنظمة لتسهيل المعاملات الفعالة والحفاظ على إمدادات وقود موثوقة.
قم بتخصيص هذا التقرير ليناسب متطلباتك
ستحصل على تخصيص لأي تقرير - مجانًا - بما في ذلك أجزاء من هذا التقرير، أو تحليل على مستوى الدولة، وحزمة بيانات Excel، بالإضافة إلى الاستفادة من العروض والخصومات الرائعة للشركات الناشئة والجامعات
سوق بطاقات وقود الطيران: رؤى استراتيجية
-
احصل على أهم اتجاهات السوق الرئيسية لهذا التقرير.This FREE sample will include data analysis, ranging from market trends to estimates and forecasts.
Aviation Fuel Card Market Drivers and Opportunities
Increasing Aviation Fuel Consumption
Due to the high demand for air travel, overall fuel consumption has increased. In 2022, US airlines carried 194 million more passengers than in 2021, an increase of 30% year on year. From January to December of 2022, US airlines handled 853 million passengers, up from 658 million in 2021 and 388 million in 2020. In 2021, the European Union (EU) experienced a significant rebound in air travel as the total number of passengers reached 373 million. This figure reflects a remarkable increase of 34.9% compared to the previous year, 2020. The surge in air passenger numbers was observed in Croatia, which experienced a remarkable increase of 84% in comparison to the 2021. Furthermore, Cyprus and Greece recorded substantial growth rates of 104.8% and 85.9%, respectively. This surge in the number of passengers, particularly in countries such as Croatia, Cyprus, and Greece, highlights the growing demand for air travel and the subsequent need for fuel.
Rising Investments in New Airport and Fixed Base Operator Center Construction
Various developed and developing countries across the globe are focusing on increasing their total number of airports. In 2023, the government of Vietnam intends to build more than 30 airports by 2030 in order to enhance tourism and trade. The country has established 22 airports; however, the government is focused on constructing new airports in order to accommodate the growing number of aircraft. The Vietnamese government approved the building of the Long Thanh International Airport in 2021, with completion scheduled for 2025. The Long Thanh International Airport will be Vietnam's largest airport, with a capacity of up to 100 million people per year. The government aims to expand to more than 30 airports by 2030, which demonstrates the country's commitment to developing its aviation industry. In 2023, Saudi Arabia announced the expansion of its domestic aviation industry, which will require an investment of US$ 100 billion. In 2023, India announced investments of US$ 12 billion in airports over the next two years, including orders for hundreds of new planes to fulfill surging travel demand, which is putting a burden on current infrastructure.
Aviation Fuel Card Market Report Segmentation Analysis
Key segments that contributed to the derivation of the Aviation Fuel Card Market analysis are type, application, and geography.
- Based on type, the Aviation Fuel Card Market has been segmented into merchant and branded. The merchant segment held a larger market share in 2022.
- By application, the Aviation Fuel Card Market has been segmented into commercial and private. The commercial segment held the largest share of the market in 2022.
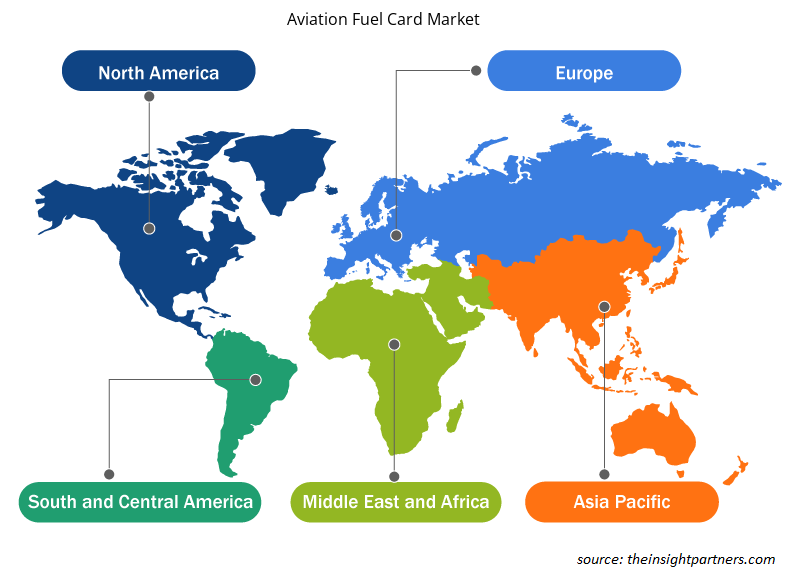
Aviation Fuel Card Market Share Analysis by Geography
The geographic scope of the Aviation Fuel Card Market report is mainly divided into five regions: North America, Europe, Asia Pacific, Middle East & Africa, and South America.
North America has dominated the Aviation Fuel Card Market in 2022, and it is expected to retain its dominance during the forecast period as well. The North America aviation fuel card industry is mainly driven by the growing awareness of the fuel card concept. Moreover, the growing aviation industry in countries such as the US and Canada is further driving the aviation fuel card market. The aviation industry is one of the notable industries in the US. As per the data published by the Airlines for America in 2023, commercial aviation accounted for 5% of US GDP and US$ 1.25 trillion in 2022. In addition, a large network of airports and fixed base operators in the US has supported the increased use of aviation fuel cards. In 2022, the US operated more than 5,100 public airports and 14,850 private airports. The air transportation industry contributes significantly to the Canadian economy. As per the International Air Transport Association (IATA), the industry contributed US$ 37 billion to Canadian GDP in 2018. Rising aviation fuel consumption and increasing aviation prices are driving the aviation fuel card market in Mexico. In June 2022, state-owned Pemex's wholesale jet fuel prices increased dramatically. The US held the largest share in the North America aviation fuel card market in 2022.
Aviation Fuel Card Market Regional Insights
The regional trends and factors influencing the Aviation Fuel Card Market throughout the forecast period have been thoroughly explained by the analysts at Insight Partners. This section also discusses Aviation Fuel Card Market segments and geography across North America, Europe, Asia Pacific, Middle East and Africa, and South and Central America.
- Get the Regional Specific Data for Aviation Fuel Card Market
Aviation Fuel Card Market Report Scope
| Report Attribute | Details |
|---|---|
| Market size in 2022 | US$ 2,459.07 Million |
| Market Size by 2030 | US$ 4,743.44 Million |
| Global CAGR (2022-2030) | 8.6% |
| Historical Data | 2020-2021 |
| Forecast period | 2022-2030 |
| Segments Covered |
By Type
|
| Regions and Countries Covered |
North America
|
| Market leaders and key company profiles |
|
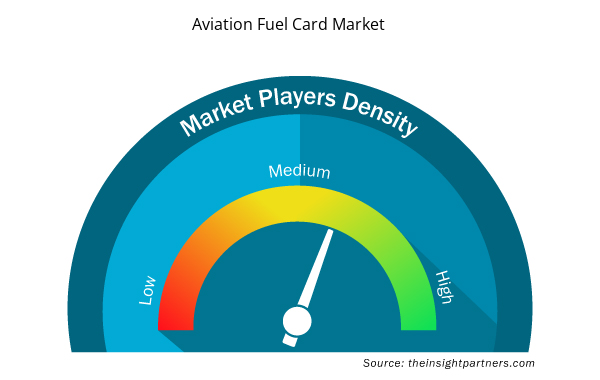
Aviation Fuel Card Market Players Density: Understanding Its Impact on Business Dynamics
يشهد سوق بطاقات وقود الطيران نموًا سريعًا، مدفوعًا بالطلب المتزايد من المستخدم النهائي بسبب عوامل مثل تفضيلات المستهلكين المتطورة والتقدم التكنولوجي والوعي المتزايد بفوائد المنتج. ومع ارتفاع الطلب، تعمل الشركات على توسيع عروضها والابتكار لتلبية احتياجات المستهلكين والاستفادة من الاتجاهات الناشئة، مما يؤدي إلى زيادة نمو السوق.
تشير كثافة اللاعبين في السوق إلى توزيع الشركات أو المؤسسات العاملة في سوق أو صناعة معينة. وهي تشير إلى عدد المنافسين (اللاعبين في السوق) الموجودين في مساحة سوق معينة نسبة إلى حجمها أو قيمتها السوقية الإجمالية.
الشركات الرئيسية العاملة في سوق بطاقات وقود الطيران هي:
- شركة شل المحدودة
- شركة بي بي المحدودة
- مجموعة الطاقة المترابطة ذ.م.م
- مجموعة فيفا للطاقة المحدودة
- شركة تيتان للوقود الجوي
إخلاء المسؤولية : الشركات المذكورة أعلاه ليست مرتبة بأي ترتيب معين.
- احصل على نظرة عامة على أهم اللاعبين الرئيسيين في سوق بطاقات وقود الطيران
أخبار سوق بطاقات وقود الطيران والتطورات الأخيرة
يتم تقييم سوق بطاقات وقود الطيران من خلال جمع البيانات النوعية والكمية بعد البحث الأولي والثانوي، والتي تتضمن منشورات الشركات المهمة وبيانات الجمعيات وقواعد البيانات. فيما يلي قائمة بالتطورات في سوق بطاقات وقود الطيران والاستراتيجيات:
- في سبتمبر 2023، أطلقت شركة Air BP، المزود الدولي لمنتجات وخدمات وقود الطائرات، عرض وقود Jet-A1 في محطة الطيران العام بمطار برلين براندنبورغ (BER) في إطار تعاون وكالة تم الاتفاق عليه حديثًا مع ExecuJet. (المصدر: Air BP، بيان صحفي/موقع الشركة على الويب/النشرة الإخبارية)
- في أكتوبر 2022، أطلقت TreviPay، شبكة المدفوعات والفواتير العالمية B2B، شبكة TreviPay Aviation Network، المدعومة من KHI، لتقديم حل بطاقة حلقة مغلقة ذات علامة تجارية مشتركة مصمم خصيصًا لتلبية احتياجات مشغلي القاعدة الثابتة ومنظمات خدمة دعم الطيران التي تخدم صناعات الطيران العام والدفاعي وعملائها. (المصدر: TreviPay، بيان صحفي/موقع الشركة/النشرة الإخبارية)
تقرير سوق بطاقات وقود الطيران والتغطية والنتائج المتوقعة
يوفر تقرير "حجم سوق بطاقات وقود الطيران والتوقعات (2020-2030)" تحليلاً مفصلاً للسوق يغطي المجالات التالية:
- حجم السوق والتوقعات على المستويات العالمية والإقليمية والوطنية لجميع قطاعات السوق الرئيسية التي يغطيها النطاق
- ديناميكيات السوق مثل المحركات والقيود والفرص الرئيسية
- الاتجاهات المستقبلية الرئيسية
- تحليل مفصل لقوى بورتر الخمس
- تحليل السوق العالمي والإقليمي الذي يغطي اتجاهات السوق الرئيسية واللاعبين الرئيسيين واللوائح والتطورات الأخيرة في السوق
- تحليل المشهد الصناعي والمنافسة الذي يغطي تركيز السوق، وتحليل خريطة الحرارة، واللاعبين البارزين، والتطورات الأخيرة
- ملفات تعريف تفصيلية للشركة مع تحليل SWOT

أنكيتا خبيرة ديناميكية في أبحاث السوق والاستشارات، تتمتع بخبرة تزيد عن 8 سنوات في قطاعات التكنولوجيا والإعلام وتكنولوجيا المعلومات والاتصالات والإلكترونيات وأشباه الموصلات. وقد قادت ونفذت بنجاح أكثر من 100 مهمة استشارية وبحثية لعملاء عالميين مثل مايكروسوفت وأوراكل وشركة NEC وSAP وKPMG وExpeditors International. تشمل كفاءاتها الأساسية تقييم السوق، وتحليل البيانات، والتنبؤ، وصياغة الاستراتيجيات، والاستخبارات التنافسية، وكتابة التقارير.
أنكيتا بارعة في إدارة دورات المشاريع الكاملة، بدءًا من تصميم عروض ما قبل البيع ومناقشات العملاء، وصولًا إلى تقديم رؤى عملية بعد البيع. كما أنها ماهرة في إدارة فرق متعددة الوظائف، وهيكلة وحدات بحثية معقدة، ومواءمة الحلول مع أهداف العمل الخاصة بالعملاء. وقد مكنتها مهاراتها الممتازة في التواصل والقيادة والعرض التقديمي من تحقيق نتائج قيّمة باستمرار في بيئات سوقية سريعة التطور.
- التحليل التاريخي (سنتان)، سنة الأساس، التوقعات (7 سنوات) مع معدل النمو السنوي المركب
- تحليل PEST و SWOT
- حجم السوق والقيمة / الحجم - عالمي، إقليمي، بلد
- الصناعة والمنافسة
- مجموعة بيانات إكسل
التقارير الحديثة
شهادات العملاء
تقرير سوق أنظمة SCADA من Insight Partners شامل، ويقدم رؤى قيّمة حول الاتجاهات الحالية والتوقعات المستقبلية. تميّز الفريق باحترافية عالية وسرعة في الاستجابة ودعم مستمر طوال الوقت. نحن راضون جدًا ونوصي بشدة بخدماتهم.
ران كيديم شريك, شركة ريالي تكنولوجيز المحدودةطلبتُ تقريرًا عن سوق برمجيات محدد، وأعدّه الفريق في غضون أيام قليلة. كانت المعلومات ذات صلة وثيقة وعرضها جيد. ثم طلبتُ بعض التعديلات والإضافات على التقرير. وكان الفريق متجاوبًا للغاية، وحصلتُ على التقرير النهائي في أقل من أسبوع.
جان هيرفيه جين رئيس مجلس الإدارة, فيوتشر أناليتيكاعملنا مع شركة "إنسايت بارتنرز" لإجراء دراسة سوقية وتوقعات مهمة. زودونا برؤى واضحة حول الفرص والمخاطر، مما ساعدنا في صياغة خططنا. كانت أبحاثهم سهلة الاستخدام ومبنية على بيانات دقيقة، مما ساعدنا على اتخاذ قرارات ذكية وواثقة. نوصي بهم بشدة.
بيوش ناجبال نائب الرئيس الأول, شعاع عالي عالميقدّمت شركة Insight Partners أبحاثًا سوقية ثاقبة ومنظمة جيدًا بخبرة واسعة في هذا المجال. تميّز فريقهم بالاحترافية وسرعة الاستجابة طوال الوقت. وسهّل موقعهم الإلكتروني سهل الاستخدام الوصول إلى تقارير القطاع. نوصي بهم بشدة لخدمات بحثية موثوقة وعالية الجودة.
يوكيهيكو أداتشي المدير التنفيذي, ديب بلو، ذ.م.م.هذه أول مرة أشتري فيها تقرير سوق من The Insight Partners. رغم أنني كنت مترددًا في البداية، إلا أنني زرت موقعهم الإلكتروني وشعرت براحة أكبر للمخاطرة وشراء تقرير السوق. أنا راضٍ تمامًا عن جودة التقرير وخدمة العملاء. كانت لديّ عدة أسئلة وتعليقات حول التقرير الأولي، ولكن بعد بضع محادثات عبر البريد الإلكتروني مع محللهم، أعتقد أن لديّ تقريرًا يمكنني استخدامه كمدخل لعملية التخطيط الاستراتيجي لدينا. شكرًا جزيلاً لكم على تخصيص وقتكم الإضافي وجعل هذه التجربة إيجابية. سأوصي بخدماتكم للآخرين بالتأكيد، وستكونون أول من ألجأ إليه عندما نحتاج إلى المزيد من بيانات السوق.
جون سوزوكي الرئيس والرئيس التنفيذي وعضو مجلس الإدارة, بي كيه تكنولوجيزأود أن أقدّر دعمكم واحترافيتكم في الاستجابة لطلبي للحصول على معلومات بشأن سوق التشخيص المخبري للأمراض المعدية في نيجيريا. كما أُقدّر صبركم وتوجيهكم، واستعدادكم لتقديم خصم، مما مكّننا في النهاية من إتمام الصفقة. أتطلع إلى التعامل مع "ذا إنسايت بارتنرز" مستقبلًا، كل ذلك بفضل الانطباع الذي تركتموه لديّ نتيجةً لهذا اللقاء الأول.
الدكتور تشيجيوك أونيا المدير الإداري, شركة باينكريست للرعاية الصحية المحدودةسبب الشراء
- اتخاذ قرارات مدروسة
- فهم ديناميكيات السوق
- تحليل المنافسة
- رؤى العملاء
- توقعات السوق
- تخفيف المخاطر
- التخطيط الاستراتيجي
- مبررات الاستثمار
- تحديد الأسواق الناشئة
- تحسين استراتيجيات التسويق
- تعزيز الكفاءة التشغيلية
- مواكبة التوجهات التنظيمية


 احصل على عينة مجانية ل - سوق بطاقات وقود الطيران