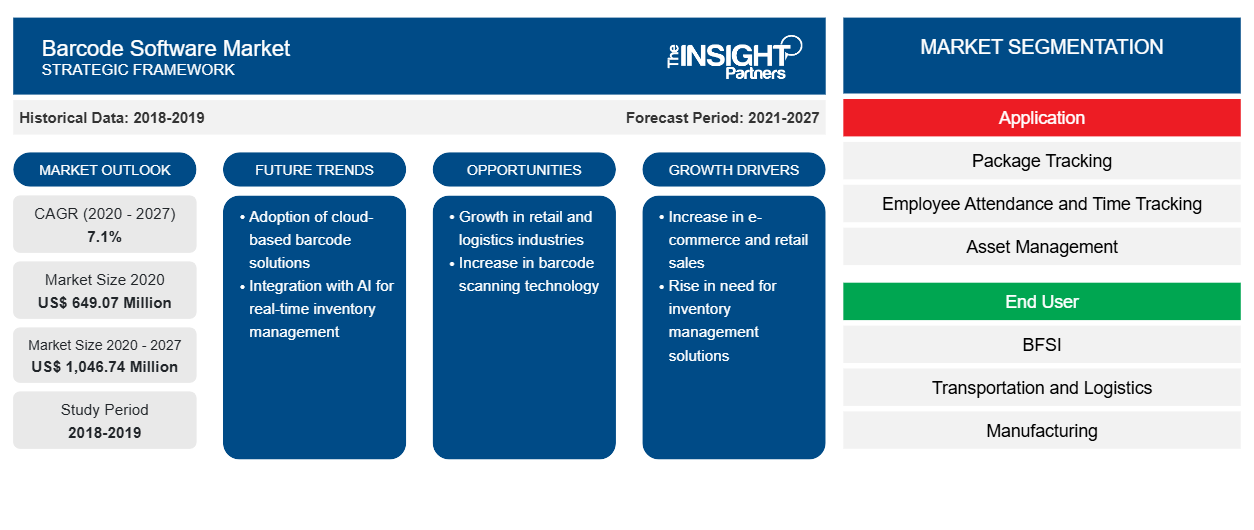
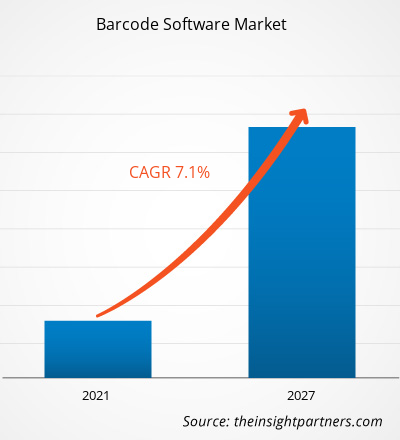
قُدِّر حجم سوق برامج الباركود بـ 881.03 مليون دولار أمريكي في عام 2024، ومن المتوقع أن يصل إلى 1,378.29 مليون دولار أمريكي بحلول عام 2031؛ ومن المتوقع أن يسجل السوق معدل نمو سنوي مركب بنسبة 6.8% من عام 2025 إلى عام 2031. ومن المرجح أن تكون الشعبية المتزايدة لبرامج الباركود المستندة إلى السحابة اتجاهًا رئيسيًا في السوق.
تحليل سوق برامج الباركود
تدعم برامج الباركود مجموعةً واسعةً من المنصات، بما في ذلك أنظمة سطح المكتب، والأجهزة المحمولة، والبيئات السحابية، مما يجعلها قابلةً للتكيف ومتعددة الاستخدامات لتلبية الاحتياجات الفريدة لمختلف المؤسسات. وتساهم عواملٌ مثل نمو قطاع التجزئة والتجارة الإلكترونية، والتطورات في تقنية الباركود، في دفع عجلة سوق برامج الباركود . ومن المتوقع أن يشهد سوق برامج الباركود نموًا خلال فترة التوقعات، نظرًا للاعتماد المتزايد على أجهزة قراءة الباركود المدعومة بالذكاء الاصطناعي، والتفضيل المتزايد لأجهزة قراءة الباركود القابلة للارتداء. ومن المتوقع أن تُمثل الشعبية المتزايدة لبرامج الباركود السحابية اتجاهًا رئيسيًا في سوق برامج الباركود. ومع ذلك، قد يُعيق الاعتماد على الماسحات الضوئية نمو هذا السوق.
نظرة عامة على سوق برامج الباركود
تشمل برامج الباركود تطبيقاتٍ مُصممة خصيصًا لإنشاء وطباعة وإدارة الباركود. الباركود هو رمزٌ قابلٌ للقراءة آليًا، يتكون من أشرطة أو خطوط متوازية بأطوال مختلفة، تُمثل البيانات. يُمكّن هذا البرنامج المستخدمين من إنشاء صور أو ملصقات باركود، والتي يُمكن مسحها ضوئيًا وفك تشفيرها باستخدام ماسحات الباركود أو الأجهزة المحمولة. يتكامل البرنامج مع أنظمة أعمال أخرى، ويدعم منصات متعددة، مما يُسهّل تبادل البيانات بسلاسة، ويُعزز الكفاءة التشغيلية الإجمالية. يُستخدم برنامج الباركود على نطاق واسع في مختلف الصناعات لأغراضٍ مثل إدارة المخزون، وتتبع المنتجات، وأنظمة نقاط البيع، وإدارة سلسلة التوريد . يُسهّل برنامج الباركود إنشاء وطباعة وإدارة الباركود لتطبيقاتٍ مُختلفة، من تتبع المخزون إلى وضع العلامات على المنتجات. تشمل الخيارات الشائعة BarTender وZebraDesigner، اللذان يُوفران ميزاتٍ مثل تصميم الملصقات، والتكامل مع الأنظمة، وقابلية التوسع. يتكامل البرنامج بسلاسة مع أنظمة أعمال أخرى، مما يضمن تبادلًا سلسًا للبيانات عبر المنصات. يُعزز هذا التكامل الكفاءة التشغيلية الإجمالية من خلال تمكين التحديثات الفورية، وتقليل الأخطاء البشرية، وضمان الدقة في تتبع وإدارة المخزون.
قم بتخصيص هذا التقرير ليناسب متطلباتك
ستحصل على تخصيص لأي تقرير - مجانًا - بما في ذلك أجزاء من هذا التقرير، أو تحليل على مستوى الدولة، وحزمة بيانات Excel، بالإضافة إلى الاستفادة من العروض والخصومات الرائعة للشركات الناشئة والجامعات
سوق برامج الباركود: Software Market:
- احصل على أهم اتجاهات السوق الرئيسية لهذا التقرير.ستتضمن هذه العينة المجانية تحليل البيانات، بدءًا من اتجاهات السوق وحتى التقديرات والتوقعات.
محركات وفرص سوق برامج الباركود Software Market Drivers and Opportunities
نمو قطاع التجزئة والتجارة الإلكترونية
كما ذكرت إدارة التجارة الدولية، من المتوقع أن يصل سوق التجارة الإلكترونية العالمي بين الشركات (B2B) بحلول عام 2026 إلى قيمة مذهلة تبلغ 36 تريليون دولار أمريكي، مما يُبرز الحجم الهائل والإمكانات الهائلة لهذا القطاع. وبالمثل، في فبراير 2025، أعلن مكتب الإحصاء التابع لوزارة التجارة عن تقديرات مبيعات التجزئة الإلكترونية في الولايات المتحدة للربع الأخير من عام 2024. في الربع الأخير من عام 2024، مثلت مبيعات التجارة الإلكترونية 16.4% من إجمالي مبيعات التجزئة، بقيمة 352.9 مليار دولار أمريكي، بزيادة قدرها 22.1% عن الربع الثالث من عام 2024. وبالمقارنة مع الربع الأخير من عام 2023، نمت مبيعات التجارة الإلكترونية بنسبة 9.3%، بينما شهد إجمالي مبيعات التجزئة زيادة بنسبة 4.5%. بلغ إجمالي مبيعات التجارة الإلكترونية لعام 2024 ما يُقدر بـ 1,192.6 مليار دولار أمريكي، مسجلاً نموًا بنسبة 8.1% مقارنةً بعام 2023. ويدفع النمو السريع لقطاعي التجزئة والتجارة الإلكترونية عالميًا إلى ضرورة وجود أنظمة فعّالة لإدارة المخزون وسلسلة التوريد. وتُمكّن برامج الباركود الشركات من تحسين إدارة المخزون، وتتبع حركة المنتجات آنيًا، وتقديم خدمة عملاء أفضل. ومع نمو التجارة الإلكترونية، تزداد الحاجة إلى برامج مسح الباركود وتتبعه لضمان دقة تنفيذ الطلبات. ومن ثم، يُشكّل قطاع التجزئة والتجارة الإلكترونية المتنامي محركًا رئيسيًا لسوق برامج الباركود.Barcode software allows businesses to improve stock management, track product movement in real time, and offer better customer service. As e-commerce grows, the need for barcode scanning and tracking software becomes even more critical to maintain accurate order fulfillment. Hence, the growing retail and barcode software market.
تزايد استخدام أجهزة قراءة الباركود المدعومة بالذكاء الاصطناعي
يشهد سوق برمجيات الباركود نموًا ملحوظًا، مدفوعًا بالتقدم التكنولوجي والطلب المتزايد على الأتمتة والكفاءة في مختلف قطاعات التصنيع. ويشير طرح أجهزة قراءة الباركود المتقدمة هذه إلى اتجاه متزايد نحو اعتماد الحلول المدعومة بالذكاء الاصطناعي في سوق برمجيات الباركود. على سبيل المثال، في يناير 2025، واصلت شركة Cognex Corporation، الرائدة عالميًا في مجال الرؤية الآلية الصناعية، دفع عجلة الابتكار في هذا المجال بإطلاق أحدث عروضها، وهي أجهزة قراءة الباركود DataMan 290 و390. تستفيد هذه المنتجات الجديدة من أحدث تقنيات الذكاء الاصطناعي لتوفير دقة وموثوقية لا مثيل لها في فك التشفير، مما يجعلها أداة أساسية لتعزيز الإنتاجية التشغيلية. لا يقتصر طرح هذه الأجهزة المتقدمة على معالجة تحديات مسح الباركود المعقدة فحسب، بل يفتح أيضًا العديد من الفرص في سوق برمجيات الباركود المتطور. تمثل أجهزة قراءة الباركود DataMan 290 و390 من Cognex نقلة نوعية في تكنولوجيا المسح الصناعي. بفضل تقنية الذكاء الاصطناعي المتقدمة، تضمن هذه الأجهزة فك تشفير عالي الأداء عبر مجموعة واسعة من أنواع الباركود وبيئات التصنيع. يتيح دمج الذكاء الاصطناعي للأجهزة التعلم والتكيف مع ظروف المسح المختلفة، مما يُحسّن الدقة والسرعة آنيًا، حتى في ظل ظروف صعبة، مثل ضعف التباين، أو تلف الباركود، أو طباعته بشكل سيء. يوفر هذا الابتكار للمصنعين حلاً متعدد الاستخدامات يعزز الكفاءة ويقلل من وقت التوقف.
تقرير تحليل تجزئة سوق برامج الباركود
القطاعات الرئيسية التي ساهمت في اشتقاق تحليل سوق برامج الباركود هي النشر، ونوع الباركود، والتطبيق، وصناعة الاستخدام النهائي.
- من حيث النشر، ينقسم سوق برامج الباركود إلى محلي وسحابي. وسيهيمن قطاع السحابة على السوق في عام ٢٠٢٤.
- بناءً على نوع الباركود، يُقسّم السوق إلى باركود أحادي الأبعاد وباركود ثنائي الأبعاد. وسيُهيمن قطاع الباركود أحادي الأبعاد على السوق في عام ٢٠٢٤.
- من حيث التطبيق، يُقسّم السوق إلى إدارة المخزون، وعمليات نقاط البيع، وإدارة الأصول، وحضور الموظفين وتتبع أوقاتهم، وغيرها. وسيُهيمن قطاع إدارة المخزون على السوق في عام 2024.
- بناءً على قطاع الاستخدام النهائي، ينقسم سوق برامج الباركود إلى قطاعات الخدمات المصرفية والمالية والتأمين، والنقل والخدمات اللوجستية، والتصنيع، والرعاية الصحية، وتجارة التجزئة والتجارة الإلكترونية، وغيرها. وسيُهيمن قطاع تجارة التجزئة والتجارة الإلكترونية على السوق في عام 2024.
تحليل حصة سوق برامج الباركود حسب المنطقة الجغرافية
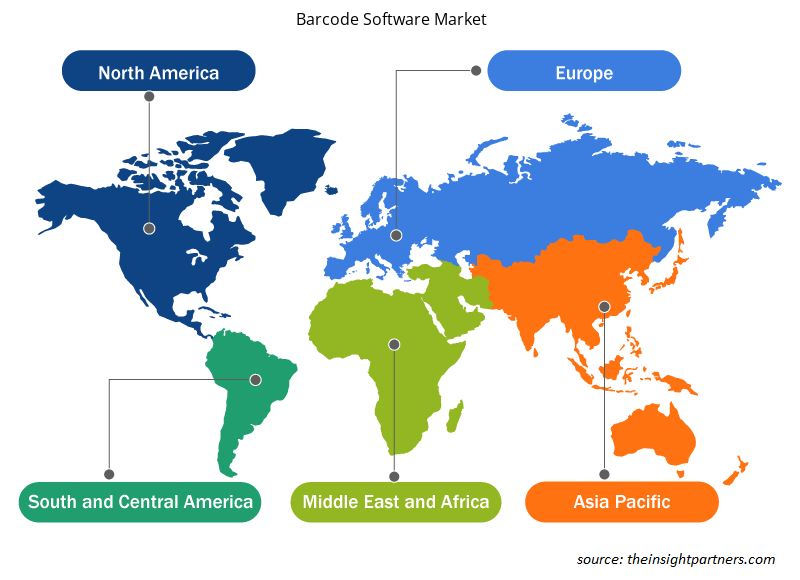
- يُقسّم سوق برامج الباركود إلى خمس مناطق رئيسية: أمريكا الشمالية، وأوروبا، وآسيا والمحيط الهادئ، والشرق الأوسط وأفريقيا، وأمريكا الجنوبية والوسطى. وقد هيمنت أمريكا الشمالية على السوق في عام 2024، تلتها أوروبا وآسيا والمحيط الهادئ.
- تحتل أمريكا الشمالية مكانة رائدة في سوق برمجيات الباركود العالمية، بفضل تبنيها المبكر لأحدث التقنيات، وحضورها القوي في السوق، وازدياد الطلب على الأتمتة في قطاعات الخدمات اللوجستية وتجارة التجزئة وإدارة المخزون. وتتمتع المنطقة ببنية تحتية راسخة، إلى جانب استثمارات في التصنيع الذكي والتجارة الإلكترونية. ووفقًا لمجلة "ذا إنتربرايز وورلد"، تتصدر الولايات المتحدة الأمريكية سوق استخدام رموز الاستجابة السريعة عالميًا، حيث ستستحوذ على 42.2% من عمليات المسح الضوئي العالمية في عام 2022، مع ارتفاع هذه النسبة إلى 43.9% في عام 2023.
- في أوروبا، يشهد سوق برمجيات الباركود نموًا مطردًا، مدفوعًا بقاعدة التصنيع القوية في المنطقة، لا سيما في قطاعات مثل السيارات، والإلكترونيات الاستهلاكية، والأدوية. ويشهد اعتماد حلول الباركود لإدارة المخزون، وتحسين سلسلة التوريد، والامتثال للوائح التنظيمية نموًا ملحوظًا في المنطقة. علاوة على ذلك، يُعزز التوجه المتزايد نحو الثورة الصناعية الرابعة ورقمنة التصنيع الأوروبي الطلب على حلول برمجيات الباركود.
- من المتوقع أن تشهد منطقة آسيا والمحيط الهادئ أعلى معدل نمو في سوق برمجيات الباركود. ويعود هذا النمو إلى التصنيع السريع في الاقتصادات الناشئة مثل الصين والهند، حيث يزداد اعتماد برمجيات الباركود في قطاعات التجزئة والخدمات اللوجستية والتصنيع. ويشهد التركيز على الأتمتة والخدمات اللوجستية الذكية وتطوير منصات التجارة الإلكترونية نموًا مطردًا في المنطقة. علاوة على ذلك، يتزايد الطلب على حلول الباركود في قطاعات الأغذية والمشروبات والتجزئة والرعاية الصحية. ووفقًا لشركة فيزا، استخدم 93% من المستهلكين في جنوب شرق آسيا في عام 2022 مختلف وسائل الدفع غير النقدية، بما في ذلك رموز الاستجابة السريعة (QR codes) في المعاملات. ويتزايد الطلب على حلول الدفع الرقمية الفعّالة في المنطقة، مما يدفع عجلة التقدم التكنولوجي وتوسع السوق.
رؤى إقليمية حول سوق برامج الباركود
قام محللو شركة إنسايت بارتنرز بشرح شامل للاتجاهات الإقليمية والعوامل المؤثرة في سوق برمجيات الباركود خلال فترة التوقعات. ويناقش هذا القسم أيضًا قطاعات سوق برمجيات الباركود ونطاقه الجغرافي في أمريكا الشمالية، وأوروبا، وآسيا والمحيط الهادئ، والشرق الأوسط وأفريقيا، وأمريكا الجنوبية والوسطى.
- احصل على البيانات الإقليمية المحددة لسوق برامج الباركود
نطاق تقرير سوق برامج الباركود
| سمة التقرير | تفاصيل |
|---|---|
| حجم السوق في عام 2024 | 881.03 مليون دولار أمريكي |
| حجم السوق بحلول عام 2031 | 1,378.29 مليون دولار أمريكي |
| معدل النمو السنوي المركب العالمي (2025 - 2031) | 6.8% |
| البيانات التاريخية | 2021-2023 |
| فترة التنبؤ | 2025-2031 |
| القطاعات المغطاة | حسب نوع الباركود
|
| المناطق والدول المغطاة | أمريكا الشمالية
|
| قادة السوق وملفات تعريف الشركات الرئيسية |
|
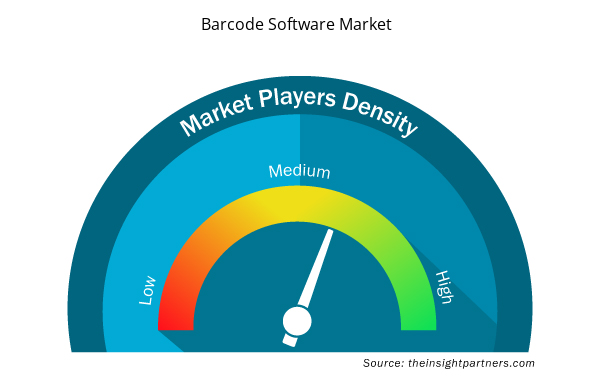
كثافة اللاعبين في سوق برامج الباركود: فهم تأثيرها على ديناميكيات الأعمال
يشهد سوق برمجيات الباركود نموًا سريعًا، مدفوعًا بتزايد طلب المستخدم النهائي نتيجةً لعوامل مثل تطور تفضيلات المستهلكين، والتقدم التكنولوجي، وزيادة الوعي بمزايا المنتج. ومع تزايد الطلب، تعمل الشركات على توسيع عروضها، والابتكار لتلبية احتياجات المستهلكين، والاستفادة من الاتجاهات الناشئة، مما يعزز نمو السوق.
تشير كثافة اللاعبين في السوق إلى توزيع الشركات العاملة في سوق أو قطاع معين. وتشير إلى عدد المنافسين (اللاعبين في السوق) الموجودين في سوق معين نسبةً إلى حجمه أو قيمته السوقية الإجمالية.
الشركات الرئيسية العاملة في سوق برامج الباركود هي:
- شركة بلو بيرد
- شركة هانيويل الدولية
- شركة ديناميكيات النظام
- داتالوجيك إس بي إيه
- محول تناظري رقمي من دينسو
- شركة البيانات العامة المحدودة
إخلاء المسؤولية : الشركات المذكورة أعلاه ليست مرتبة بأي ترتيب معين.
- احصل على نظرة عامة على أهم اللاعبين الرئيسيين في سوق برامج الباركود
أخبار سوق برامج الباركود والتطورات الأخيرة
يُقيّم سوق برامج الباركود بجمع بيانات نوعية وكمية بعد البحث الأولي والثانوي، والتي تشمل منشورات الشركات المهمة، وبيانات الجمعيات، وقواعد البيانات. فيما يلي بعض التطورات في سوق برامج الباركود:
- أعلنت شركة هانيويل (المدرجة في بورصة ناسداك تحت الرمز HON) عن دمج برنامجها لفك تشفير الباركود SwiftDecoder في طائرات كورفوس روبوتيكس ذاتية الطيران لمراقبة المخزون. وسيُستخدم هذا الحل الرائد داخل المستودعات ومراكز التوزيع لتسريع ودقة تتبع المخزون المتغير باستمرار لتجار التجزئة والموزعين والمصنعين على مستوى الصناديق والمنصات.
(المصدر: هانيويل، بيان صحفي، مارس 2025)
- قامت شركة ريفينوفا الآن بدمج واجهة برمجة تطبيقات الباركود TEC-IT في نظام إدارة النقل (TMS). مع اشتراك TEC-IT، يُمكنهم استخدام مُولّد الباركود عبر الإنترنت، الذي يُتيح إنشاء الباركود بسهولة دون الحاجة إلى برمجة إضافية. تُبسّط هذه الميزة إدارة الخدمات اللوجستية وتتبع المخزون.
(المصدر: TEC-IT Datenverarbeitung GmbH، بيان صحفي، نوفمبر 2024)
تغطية تقرير سوق برامج الباركود والمنتجات النهائية
يوفر تقرير "حجم سوق برامج الباركود وتوقعاته (2021-2031)" تحليلاً مفصلاً للسوق يغطي المجالات المذكورة أدناه:
- حجم سوق برامج الباركود وتوقعاته على المستويات العالمية والإقليمية والوطنية لجميع قطاعات السوق الرئيسية التي يغطيها النطاق
- اتجاهات سوق برامج الباركود، بالإضافة إلى ديناميكيات السوق مثل العوامل المحركة والقيود والفرص الرئيسية
- تحليل مفصل لـ PEST و SWOT
- تحليل سوق برامج الباركود يغطي اتجاهات السوق الرئيسية والإطار العالمي والإقليمي والجهات الفاعلة الرئيسية واللوائح والتطورات الأخيرة في السوق
- تحليل المشهد الصناعي والمنافسة الذي يغطي تركيز السوق، وتحليل خريطة الحرارة، واللاعبين البارزين، والتطورات الأخيرة في سوق برامج الباركود
- ملفات تعريف الشركة التفصيلية
- التحليل التاريخي (سنتان)، السنة الأساسية، التوقعات (7 سنوات) مع معدل النمو السنوي المركب
- تحليل PEST و SWOT
- حجم السوق والقيمة / الحجم - عالميًا وإقليميًا وقطريًا
- الصناعة والمنافسة
- مجموعة بيانات Excel


Report Coverage
Revenue forecast, Company Analysis, Industry landscape, Growth factors, and Trends

Segment Covered
This text is related
to segments covered.

Regional Scope
North America, Europe, Asia Pacific, Middle East & Africa, South & Central America

Country Scope
This text is related
to country scope.
الأسئلة الشائعة
Growth of retail and e-commerce sector and advancements in barcode technology are driving the market growth.
Rising popularity of cloud-based barcode software is a key trend in the market.
Bluebird Inc., Honeywell International Inc., Dynamic System Inc., Datalogic SpA, DENSO ADC, General Data Company, Inc., Zebra Technologies Corp, NCR VOYIX Corp, TKX Corp SAS, Archon Systems Inc., Wasp Barcode Technologies, TEC-IT Datenverarbeitung GmbH, BSD InfoTech Pvt. Ltd., Foxit Software Inc., and Zoho Corp Pvt Ltd are major players in the market.
The market is expected to reach a value of US$ 1378.29 million by 2031.
The market is anticipated to expand at a CAGR of 6.8% during 2025-2031.
The List of Companies - Barcode Software Market
- Honeywell International Inc
- Dynamic System Inc.
- Datalogic SpA
- DENSO ADC
- General Data Company, Inc.
- Zebra Technologies Corp
- NCR VOYIX Corp
- Zebex Industries Inc
- TKX Corp SAS
- Archon Systems Inc.
- Wasp Barcode Technologies
- TEC-IT Datenverarbeitung GmbH
- BSD InfoTech Pvt. Ltd.
- Foxit Software Inc.
- Zoho Corp Pvt Ltd
The Insight Partners performs research in 4 major stages: Data Collection & Secondary Research, Primary Research, Data Analysis and Data Triangulation & Final Review.
- Data Collection and Secondary Research:
As a market research and consulting firm operating from a decade, we have published and advised several client across the globe. First step for any study will start with an assessment of currently available data and insights from existing reports. Further, historical and current market information is collected from Investor Presentations, Annual Reports, SEC Filings, etc., and other information related to company’s performance and market positioning are gathered from Paid Databases (Factiva, Hoovers, and Reuters) and various other publications available in public domain.
Several associations trade associates, technical forums, institutes, societies and organization are accessed to gain technical as well as market related insights through their publications such as research papers, blogs and press releases related to the studies are referred to get cues about the market. Further, white papers, journals, magazines, and other news articles published in last 3 years are scrutinized and analyzed to understand the current market trends.
- Primary Research:
The primarily interview analysis comprise of data obtained from industry participants interview and answers to survey questions gathered by in-house primary team.
For primary research, interviews are conducted with industry experts/CEOs/Marketing Managers/VPs/Subject Matter Experts from both demand and supply side to get a 360-degree view of the market. The primary team conducts several interviews based on the complexity of the markets to understand the various market trends and dynamics which makes research more credible and precise.
A typical research interview fulfils the following functions:
- Provides first-hand information on the market size, market trends, growth trends, competitive landscape, and outlook
- Validates and strengthens in-house secondary research findings
- Develops the analysis team’s expertise and market understanding
Primary research involves email interactions and telephone interviews for each market, category, segment, and sub-segment across geographies. The participants who typically take part in such a process include, but are not limited to:
- Industry participants: VPs, business development managers, market intelligence managers and national sales managers
- Outside experts: Valuation experts, research analysts and key opinion leaders specializing in the electronics and semiconductor industry.
Below is the breakup of our primary respondents by company, designation, and region:

Once we receive the confirmation from primary research sources or primary respondents, we finalize the base year market estimation and forecast the data as per the macroeconomic and microeconomic factors assessed during data collection.
- Data Analysis:
Once data is validated through both secondary as well as primary respondents, we finalize the market estimations by hypothesis formulation and factor analysis at regional and country level.
- Macro-Economic Factor Analysis:
We analyse macroeconomic indicators such the gross domestic product (GDP), increase in the demand for goods and services across industries, technological advancement, regional economic growth, governmental policies, the influence of COVID-19, PEST analysis, and other aspects. This analysis aids in setting benchmarks for various nations/regions and approximating market splits. Additionally, the general trend of the aforementioned components aid in determining the market's development possibilities.
- Country Level Data:
Various factors that are especially aligned to the country are taken into account to determine the market size for a certain area and country, including the presence of vendors, such as headquarters and offices, the country's GDP, demand patterns, and industry growth. To comprehend the market dynamics for the nation, a number of growth variables, inhibitors, application areas, and current market trends are researched. The aforementioned elements aid in determining the country's overall market's growth potential.
- Company Profile:
The “Table of Contents” is formulated by listing and analyzing more than 25 - 30 companies operating in the market ecosystem across geographies. However, we profile only 10 companies as a standard practice in our syndicate reports. These 10 companies comprise leading, emerging, and regional players. Nonetheless, our analysis is not restricted to the 10 listed companies, we also analyze other companies present in the market to develop a holistic view and understand the prevailing trends. The “Company Profiles” section in the report covers key facts, business description, products & services, financial information, SWOT analysis, and key developments. The financial information presented is extracted from the annual reports and official documents of the publicly listed companies. Upon collecting the information for the sections of respective companies, we verify them via various primary sources and then compile the data in respective company profiles. The company level information helps us in deriving the base number as well as in forecasting the market size.
- Developing Base Number:
Aggregation of sales statistics (2020-2022) and macro-economic factor, and other secondary and primary research insights are utilized to arrive at base number and related market shares for 2022. The data gaps are identified in this step and relevant market data is analyzed, collected from paid primary interviews or databases. On finalizing the base year market size, forecasts are developed on the basis of macro-economic, industry and market growth factors and company level analysis.
- Data Triangulation and Final Review:
The market findings and base year market size calculations are validated from supply as well as demand side. Demand side validations are based on macro-economic factor analysis and benchmarks for respective regions and countries. In case of supply side validations, revenues of major companies are estimated (in case not available) based on industry benchmark, approximate number of employees, product portfolio, and primary interviews revenues are gathered. Further revenue from target product/service segment is assessed to avoid overshooting of market statistics. In case of heavy deviations between supply and demand side values, all thes steps are repeated to achieve synchronization.
We follow an iterative model, wherein we share our research findings with Subject Matter Experts (SME’s) and Key Opinion Leaders (KOLs) until consensus view of the market is not formulated – this model negates any drastic deviation in the opinions of experts. Only validated and universally acceptable research findings are quoted in our reports.
We have important check points that we use to validate our research findings – which we call – data triangulation, where we validate the information, we generate from secondary sources with primary interviews and then we re-validate with our internal data bases and Subject matter experts. This comprehensive model enables us to deliver high quality, reliable data in shortest possible time.
 احصل على عينة مجانية لهذا التقرير