سوق أجهزة اختبار معدل الخطأ في البت – السائقين والاتجاهات والفرص وإحصاءات النمو | 2031
البيانات التاريخية : 2021-2023 | سنة الأساس : 2024 | فترة التنبؤ : 2025-2031حجم سوق أجهزة اختبار معدل خطأ البت وتوقعاته (2021-2031)، والحصة العالمية والإقليمية، والاتجاهات، وفرص النمو. يغطي التقرير تحليلًا حسب نوع المنتج (BERT التقليدي، BERT الوظيفي)؛ والتطبيق (التركيب والصيانة، والبحث والتطوير، والتصنيع)؛ والمستخدم النهائي (مقدمو الخدمات، ومصنعو المكونات والأنظمة، والشركات، وغيرها)، والموقع الجغرافي (أمريكا الشمالية، وأوروبا، وآسيا والمحيط الهادئ، وأمريكا الجنوبية والوسطى).
- تاريخ التقرير : Jan 2026
- رمز التقرير : TIPRE00008261
- الفئة : الإلكترونيات وأشباه الموصلات
- الحالة : قادم
- تنسيقات التقارير المتاحة :


- عدد الصفحات : 150
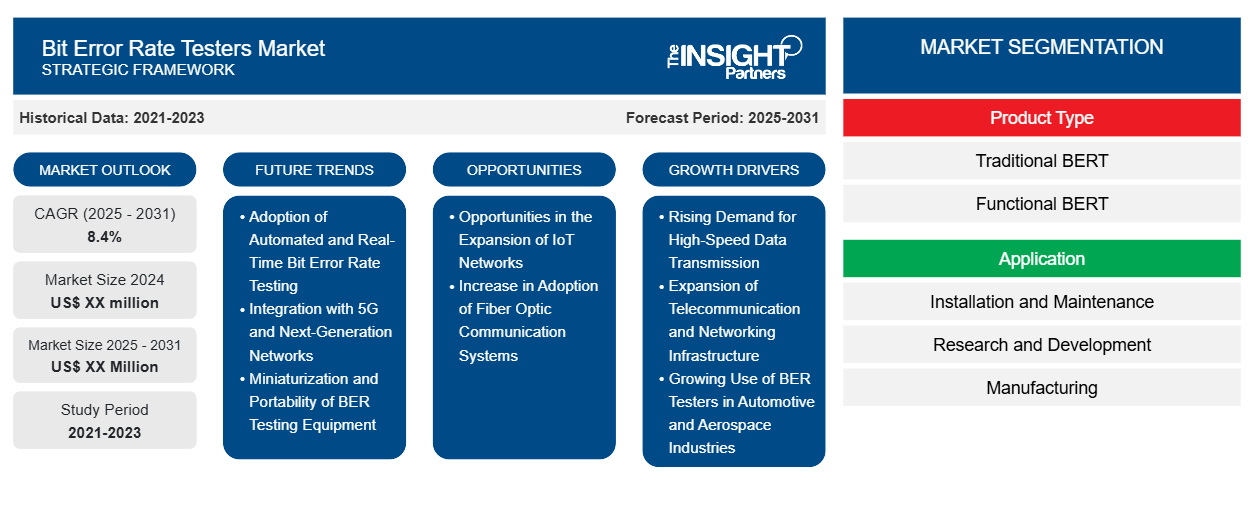
من المتوقع أن يسجل سوق أجهزة اختبار معدل الخطأ في البت معدل نمو سنوي مركب بنسبة 8.4٪ من عام 2023 إلى عام 2031، مع توسع حجم السوق من XX مليون دولار أمريكي في عام 2023 إلى XX مليون دولار أمريكي بحلول عام 2031.
تم تقسيم التقرير حسب نوع المنتج (BERT التقليدي، BERT الوظيفي)؛ التطبيق (التركيب والصيانة، البحث والتطوير، التصنيع)؛ المستخدم النهائي (مقدمو الخدمات، مصنعو المكونات والأنظمة، الشركات، آخرون). تم تقسيم التحليل العالمي بشكل أكبر على المستوى الإقليمي والدول الرئيسية. يقدم التقرير القيمة بالدولار الأمريكي للتحليل والشرائح المذكورة أعلاه.
غرض التقرير
يهدف تقرير سوق أجهزة اختبار معدل الخطأ في البتات الصادر عن The Insight Partners إلى وصف المشهد الحالي والنمو المستقبلي وأهم العوامل الدافعة والتحديات والفرص. وسيوفر هذا رؤى لمختلف أصحاب المصلحة في الأعمال التجارية، مثل:
- مزودي/مصنعي التكنولوجيا: لفهم ديناميكيات السوق المتطورة ومعرفة فرص النمو المحتملة، وتمكينهم من اتخاذ قرارات استراتيجية مستنيرة.
- المستثمرون: إجراء تحليل شامل للاتجاهات فيما يتعلق بمعدل نمو السوق، وتوقعات السوق المالية، والفرص المتاحة عبر سلسلة القيمة.
- الهيئات التنظيمية: لتنظيم السياسات ومراقبة الأنشطة في السوق بهدف تقليل الانتهاكات والحفاظ على ثقة المستثمرين والحفاظ على سلامة السوق واستقرارها.
تجزئة سوق أجهزة اختبار معدل الخطأ في البت
نوع المنتج
- BERT التقليدية
- BERT الوظيفية
طلب
- التركيب والصيانة
- البحث والتطوير
- تصنيع
المستخدم النهائي
- مقدمي الخدمة
- مصنعي المكونات والأنظمة
- الشركات
- آحرون
الجغرافيا
- أمريكا الشمالية
- أوروبا
- آسيا والمحيط الهادئ
- أمريكا الجنوبية والوسطى
- الشرق الأوسط وأفريقيا
الجغرافيا
- أمريكا الشمالية
- أوروبا
- آسيا والمحيط الهادئ
- أمريكا الجنوبية والوسطى
- الشرق الأوسط وأفريقيا
قم بتخصيص هذا التقرير ليناسب متطلباتك
ستحصل على تخصيص لأي تقرير - مجانًا - بما في ذلك أجزاء من هذا التقرير، أو تحليل على مستوى الدولة، وحزمة بيانات Excel، بالإضافة إلى الاستفادة من العروض والخصومات الرائعة للشركات الناشئة والجامعات
سوق أجهزة اختبار معدل الخطأ في البتات: رؤى استراتيجية
- احصل على أهم اتجاهات السوق الرئيسية لهذا التقرير.ستتضمن هذه العينة المجانية تحليلاً للبيانات، بدءًا من اتجاهات السوق وحتى التقديرات والتوقعات.
محركات نمو سوق أجهزة اختبار معدل الخطأ في البتات
- الطلب المتزايد على نقل البيانات عالية السرعة: إن النمو المستمر في الطلب على نقل البيانات عالية السرعة عبر مختلف القطاعات، مثل الاتصالات والشبكات ومراكز البيانات، هو الذي يدفع سوق أجهزة اختبار معدل الخطأ في البتات (BER). ومع تطور شبكات الجيل الخامس والألياف الضوئية والإنترنت عالي السرعة، فإن ضمان سلامة البيانات المنقولة أمر بالغ الأهمية. تساعد أجهزة اختبار معدل الخطأ في البتات في تقييم جودة البيانات والحفاظ عليها من خلال قياس الأخطاء في أنظمة الاتصالات عالية السرعة، وبالتالي تعزيز نمو السوق.
- توسيع البنية التحتية للاتصالات والشبكات: يعد التوسع السريع في البنية التحتية للاتصالات والشبكات، بما في ذلك نشر شبكات الجيل الخامس، محركًا رئيسيًا لسوق أجهزة اختبار BER. ومع زيادة تعقيد أنظمة الاتصالات، يصبح من الضروري الحفاظ على معدل خطأ بت منخفض لنقل البيانات بشكل فعال. أدى الطلب على أداء الشبكة الموثوق والخالي من الأخطاء إلى اعتماد أجهزة اختبار BER لتحسين الشبكة وضمان الجودة واستكشاف الأخطاء وإصلاحها.
- الاستخدام المتزايد لأجهزة اختبار معدل الخطأ في البتات في صناعات السيارات والفضاء: تتبنى صناعات السيارات والفضاء بشكل متزايد أنظمة اتصالات معقدة للسيارات ذاتية القيادة وشبكات الاتصالات داخل المركبات وأنظمة الاتصالات عبر الأقمار الصناعية. تعد أجهزة اختبار معدل الخطأ في البتات ضرورية في هذه القطاعات لضمان موثوقية وأداء بروتوكولات الاتصال. ومع تقدم الصناعتين من الناحية التكنولوجية، تزداد الحاجة إلى أنظمة اتصالات قوية وخالية من الأخطاء، مما يؤدي إلى زيادة الطلب على أجهزة اختبار معدل الخطأ في البتات
اتجاهات مستقبل سوق أجهزة اختبار معدل الخطأ في البتات
- اعتماد اختبار معدل الخطأ في البتات الآلي والوقت الحقيقي: يعد اعتماد حلول الاختبار الآلي والوقت الحقيقي أحد الاتجاهات المهمة في سوق أجهزة اختبار معدل الخطأ في البتات. ومع زيادة تعقيد الشبكة وسرعتها، تكتسب عمليات المراقبة في الوقت الحقيقي والاختبار الآلي شعبية متزايدة. يساعد الاختبار الآلي في تقليل الخطأ البشري ويوفر مراقبة مستمرة، وهو أمر ضروري للحفاظ على أداء النظام في التطبيقات الحرجة مثل 5G ومراكز البيانات ومنصات التداول عالية التردد.
- التكامل مع شبكات الجيل الخامس والجيل القادم: إن الطرح السريع لشبكات الجيل الخامس وغيرها من تقنيات الجيل القادم اللاسلكية يشكل اتجاهًا رئيسيًا يؤثر على سوق أجهزة اختبار BER. تتطلب هذه الشبكات اختبار نقل البيانات بسرعة عالية والاتصالات ذات زمن الوصول المنخفض، مما يجعل أجهزة اختبار BER ضرورية لتقييم أداء معدات الجيل الخامس والبنية الأساسية وأجهزة الشبكة. ومع توسع شبكات الجيل الخامس عالميًا، من المتوقع أن تزداد الحاجة إلى أنظمة اختبار BER الدقيقة والموثوقة لضمان سلامة الإشارة.
- تصغير حجم معدات اختبار معدل الخطأ في البتات وقابليتها للنقل: هناك اتجاه متزايد نحو تصغير حجم أجهزة اختبار معدل الخطأ في البتات وقابليتها للنقل، مما يتيح إجراء اختبارات أكثر ملاءمة في بيئات متنوعة. أصبحت أجهزة الاختبار المحمولة الصغيرة ذات الميزات المتقدمة تحظى بشعبية متزايدة، وخاصة في تطبيقات الاختبار الميداني. تسمح هذه الأجهزة المحمولة للمهندسين والفنيين بإجراء اختبارات معدل الخطأ في البتات في الموقع، مما يقلل من الحاجة إلى إعدادات اختبار ثابتة كبيرة ويجعل من السهل صيانة أنظمة الاتصالات عالية الجودة
فرص سوق أجهزة اختبار معدل الخطأ في البتات
- الفرص المتاحة في توسع شبكات إنترنت الأشياء: يقدم النمو السريع لإنترنت الأشياء فرصًا كبيرة لسوق أجهزة اختبار الخطأ في البيانات. تعتمد تطبيقات إنترنت الأشياء، بدءًا من المنازل الذكية والأتمتة الصناعية إلى الرعاية الصحية والنقل، على شبكات الاتصالات اللاسلكية الموثوقة. يعد ضمان سلامة البيانات في هذه الأجهزة المترابطة أمرًا بالغ الأهمية، مما يخلق طلبًا على أجهزة اختبار الخطأ في البيانات لضمان خلو شبكات الاتصالات المستخدمة في أنظمة إنترنت الأشياء من الأخطاء وموثوقيتها وتحسينها للأداء.
- زيادة في اعتماد أنظمة الاتصالات بالألياف الضوئية: مع التوسع العالمي لشبكات الألياف الضوئية واستخدامها المتزايد في الاتصالات والإنترنت عريض النطاق، فإن الحاجة إلى اختبار BER في هذه الأنظمة تتزايد أيضًا. تتطلب أنظمة الاتصالات بالألياف الضوئية اختبارات عالية الدقة للتحقق من جودة الإشارة والحفاظ على أداء الشبكة. إن الاعتماد المتزايد على الألياف الضوئية في نقل البيانات، وخاصة في المناطق النائية والعالية الكثافة، يمثل فرصة لسوق أجهزة اختبار BER لتلبية احتياجات هذا القطاع المتوسع.
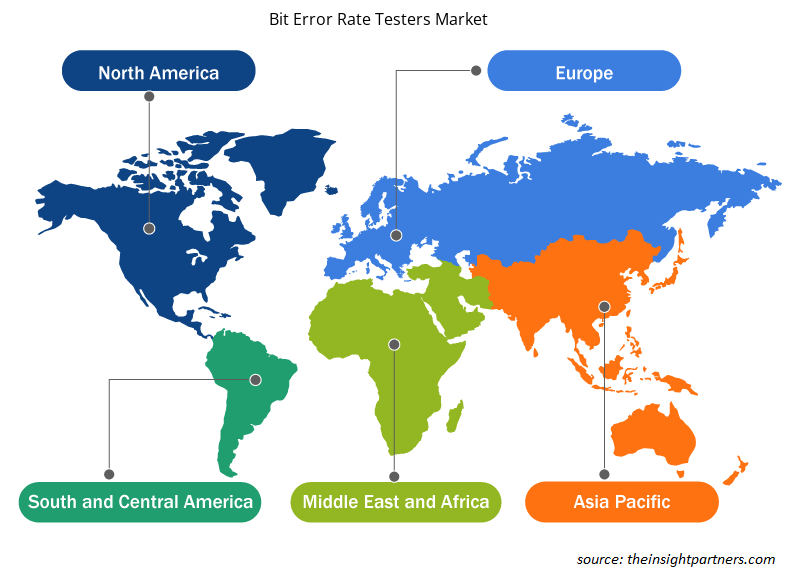
رؤى إقليمية حول سوق أجهزة اختبار معدل الخطأ في البتات
لقد قام المحللون في Insight Partners بشرح الاتجاهات والعوامل الإقليمية المؤثرة على سوق أجهزة اختبار معدل الخطأ في البتات طوال فترة التوقعات بشكل شامل. يناقش هذا القسم أيضًا قطاعات سوق أجهزة اختبار معدل الخطأ في البتات والجغرافيا في جميع أنحاء أمريكا الشمالية وأوروبا ومنطقة آسيا والمحيط الهادئ والشرق الأوسط وأفريقيا وأمريكا الجنوبية والوسطى.
- احصل على البيانات الإقليمية المحددة لسوق أجهزة اختبار معدل الخطأ في البتات
نطاق تقرير سوق أجهزة اختبار معدل الخطأ في البتات
| سمة التقرير | تفاصيل |
|---|---|
| حجم السوق في عام 2023 | XX مليون دولار أمريكي |
| حجم السوق بحلول عام 2031 | XX مليون دولار أمريكي |
| معدل النمو السنوي المركب العالمي (2023 - 2031) | 8.4% |
| البيانات التاريخية | 2021-2022 |
| فترة التنبؤ | 2024-2031 |
| القطاعات المغطاة | حسب نوع المنتج
|
| المناطق والدول المغطاة | أمريكا الشمالية
|
| قادة السوق وملفات تعريف الشركات الرئيسية |
|
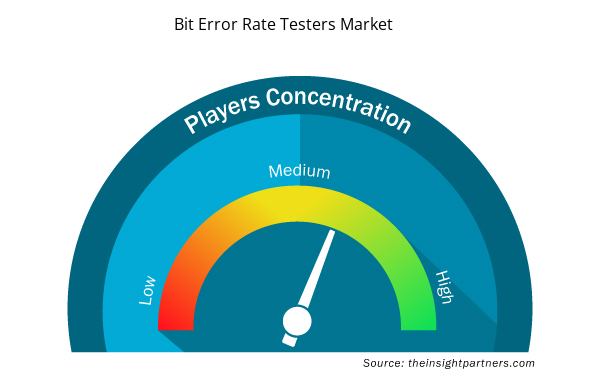
كثافة اللاعبين في سوق أجهزة اختبار معدل الخطأ في البتات: فهم تأثيرها على ديناميكيات الأعمال
يشهد سوق أجهزة اختبار معدل الخطأ في البتات نموًا سريعًا، مدفوعًا بالطلب المتزايد من جانب المستخدم النهائي بسبب عوامل مثل تفضيلات المستهلكين المتطورة والتقدم التكنولوجي والوعي المتزايد بفوائد المنتج. ومع ارتفاع الطلب، تعمل الشركات على توسيع عروضها والابتكار لتلبية احتياجات المستهلكين والاستفادة من الاتجاهات الناشئة، مما يؤدي إلى زيادة نمو السوق.
تشير كثافة اللاعبين في السوق إلى توزيع الشركات أو المؤسسات العاملة في سوق أو صناعة معينة. وهي تشير إلى عدد المنافسين (اللاعبين في السوق) الموجودين في مساحة سوق معينة نسبة إلى حجمها أو قيمتها السوقية الإجمالية.
الشركات الرئيسية العاملة في سوق أجهزة اختبار معدل الخطأ في البت هي:
- شركة ايروفلوكس
- اجيلنت تكنولوجيز
- شركة أنريتسو
- شركة EXFO
- تقنيات كيسايت
إخلاء المسؤولية : الشركات المذكورة أعلاه ليست مرتبة بأي ترتيب معين.
- احصل على نظرة عامة على أهم اللاعبين الرئيسيين في سوق أجهزة اختبار معدل الخطأ في البتات
نقاط البيع الرئيسية
- التغطية الشاملة: يغطي التقرير بشكل شامل تحليل المنتجات والخدمات والأنواع والمستخدمين النهائيين لسوق أجهزة اختبار معدل الخطأ في البت، مما يوفر صورة شاملة.
- تحليل الخبراء: تم تجميع التقرير على أساس الفهم العميق لخبراء الصناعة والمحللين.
- معلومات محدثة: يضمن التقرير أهمية الأعمال التجارية بسبب تغطيته للمعلومات الحديثة واتجاهات البيانات.
- خيارات التخصيص: يمكن تخصيص هذا التقرير لتلبية متطلبات العملاء المحددة وبما يتناسب مع استراتيجيات العمل بشكل مناسب.
وبالتالي، يمكن أن يساعد تقرير البحث حول سوق أجهزة اختبار معدل الخطأ في البت في تمهيد الطريق لفك شفرة وفهم سيناريو الصناعة وآفاق النمو. ورغم وجود بعض المخاوف المشروعة، فإن الفوائد الإجمالية لهذا التقرير تميل إلى التفوق على العيوب.

نافين خبيرٌ متمرسٌ في أبحاث السوق والاستشارات، يتمتع بخبرةٍ تزيد عن 9 سنوات في مشاريع مُخصصة ومُشتركة واستشارية. يشغل حاليًا منصب نائب الرئيس المساعد، وقد نجح في إدارة أصحاب المصلحة عبر سلسلة قيمة المشاريع، وألّف أكثر من 100 تقرير بحثي وأكثر من 30 مهمة استشارية. يمتد نطاق عمله ليشمل مشاريع صناعية وحكومية، مساهمًا بشكل كبير في نجاح العملاء واتخاذ القرارات القائمة على البيانات.
نافين حاصلٌ على شهادة في هندسة الإلكترونيات والاتصالات من جامعة فرجينيا التقنية، كارناتاكا، وشهادة ماجستير في إدارة الأعمال في التسويق والعمليات من جامعة مانيبال. وهو عضوٌ نشطٌ في معهد مهندسي الكهرباء والإلكترونيات (IEEE) لمدة 9 سنوات، حيث شارك في مؤتمراتٍ وندواتٍ تقنية، وتطوّع على مستوى الأقسام والمناطق. قبل منصبه الحالي، عمل مستشارًا استراتيجيًا مساعدًا في IndustryARC، ومستشارًا للخوادم الصناعية في شركة هيوليت باكارد (HP Global).
- التحليل التاريخي (سنتان)، سنة الأساس، التوقعات (7 سنوات) مع معدل النمو السنوي المركب
- تحليل PEST و SWOT
- حجم السوق والقيمة / الحجم - عالمي، إقليمي، بلد
- الصناعة والمنافسة
- مجموعة بيانات إكسل
التقارير الحديثة
شهادات العملاء
تقرير سوق أنظمة SCADA من Insight Partners شامل، ويقدم رؤى قيّمة حول الاتجاهات الحالية والتوقعات المستقبلية. تميّز الفريق باحترافية عالية وسرعة في الاستجابة ودعم مستمر طوال الوقت. نحن راضون جدًا ونوصي بشدة بخدماتهم.
ران كيديم شريك, شركة ريالي تكنولوجيز المحدودةطلبتُ تقريرًا عن سوق برمجيات محدد، وأعدّه الفريق في غضون أيام قليلة. كانت المعلومات ذات صلة وثيقة وعرضها جيد. ثم طلبتُ بعض التعديلات والإضافات على التقرير. وكان الفريق متجاوبًا للغاية، وحصلتُ على التقرير النهائي في أقل من أسبوع.
جان هيرفيه جين رئيس مجلس الإدارة, فيوتشر أناليتيكاعملنا مع شركة "إنسايت بارتنرز" لإجراء دراسة سوقية وتوقعات مهمة. زودونا برؤى واضحة حول الفرص والمخاطر، مما ساعدنا في صياغة خططنا. كانت أبحاثهم سهلة الاستخدام ومبنية على بيانات دقيقة، مما ساعدنا على اتخاذ قرارات ذكية وواثقة. نوصي بهم بشدة.
بيوش ناجبال نائب الرئيس الأول, شعاع عالي عالميقدّمت شركة Insight Partners أبحاثًا سوقية ثاقبة ومنظمة جيدًا بخبرة واسعة في هذا المجال. تميّز فريقهم بالاحترافية وسرعة الاستجابة طوال الوقت. وسهّل موقعهم الإلكتروني سهل الاستخدام الوصول إلى تقارير القطاع. نوصي بهم بشدة لخدمات بحثية موثوقة وعالية الجودة.
يوكيهيكو أداتشي المدير التنفيذي, ديب بلو، ذ.م.م.هذه أول مرة أشتري فيها تقرير سوق من The Insight Partners. رغم أنني كنت مترددًا في البداية، إلا أنني زرت موقعهم الإلكتروني وشعرت براحة أكبر للمخاطرة وشراء تقرير السوق. أنا راضٍ تمامًا عن جودة التقرير وخدمة العملاء. كانت لديّ عدة أسئلة وتعليقات حول التقرير الأولي، ولكن بعد بضع محادثات عبر البريد الإلكتروني مع محللهم، أعتقد أن لديّ تقريرًا يمكنني استخدامه كمدخل لعملية التخطيط الاستراتيجي لدينا. شكرًا جزيلاً لكم على تخصيص وقتكم الإضافي وجعل هذه التجربة إيجابية. سأوصي بخدماتكم للآخرين بالتأكيد، وستكونون أول من ألجأ إليه عندما نحتاج إلى المزيد من بيانات السوق.
جون سوزوكي الرئيس والرئيس التنفيذي وعضو مجلس الإدارة, بي كيه تكنولوجيزأود أن أقدّر دعمكم واحترافيتكم في الاستجابة لطلبي للحصول على معلومات بشأن سوق التشخيص المخبري للأمراض المعدية في نيجيريا. كما أُقدّر صبركم وتوجيهكم، واستعدادكم لتقديم خصم، مما مكّننا في النهاية من إتمام الصفقة. أتطلع إلى التعامل مع "ذا إنسايت بارتنرز" مستقبلًا، كل ذلك بفضل الانطباع الذي تركتموه لديّ نتيجةً لهذا اللقاء الأول.
الدكتور تشيجيوك أونيا المدير الإداري, شركة باينكريست للرعاية الصحية المحدودةسبب الشراء
- اتخاذ قرارات مدروسة
- فهم ديناميكيات السوق
- تحليل المنافسة
- رؤى العملاء
- توقعات السوق
- تخفيف المخاطر
- التخطيط الاستراتيجي
- مبررات الاستثمار
- تحديد الأسواق الناشئة
- تحسين استراتيجيات التسويق
- تعزيز الكفاءة التشغيلية
- مواكبة التوجهات التنظيمية


 احصل على عينة مجانية ل - سوق أجهزة اختبار معدل خطأ البت