سوق الطاقة النظيفة – المحركات والاتجاهات والفرص وإحصاءات النمو | 2031
البيانات التاريخية : 2021-2022 | سنة الأساس : 2022 | فترة التنبؤ : 2023-2031حجم سوق الطاقة النظيفة وتوقعاته (2021-2031)، والحصة العالمية والإقليمية، والاتجاهات، وفرص النمو. يغطي التقرير: حسب النوع (طاقة المياه والمحيطات، والطاقة الشمسية، والطاقة الحيوية، والطاقة الحرارية الأرضية، وطاقة الرياح)، والمستخدم النهائي (سكني، وتجاري، وصناعي)، والموقع الجغرافي.
- تاريخ التقرير : Mar 2026
- رمز التقرير : TIPMC100001358
- الفئة : الطاقة والقوة
- الحالة : البيانات الصادرة
- تنسيقات التقارير المتاحة :


- عدد الصفحات : 150
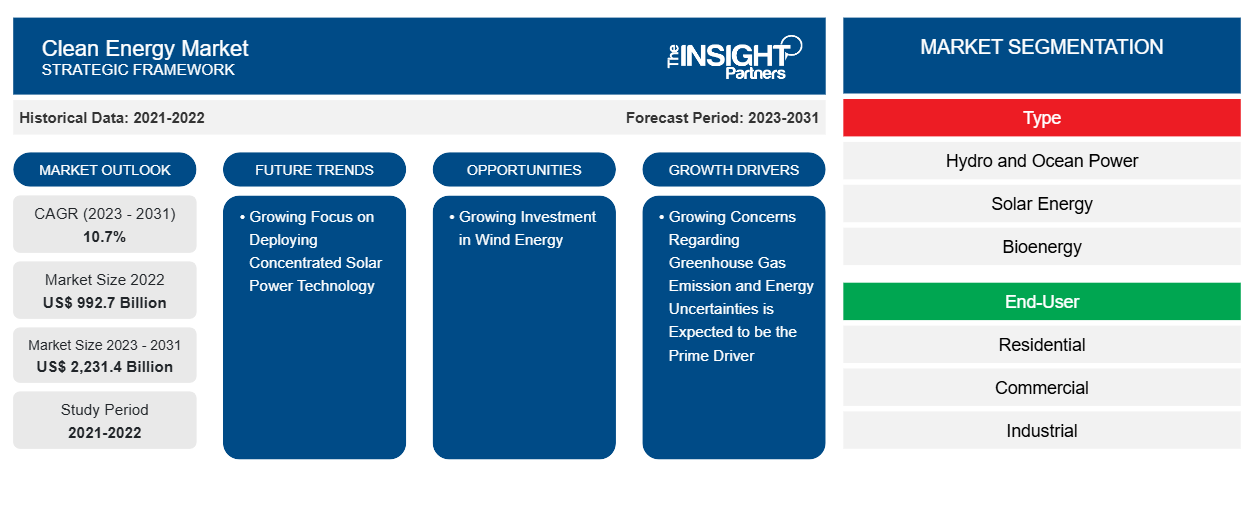
من المتوقع أن يصل حجم سوق الطاقة النظيفة إلى 2231.4 مليار دولار أمريكي بحلول عام 2031 من 992.7 مليار دولار أمريكي في عام 2022. ومن المتوقع أن يسجل السوق معدل نمو سنوي مركب بنسبة 10.7٪ خلال الفترة 2023-2031. ومن المرجح أن يظل التركيز المتزايد على الحد من انبعاثات غازات الاحتباس الحراري، والتركيز المتزايد على مصادر الطاقة المتجددة لتعزيز الاستدامة، والاهتمام المتزايد بحماية البيئة، من الاتجاهات الرئيسية في السوق.
تحليل سوق الطاقة النظيفة
إن الظروف المتغيرة للطاقة في جميع أنحاء العالم تخلق طلبًا على مصادر طاقة أكثر استدامة لتلبية الحاجة المتزايدة للطاقة. ويبرز الطلب المتزايد على الطاقة أهمية مصادر الطاقة النظيفة. ومن المتوقع أن تعمل أسعار الطاقة المرتفعة وعدم اليقين بشأن العرض بسبب التحديات الجيوسياسية المختلفة على دفع نمو سوق الطاقة النظيفة خلال فترة التنبؤ. يساعد استخدام الطاقة النظيفة في تقليل التأثيرات البيئية الضارة لموارد الطاقة القياسية مثل الفحم والنفط. وبالتالي، فرضت حكومات العديد من البلدان في جميع أنحاء العالم حوافز ضريبية وسياسات مواتية لتشجيع تبني مصادر الطاقة النظيفة، والتي تعمل كعامل دافع رئيسي للسوق.
نظرة عامة على سوق الطاقة النظيفة
مع تزايد عدد السكان والتصنيع، يرتفع الطلب على الطاقة أيضًا على المستوى العالمي. وقد أدى هذا إلى تعزيز الحاجة إلى مصادر الطاقة البديلة، حيث تؤدي مصادر الطاقة التقليدية مثل الوقود الأحفوري إلى تلوث البيئة. تعمل الخيارات البديلة النظيفة مثل الطاقة الشمسية وطاقة الرياح على الحد من انبعاثات الكربون الهائلة وتأثيرها السلبي على البيئة وتساعد في تحقيق التوازن بين العرض والطلب على الطاقة. وبالتالي، فإن الارتفاع في تطوير قطاع الطاقة المتجددة والمبادرات الحكومية الداعمة نحو استخدام نهج مستدام للحد من انبعاثات الكربون تعمل على تغذية الاستثمار في مصادر الطاقة النظيفة مثل طاقة الرياح والطاقة الشمسية والطاقة الحرارية الأرضية والطاقة الكهرومائية.
قم بتخصيص هذا التقرير ليناسب متطلباتك
ستحصل على تخصيص لأي تقرير - مجانًا - بما في ذلك أجزاء من هذا التقرير، أو تحليل على مستوى الدولة، وحزمة بيانات Excel، بالإضافة إلى الاستفادة من العروض والخصومات الرائعة للشركات الناشئة والجامعات
سوق الطاقة النظيفة: رؤى استراتيجية
-
احصل على أهم اتجاهات السوق الرئيسية لهذا التقرير.ستتضمن هذه العينة المجانية تحليلاً للبيانات، بدءًا من اتجاهات السوق وحتى التقديرات والتوقعات.
محركات وفرص سوق الطاقة النظيفة
مخاوف متزايدة بشأن انبعاثات الغازات المسببة للاحتباس الحراري وعدم اليقين بشأن الطاقة
لقد حفز تقدم نظام الطاقة في أعقاب اتفاقية باريس، التي أطلقت في عام 2015 ودخلت حيز التنفيذ في عام 2016، الاستفادة من مصادر الطاقة النظيفة لخفض انبعاثات الكربون. إن أحد المساهمين الرئيسيين في انبعاثات الغازات المسببة للانحباس الحراري العالمي التي تؤدي إلى تغير المناخ هو توليد الطاقة باستخدام الوقود الأحفوري. إن استخدام مصادر الطاقة النظيفة، مثل الطاقة الشمسية وطاقة الرياح والطاقة الكهرومائية والطاقة الحرارية الأرضية، آخذ في الارتفاع بسبب الاهتمام المتزايد بالبدائل الأكثر استدامة وصديقة للبيئة للطاقة، والمخاوف المتزايدة بشأن تغير المناخ، والمبادرات الحكومية الداعمة لتعزيز استخدام الطاقة النظيفة في جميع أنحاء العالم. إن حكومات العديد من الاقتصادات تدرك أهمية التحول إلى مصادر نظيفة لتحقيق الأهداف المستقبلية لتحقيق انبعاثات كربونية منخفضة إلى صفرية. على سبيل المثال، حددت حكومة الولايات المتحدة هدفًا لخفض انبعاثات غازات الاحتباس الحراري الصافية بنحو 50-52% مقارنة بمستويات عام 2005 بحلول عام 2030 وتحقيق انبعاثات صفرية صافية بحلول عام 2050. وعلى نحو مماثل، حددت الحكومة الألمانية هدفًا لخفض انبعاثات الكربون بنحو 65% مقارنة بمستويات عام 1990 بحلول عام 2030.
وبسبب حالة عدم اليقين المتزايدة بشأن الطاقة في أوروبا بسبب الحرب بين روسيا وأوكرانيا، حددت حكومات العديد من البلدان قدرة الطاقات النظيفة المولدة محليًا. وتشمل سوق الطاقة النظيفة مصادر الطاقة، في المقام الأول طاقة الرياح والطاقة الكهرومائية والطاقة الحرارية الأرضية والطاقة الشمسية. وبالتالي، فإن المخاوف المتزايدة بشأن انبعاثات الغازات المسببة للانحباس الحراري وعدم اليقين بشأن الطاقة تعمل كمحرك رئيسي لسوق الطاقة النظيفة.
زيادة الاستثمار في طاقة الرياح لإنشاء مصادر الطاقة البديلة
إن طاقة الرياح، التي تساعد في المقام الأول في تلبية الطلب المتزايد على الطاقة بطريقة صديقة للبيئة، تبرز كبديل مهم للوقود الأحفوري. وعلاوة على ذلك، تركز حكومات مختلف الدول على الاستثمار في مشاريع الرياح البرية والبحرية للحد من الاعتماد على الوقود الأحفوري للتخفيف من انبعاثات الكربون وتأثيراتها السامة على البيئة. ويُنظر إلى مشاريع الرياح البحرية على أنها أكثر كفاءة من مزارع الرياح البرية بسبب الاتساق الأكبر وسرعات الرياح الأعلى والافتقار إلى التدخل المادي من الأرض. كما يعمل العدد المتزايد من مشاريع الرياح البحرية كعامل تعزيز رئيسي لنمو سوق الطاقة النظيفة على مستوى العالم.
تحليل تجزئة تقرير سوق الطاقة النظيفة
إن القطاعات الرئيسية التي ساهمت في استخلاص تحليل سوق الطاقة النظيفة هي النوع والمستخدم النهائي.
- وفقًا للنوع، تم تقسيم سوق الطاقة النظيفة إلى الطاقة الكهرومائية والبحرية، والطاقة الشمسية، والطاقة الحيوية، والطاقة الحرارية الأرضية، وطاقة الرياح. احتل قطاع الطاقة الكهرومائية والبحرية أكبر حصة في السوق في عام 2023.
- بحسب المستخدم النهائي، تم تقسيم السوق إلى سكني وتجاري وصناعي. وقد هيمن القطاع السكني على السوق في عام 2023.
تحليل حصة سوق الطاقة النظيفة حسب المنطقة الجغرافية
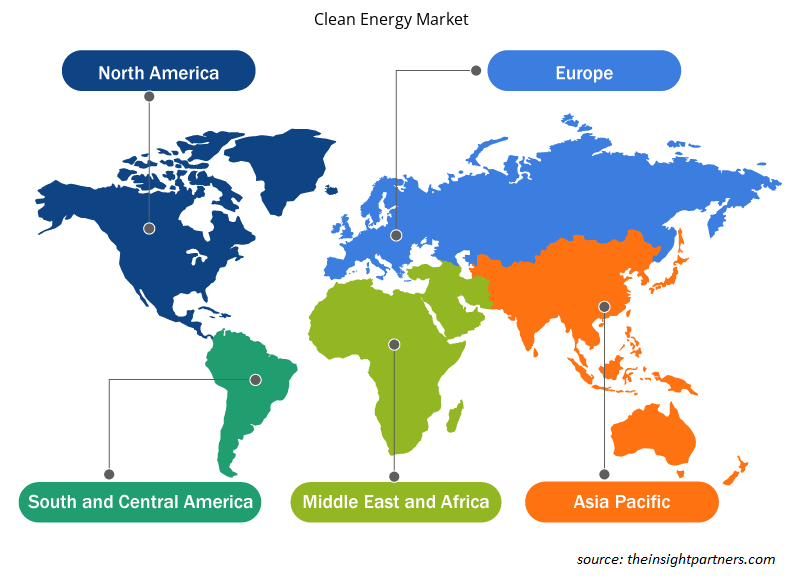
ينقسم النطاق الجغرافي لتقرير سوق الطاقة النظيفة بشكل أساسي إلى خمس مناطق: أمريكا الشمالية، وأوروبا، ومنطقة آسيا والمحيط الهادئ، والشرق الأوسط وأفريقيا، وأمريكا الجنوبية والوسطى.
سيطرت منطقة آسيا والمحيط الهادئ على سوق الطاقة النظيفة في عام 2023. يعمل النمو السكاني والطلب المتزايد على الطاقة كعامل دافع رئيسي لسوق الطاقة النظيفة في منطقة آسيا والمحيط الهادئ. بالإضافة إلى ذلك، فإن التركيز الحكومي المتزايد على بدء التدابير والسياسات الداعمة للحد من الاعتماد على الوقود الأحفوري والحد من انبعاثات الكربون من المرجح أن يدفع سوق الطاقة النظيفة في المنطقة. يعد التلوث البيئي المتزايد وتأثيرات تغير المناخ القاسية من المخاوف الرئيسية التي تحفز الحاجة إلى مصادر الطاقة البديلة النظيفة للحد من استخدام الوقود الأحفوري. على سبيل المثال، تقدم وكالة تنمية الطاقة المتجددة الهندية قروضًا منخفضة الفائدة لتطوير مشاريع الطاقة المتجددة المؤهلة في البلاد. تستهدف الهند تحقيق 50٪ من الطاقة الكهربائية التراكمية المثبتة بحلول عام 2030 من مصادر الطاقة المتجددة وانبعاثات الكربون الصافية الصفرية بحلول عام 2070. علاوة على ذلك، في عام 2022، قدمت الحكومة خطة عمل "مهمة 500 جيجاوات" لتحقيق الهدف المتجدد الإجمالي.
رؤى إقليمية حول سوق الطاقة النظيفة
لقد قام المحللون في Insight Partners بشرح الاتجاهات والعوامل الإقليمية المؤثرة على سوق الطاقة النظيفة طوال فترة التوقعات بشكل شامل. يناقش هذا القسم أيضًا قطاعات سوق الطاقة النظيفة والجغرافيا في جميع أنحاء أمريكا الشمالية وأوروبا ومنطقة آسيا والمحيط الهادئ والشرق الأوسط وأفريقيا وأمريكا الجنوبية والوسطى.
- احصل على البيانات الإقليمية المحددة لسوق الطاقة النظيفة
نطاق تقرير سوق الطاقة النظيفة
| سمة التقرير | تفاصيل |
|---|---|
| حجم السوق في عام 2022 | 992.7 مليار دولار أمريكي |
| حجم السوق بحلول عام 2031 | 2,231.4 مليار دولار أمريكي |
| معدل النمو السنوي المركب العالمي (2023 - 2031) | 10.7% |
| البيانات التاريخية | 2021-2022 |
| فترة التنبؤ | 2023-2031 |
| القطاعات المغطاة |
حسب النوع
|
| المناطق والدول المغطاة |
أمريكا الشمالية
|
| قادة السوق وملفات تعريف الشركات الرئيسية |
|
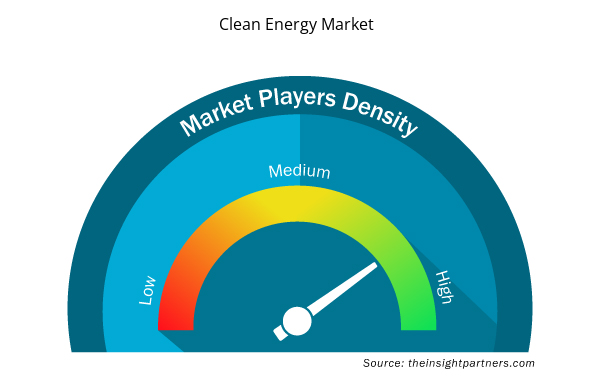
كثافة اللاعبين في سوق الطاقة النظيفة: فهم تأثيرها على ديناميكيات الأعمال
يشهد سوق الطاقة النظيفة نموًا سريعًا، مدفوعًا بالطلب المتزايد من جانب المستخدم النهائي بسبب عوامل مثل تفضيلات المستهلكين المتطورة والتقدم التكنولوجي والوعي المتزايد بفوائد المنتج. ومع ارتفاع الطلب، تعمل الشركات على توسيع عروضها والابتكار لتلبية احتياجات المستهلكين والاستفادة من الاتجاهات الناشئة، مما يؤدي إلى زيادة نمو السوق.
تشير كثافة اللاعبين في السوق إلى توزيع الشركات أو المؤسسات العاملة في سوق أو صناعة معينة. وهي تشير إلى عدد المنافسين (اللاعبين في السوق) الموجودين في مساحة سوق معينة نسبة إلى حجمها أو قيمتها السوقية الإجمالية.
الشركات الرئيسية العاملة في سوق الطاقة النظيفة هي:
- شركة إكسيل للطاقة
- شركة إي دي إف للطاقة
- شركة سيمنز للطاقة
- إينيل إس بي إيه
- شركة أندريتز
إخلاء المسؤولية : الشركات المذكورة أعلاه ليست مرتبة بأي ترتيب معين.
- احصل على نظرة عامة على أهم اللاعبين الرئيسيين في سوق الطاقة النظيفة
أخبار سوق الطاقة النظيفة والتطورات الأخيرة
يتم تقييم سوق الطاقة النظيفة من خلال جمع البيانات النوعية والكمية بعد البحث الأولي والثانوي، والتي تتضمن منشورات الشركات المهمة وبيانات الجمعيات وقواعد البيانات. فيما يلي بعض التطورات في سوق الطاقة النظيفة:
- أعلنت شركة Canadian Solar Inc. أن حكومة بلدية مدينة يانغتشو في مقاطعة جيانغسو بالصين، وقعت اتفاقية استثمار متعددة السنوات مع شركتها التابعة المملوكة لها بالأغلبية، CSI Solar Co Ltd. ووفقًا للاتفاقية، تخطط CSI Solar لتوسيع قدرة منطقة التصنيع للطاقة النظيفة في يانغتشو على تصنيع رقائق وخلايا ووحدات عالية الكفاءة ومتكاملة رأسياً، بالإضافة إلى أنظمة البطاريات. (المصدر: بيان صحفي/موقع الشركة على الويب/النشرة الإخبارية، يناير 2023)
- أعلنت شركة Composites, Inc. (TPI) (Nasdaq: TPIC)، وهي شركة عالمية تركز على الحلول المبتكرة والمستدامة، أنها جددت اتفاقيات التوريد مع GE Renewable Energy حتى عام 2025. كما تخطط GE وTPI للعمل معًا على أنواع شفرات الجيل التالي من GE، بما في ذلك إمكانية زيادة خطوط الإنتاج في عام 2023 بالإضافة إلى خطوط الإنتاج التسعة التي تعمل بها GE مع TPI. (المصدر: بيان صحفي/موقع الشركة/النشرة الإخبارية، يناير 2023)
تغطية تقرير سوق الطاقة النظيفة والمنتجات النهائية
يوفر تقرير "حجم سوق الطاقة النظيفة والتوقعات (2021-2031)" تحليلاً مفصلاً للسوق يغطي المجالات التالية:
- حجم سوق الطاقة النظيفة وتوقعاته على المستويات العالمية والإقليمية والوطنية لجميع قطاعات السوق الرئيسية التي يغطيها النطاق
- اتجاهات سوق الطاقة النظيفة بالإضافة إلى ديناميكيات السوق مثل المحركات والقيود والفرص الرئيسية
- تحليل مفصل لقوى PEST/Porter الخمس وSWOT
- تحليل سوق الطاقة النظيفة الذي يغطي اتجاهات السوق الرئيسية والإطار العالمي والإقليمي والجهات الفاعلة الرئيسية واللوائح والتطورات الأخيرة في السوق
- تحليل المشهد الصناعي والمنافسة الذي يغطي تركيز السوق، وتحليل خريطة الحرارة، واللاعبين البارزين، والتطورات الأخيرة لسوق الطاقة النظيفة
- ملفات تعريف الشركة التفصيلية

نيفيديتا خبيرة أبحاث مُتميزة، تتمتع بخبرة تزيد عن 9 سنوات في أبحاث السوق واستشارات الأعمال. تشغل حاليًا منصب مديرة مشاريع في مجال تكنولوجيا المعلومات والاتصالات لدى شركة "ذا إنسايت بارتنرز"، وتتمتع بخبرة واسعة في إدارة وتنفيذ مهام الأبحاث المُجمعة والمُخصصة والقائمة على الاشتراكات والاستشارات في مختلف قطاعات التكنولوجيا.
بفضل سجلها الحافل في تقديم تحليلات قائمة على البيانات ورؤى عملية، ساهمت نيفيديتا بشكل رئيسي في العديد من المشاريع الحيوية. يشمل عملها تنفيذ المشاريع من البداية إلى النهاية، بدءًا من فهم أهداف العملاء، وتحليل اتجاهات السوق، وصولًا إلى استخلاص التوصيات الاستراتيجية. وقد تعاونت على نطاق واسع مع شركات رائدة في مجال تكنولوجيا المعلومات والاتصالات، مما ساعدها على تحديد فرص السوق ومواكبة تحولات القطاع.
تحمل نيفيديتا ماجستير إدارة أعمال في الإدارة من شركة "آي إم إس" في دهرادون. قبل انضمامها إلى "ذا إنسايت بارتنرز"، اكتسبت خبرة قيّمة في شركتي "ماركتس آند ماركتس" و"فيوتشر ماركت إنسايتس" في بونا، حيث شغلت مناصب بحثية مُختلفة وبنت أساسًا قويًا في تحليل القطاع والتفاعل مع العملاء.
- التحليل التاريخي (سنتان)، سنة الأساس، التوقعات (7 سنوات) مع معدل النمو السنوي المركب
- تحليل PEST و SWOT
- حجم السوق والقيمة / الحجم - عالمي، إقليمي، بلد
- الصناعة والمنافسة
- مجموعة بيانات إكسل
التقارير الحديثة
شهادات العملاء
تقرير سوق أنظمة SCADA من Insight Partners شامل، ويقدم رؤى قيّمة حول الاتجاهات الحالية والتوقعات المستقبلية. تميّز الفريق باحترافية عالية وسرعة في الاستجابة ودعم مستمر طوال الوقت. نحن راضون جدًا ونوصي بشدة بخدماتهم.
ران كيديم شريك, شركة ريالي تكنولوجيز المحدودةطلبتُ تقريرًا عن سوق برمجيات محدد، وأعدّه الفريق في غضون أيام قليلة. كانت المعلومات ذات صلة وثيقة وعرضها جيد. ثم طلبتُ بعض التعديلات والإضافات على التقرير. وكان الفريق متجاوبًا للغاية، وحصلتُ على التقرير النهائي في أقل من أسبوع.
جان هيرفيه جين رئيس مجلس الإدارة, فيوتشر أناليتيكاعملنا مع شركة "إنسايت بارتنرز" لإجراء دراسة سوقية وتوقعات مهمة. زودونا برؤى واضحة حول الفرص والمخاطر، مما ساعدنا في صياغة خططنا. كانت أبحاثهم سهلة الاستخدام ومبنية على بيانات دقيقة، مما ساعدنا على اتخاذ قرارات ذكية وواثقة. نوصي بهم بشدة.
بيوش ناجبال نائب الرئيس الأول, شعاع عالي عالميقدّمت شركة Insight Partners أبحاثًا سوقية ثاقبة ومنظمة جيدًا بخبرة واسعة في هذا المجال. تميّز فريقهم بالاحترافية وسرعة الاستجابة طوال الوقت. وسهّل موقعهم الإلكتروني سهل الاستخدام الوصول إلى تقارير القطاع. نوصي بهم بشدة لخدمات بحثية موثوقة وعالية الجودة.
يوكيهيكو أداتشي المدير التنفيذي, ديب بلو، ذ.م.م.هذه أول مرة أشتري فيها تقرير سوق من The Insight Partners. رغم أنني كنت مترددًا في البداية، إلا أنني زرت موقعهم الإلكتروني وشعرت براحة أكبر للمخاطرة وشراء تقرير السوق. أنا راضٍ تمامًا عن جودة التقرير وخدمة العملاء. كانت لديّ عدة أسئلة وتعليقات حول التقرير الأولي، ولكن بعد بضع محادثات عبر البريد الإلكتروني مع محللهم، أعتقد أن لديّ تقريرًا يمكنني استخدامه كمدخل لعملية التخطيط الاستراتيجي لدينا. شكرًا جزيلاً لكم على تخصيص وقتكم الإضافي وجعل هذه التجربة إيجابية. سأوصي بخدماتكم للآخرين بالتأكيد، وستكونون أول من ألجأ إليه عندما نحتاج إلى المزيد من بيانات السوق.
جون سوزوكي الرئيس والرئيس التنفيذي وعضو مجلس الإدارة, بي كيه تكنولوجيزأود أن أقدّر دعمكم واحترافيتكم في الاستجابة لطلبي للحصول على معلومات بشأن سوق التشخيص المخبري للأمراض المعدية في نيجيريا. كما أُقدّر صبركم وتوجيهكم، واستعدادكم لتقديم خصم، مما مكّننا في النهاية من إتمام الصفقة. أتطلع إلى التعامل مع "ذا إنسايت بارتنرز" مستقبلًا، كل ذلك بفضل الانطباع الذي تركتموه لديّ نتيجةً لهذا اللقاء الأول.
الدكتور تشيجيوك أونيا المدير الإداري, شركة باينكريست للرعاية الصحية المحدودةسبب الشراء
- اتخاذ قرارات مدروسة
- فهم ديناميكيات السوق
- تحليل المنافسة
- رؤى العملاء
- توقعات السوق
- تخفيف المخاطر
- التخطيط الاستراتيجي
- مبررات الاستثمار
- تحديد الأسواق الناشئة
- تحسين استراتيجيات التسويق
- تعزيز الكفاءة التشغيلية
- مواكبة التوجهات التنظيمية


 احصل على عينة مجانية ل - سوق الطاقة النظيفة