نمو سوق علامات المرافق والحجم والحصة والاتجاهات وتحليل اللاعبين الرئيسيين والتوقعات حتى عام 2031
البيانات التاريخية : 2021-2023 | سنة الأساس : 2024 | فترة التنبؤ : 2025-2031حجم سوق علامات المرافق وتوقعاته (2021-2031)، والحصة العالمية والإقليمية، والاتجاهات، وفرص النمو. يغطي التقرير تحليلًا للقطاعات: حسب النوع (علامات الكرة، علامات القرص، علامات الشريط، علامات المسامير)، والتكوين (سلبي، قابل للبرمجة)، ونوع المرافق (الغاز، الطاقة، الاتصالات، المياه والصرف الصحي).
- تاريخ التقرير : Feb 2026
- رمز التقرير : TIPRE00039665
- الفئة : الطاقة والقوة
- الحالة : قادم
- تنسيقات التقارير المتاحة :


- عدد الصفحات : 150
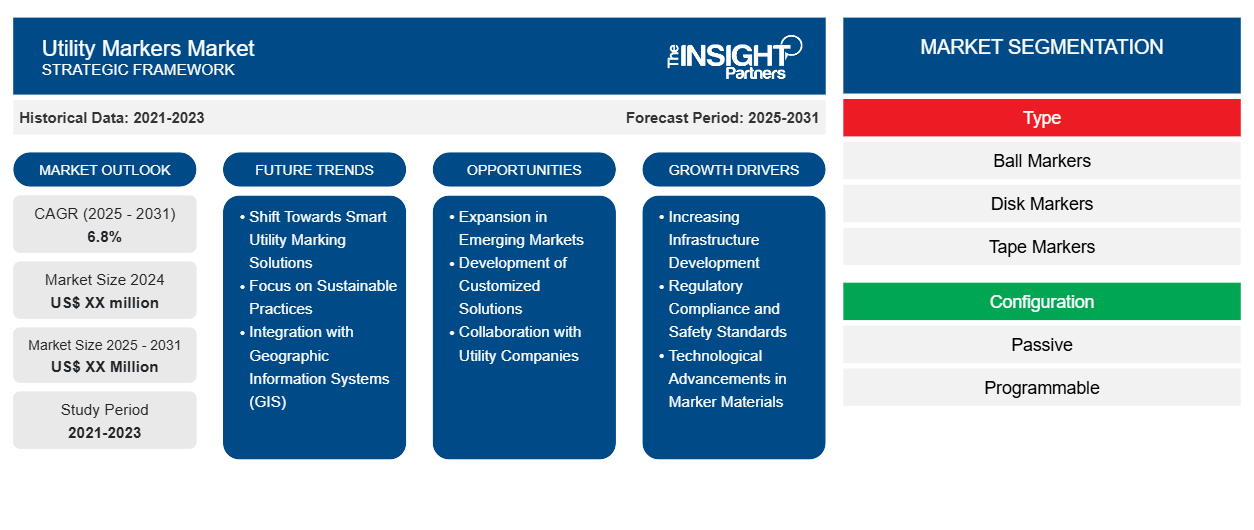
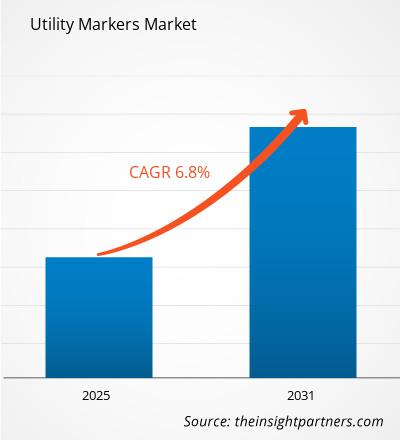
من المتوقع أن يسجل سوق علامات المرافق معدل نمو سنوي مركب بنسبة 6.8٪ من عام 2025 إلى عام 2031، مع توسع حجم السوق من XX مليون دولار أمريكي في عام 2024 إلى XX مليون دولار أمريكي بحلول عام 2031.
تم تقسيم التقرير حسب النوع (علامات الكرة، علامات القرص، علامات الشريط، علامات المسامير)، التكوين (سلبي، قابل للبرمجة)، نوع المرافق (الغاز، الطاقة، الاتصالات، المياه ومياه الصرف الصحي)
غرض التقرير
يهدف تقرير "سوق علامات المرافق" الصادر عن شركة "ذا إنسايت بارتنرز" إلى وصف المشهد الحالي والنمو المستقبلي، وأهم العوامل المحفزة، والتحديات، والفرص المتاحة. وسيوفر هذا التقرير رؤى ثاقبة لمختلف أصحاب المصلحة في قطاع الأعمال، مثل:
- مزودي التكنولوجيا/المصنعين: لفهم ديناميكيات السوق المتطورة ومعرفة فرص النمو المحتملة، وتمكينهم من اتخاذ قرارات استراتيجية مستنيرة.
- المستثمرون: إجراء تحليل شامل للاتجاهات فيما يتعلق بمعدل نمو السوق، والتوقعات المالية للسوق، والفرص المتاحة عبر سلسلة القيمة.
- الهيئات التنظيمية: لتنظيم السياسات ومراقبة الأنشطة في السوق بهدف تقليل الانتهاكات والحفاظ على ثقة المستثمرين ودعم سلامة السوق واستقرارها.
تجزئة سوق علامات المرافق
يكتب
- علامات الكرة
- علامات القرص
- علامات الشريط
- علامات المسامير
إعدادات
- سلبي
- قابلة للبرمجة
نوع الأداة المساعدة
- الغاز
- قوة
- الاتصالات السلكية واللاسلكية
- المياه والصرف الصحي
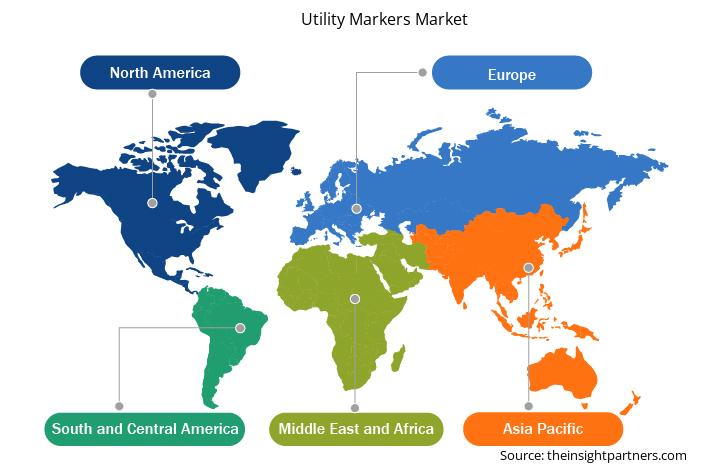
الجغرافيا
- أمريكا الشمالية
- أوروبا
- آسيا والمحيط الهادئ
- الشرق الأوسط وأفريقيا
- أمريكا الجنوبية والوسطى
قم بتخصيص هذا التقرير ليناسب متطلباتك
ستحصل على تخصيص لأي تقرير - مجانًا - بما في ذلك أجزاء من هذا التقرير، أو تحليل على مستوى الدولة، وحزمة بيانات Excel، بالإضافة إلى الاستفادة من العروض والخصومات الرائعة للشركات الناشئة والجامعات
سوق علامات المرافق: رؤى استراتيجية
-
احصل على أهم اتجاهات السوق الرئيسية لهذا التقرير.ستتضمن هذه العينة المجانية تحليل البيانات، بدءًا من اتجاهات السوق وحتى التقديرات والتوقعات.
عوامل نمو سوق علامات المرافق
- تزايد تطوير البنية التحتية: يشهد سوق علامات المرافق نموًا ملحوظًا بفضل التطوير المستمر للبنية التحتية حول العالم. ومع توسع المدن وظهور مشاريع بناء جديدة، تزداد الحاجة إلى حلول علامات فعّالة لتحديد المرافق تحت الأرض، مثل المياه والغاز والكهرباء والاتصالات. تُعدّ علامات المرافق أدوات أساسية لمنع الأضرار العرضية أثناء أعمال الحفر والبناء، مما يضمن السلامة والامتثال للأنظمة. ويرتبط هذا الطلب المتزايد على حلول تحديد المرافق ارتباطًا مباشرًا بتزايد عدد مشاريع البنية التحتية قيد التنفيذ.
- الامتثال التنظيمي ومعايير السلامة: تُعدّ الأطر التنظيمية الصارمة ومعايير السلامة التي تفرضها الجهات الحكومية دافعًا رئيسيًا لسوق علامات المرافق. ويتعين على المرافق الالتزام بمتطلبات محددة للعلامات لضمان السلامة العامة ومنع الحوادث أثناء أعمال البناء والصيانة. وتساعد علامات المرافق في تحديد الخطوط والمنشآت تحت الأرض بوضوح، مما يقلل من خطر الحوادث. ومع ازدياد صرامة اللوائح، من المتوقع أن يزداد الطلب على حلول موثوقة ودائمة لعلامات المرافق، مما يدعم توسع السوق.
- التطورات التكنولوجية في مواد العلامات: يستفيد سوق علامات المرافق من التطورات المستمرة في المواد وتقنيات العلامات. تُعزز ابتكارات مثل البلاستيك المقاوم للأشعة فوق البنفسجية، والطلاءات العاكسة، والمواد القابلة للتحلل الحيوي متانة علامات المرافق ووضوحها واستدامتها البيئية. لا تقتصر هذه التطورات على تحسين عمر العلامات وفعاليتها فحسب، بل تُلبي أيضًا الطلب المتزايد على الحلول الصديقة للبيئة في مختلف الصناعات. ومع اعتماد المُصنّعين لمواد وتقنيات جديدة، يُتوقع لسوق علامات المرافق أن يشهد نموًا مُتسارعًا، بما يتماشى مع توجهات الصناعة نحو الاستدامة والابتكار.
اتجاهات مستقبل سوق علامات المرافق
- التحول نحو حلول ذكية لعلامات المرافق: من أبرز التوجهات في سوق علامات المرافق التحول نحو حلول ذكية لعلامات المرافق، تدمج التكنولوجيا لتحسين الأداء. يتيح دمج ميزات مثل رموز الاستجابة السريعة (QR Codes) وعلامات تحديد الترددات الراديوية (RFID) وتتبع نظام تحديد المواقع العالمي (GPS) في علامات المرافق جمع بيانات أفضل، وإدارة الأصول، والمراقبة الفورية لشبكات المرافق. تُمكّن هذه الحلول الذكية شركات المرافق من إدارة أصولها بكفاءة، مما يُحسّن الكفاءة التشغيلية ويُخفّض التكاليف. مع تبنّي القطاع للتحول الرقمي، من المتوقع أن يزداد الطلب على حلول ذكية لعلامات المرافق.
- التركيز على الممارسات المستدامة: يؤثر التركيز المتزايد على الاستدامة في مختلف القطاعات على سوق علامات المرافق، حيث يتزايد اعتماد المصنّعين لمواد وممارسات صديقة للبيئة. ويتزايد الطلب على علامات المرافق المصنوعة من مواد مُعاد تدويرها أو قابلة للتحلل الحيوي، مما يعكس التزامًا أوسع بالحد من الأثر البيئي. ويعود هذا التوجه إلى الضغوط التنظيمية وتفضيلات المستهلكين للمنتجات المستدامة. ويمكن للشركات التي تُولي الاستدامة الأولوية في حلولها لعلامات المرافق أن تُميّز نفسها في السوق، مع تلبية توقعات المستهلكين والجهات التنظيمية المعنية بالبيئة.
- التكامل مع نظم المعلومات الجغرافية (GIS): يُعدّ دمج علامات المرافق مع تقنية نظم المعلومات الجغرافية (GIS) اتجاهًا بارزًا في السوق. تتيح تقنية نظم المعلومات الجغرافية رسم خرائط وتصور شبكات المرافق، مما يوفر بيانات قيّمة للتخطيط والإدارة. من خلال ربط علامات المرافق بقواعد بيانات نظم المعلومات الجغرافية، يمكن للمؤسسات تحسين ممارسات إدارة أصولها، وتعزيز كفاءتها التشغيلية، وتسهيل عمليات اتخاذ القرار. ويكتسب هذا الاتجاه أهمية خاصة في ظل سعي شركات المرافق إلى تحسين شبكاتها وتقديم خدماتها من خلال مناهج قائمة على البيانات.
فرص سوق علامات المرافق
- التوسع في الأسواق الناشئة: يوفر سوق علامات المرافق فرص نمو كبيرة في الأسواق الناشئة، حيث يتسارع تطوير البنية التحتية. تستثمر دول في مناطق مثل آسيا والمحيط الهادئ وأمريكا اللاتينية وأفريقيا بكثافة في تحديث بنيتها التحتية للمرافق لدعم النمو الاقتصادي والتوسع العمراني. يخلق هذا التوسع طلبًا على حلول فعّالة لعلامات المرافق لضمان ممارسات بناء وصيانة آمنة. يمكن للشركات التي تؤسس حضورًا في هذه الأسواق الاستفادة من الطلب المتزايد على علامات المرافق، مما يعزز مبيعاتها وحصتها السوقية.
- تطوير حلول مُخصصة: تتزايد فرص المُصنِّعين لتطوير حلول مُخصصة لعلامات المرافق، مُصممة خصيصًا لتلبية احتياجات قطاعية مُحددة ومتطلبات جغرافية مُحددة. تواجه قطاعات مُختلفة، مثل الاتصالات والنفط والغاز وإدارة المياه، تحديات فريدة فيما يتعلق بتحديد وتمييز المرافق. من خلال تقديم حلول مُتخصصة تُلبي هذه الاحتياجات المُحددة، يُمكن للمُصنِّعين تمييز أنفسهم في السوق، وبناء علاقات وطيدة مع العملاء، وتعزيز قدرتهم التنافسية.
- التعاون مع شركات المرافق: يُمثل التعاون بين مُصنّعي علامات المرافق وشركات المرافق فرصةً واعدةً للابتكار والنمو. فمن خلال التعاون الوثيق مع شركات المرافق، يُمكن للمُصنّعين اكتساب رؤىً حول التحديات والمتطلبات المُحددة، مما يُمكّنهم من تطوير حلول علامات مُصممة خصيصًا تُعزز السلامة والكفاءة. ويمكن أن تُؤدي هذه الشراكات إلى ابتكار منتجات وخدمات جديدة تُلبي احتياجات القطاع المُتطورة، وتُعزز العلاقات طويلة الأمد، وتُحفّز نمو الأعمال في سوق علامات المرافق.
رؤى إقليمية حول سوق علامات المرافق
قام محللو إنسايت بارتنرز بشرح شامل للاتجاهات الإقليمية والعوامل المؤثرة في سوق علامات المرافق خلال فترة التوقعات. ويناقش هذا القسم أيضًا قطاعات سوق علامات المرافق ونطاقه الجغرافي في أمريكا الشمالية، وأوروبا، وآسيا والمحيط الهادئ، والشرق الأوسط وأفريقيا، وأمريكا الجنوبية والوسطى.
- احصل على البيانات الإقليمية المحددة لسوق علامات المرافق
نطاق تقرير سوق علامات المرافق
| سمة التقرير | تفاصيل |
|---|---|
| حجم السوق في عام 2024 | XX مليون دولار أمريكي |
| حجم السوق بحلول عام 2031 | XX مليون دولار أمريكي |
| معدل النمو السنوي المركب العالمي (2025 - 2031) | 6.8% |
| البيانات التاريخية | 2021-2023 |
| فترة التنبؤ | 2025-2031 |
| القطاعات المغطاة |
حسب النوع
|
| المناطق والدول المغطاة |
أمريكا الشمالية
|
| قادة السوق وملفات تعريف الشركات الرئيسية |
|
كثافة اللاعبين في سوق علامات المرافق: فهم تأثيرها على ديناميكيات الأعمال
يشهد سوق علامات المرافق نموًا سريعًا، مدفوعًا بتزايد طلب المستخدمين النهائيين نتيجةً لعوامل مثل تطور تفضيلات المستهلكين، والتقدم التكنولوجي، وزيادة الوعي بمزايا المنتج. ومع تزايد الطلب، تعمل الشركات على توسيع عروضها، والابتكار لتلبية احتياجات المستهلكين، والاستفادة من الاتجاهات الناشئة، مما يُعزز نمو السوق.
تشير كثافة اللاعبين في السوق إلى توزيع الشركات العاملة في سوق أو قطاع معين. وتشير إلى عدد المنافسين (اللاعبين في السوق) الموجودين في سوق معين نسبةً إلى حجمه أو قيمته السوقية الإجمالية.
الشركات الرئيسية العاملة في سوق علامات المرافق هي:
- 3م
- شركة تيمبو للاتصالات
- مجمع
- مجموعة هيكساترونيك AB
- شركة الكشف الراديوي المحدودة
- شركة رايكوم للأدوات
إخلاء المسؤولية : الشركات المذكورة أعلاه ليست مرتبة بأي ترتيب معين.
- احصل على نظرة عامة على أهم اللاعبين الرئيسيين في سوق علامات المرافق
نقاط البيع الرئيسية
- التغطية الشاملة: يغطي التقرير بشكل شامل تحليل المنتجات والخدمات والأنواع والمستخدمين النهائيين لسوق علامات المرافق، مما يوفر مشهدًا شاملاً.
- تحليل الخبراء: تم تجميع التقرير على أساس الفهم العميق لخبراء الصناعة والمحللين.
- معلومات محدثة: يضمن التقرير أهمية الأعمال التجارية بسبب تغطيته للمعلومات الحديثة واتجاهات البيانات.
- خيارات التخصيص: يمكن تخصيص هذا التقرير لتلبية متطلبات العملاء المحددة وتلبية استراتيجيات العمل بشكل مناسب.
لذا، يُمكن أن يُساعد تقرير البحث حول سوق علامات المرافق في تمهيد الطريق لفهم سيناريوهات الصناعة وآفاق نموها. ورغم وجود بعض المخاوف المُبررة، إلا أن فوائد هذا التقرير الإجمالية تفوق عيوبه.

نيفيديتا خبيرة أبحاث مُتميزة، تتمتع بخبرة تزيد عن 9 سنوات في أبحاث السوق واستشارات الأعمال. تشغل حاليًا منصب مديرة مشاريع في مجال تكنولوجيا المعلومات والاتصالات لدى شركة "ذا إنسايت بارتنرز"، وتتمتع بخبرة واسعة في إدارة وتنفيذ مهام الأبحاث المُجمعة والمُخصصة والقائمة على الاشتراكات والاستشارات في مختلف قطاعات التكنولوجيا.
بفضل سجلها الحافل في تقديم تحليلات قائمة على البيانات ورؤى عملية، ساهمت نيفيديتا بشكل رئيسي في العديد من المشاريع الحيوية. يشمل عملها تنفيذ المشاريع من البداية إلى النهاية، بدءًا من فهم أهداف العملاء، وتحليل اتجاهات السوق، وصولًا إلى استخلاص التوصيات الاستراتيجية. وقد تعاونت على نطاق واسع مع شركات رائدة في مجال تكنولوجيا المعلومات والاتصالات، مما ساعدها على تحديد فرص السوق ومواكبة تحولات القطاع.
تحمل نيفيديتا ماجستير إدارة أعمال في الإدارة من شركة "آي إم إس" في دهرادون. قبل انضمامها إلى "ذا إنسايت بارتنرز"، اكتسبت خبرة قيّمة في شركتي "ماركتس آند ماركتس" و"فيوتشر ماركت إنسايتس" في بونا، حيث شغلت مناصب بحثية مُختلفة وبنت أساسًا قويًا في تحليل القطاع والتفاعل مع العملاء.
- التحليل التاريخي (سنتان)، سنة الأساس، التوقعات (7 سنوات) مع معدل النمو السنوي المركب
- تحليل PEST و SWOT
- حجم السوق والقيمة / الحجم - عالمي، إقليمي، بلد
- الصناعة والمنافسة
- مجموعة بيانات إكسل
التقارير الحديثة
شهادات العملاء
تقرير سوق أنظمة SCADA من Insight Partners شامل، ويقدم رؤى قيّمة حول الاتجاهات الحالية والتوقعات المستقبلية. تميّز الفريق باحترافية عالية وسرعة في الاستجابة ودعم مستمر طوال الوقت. نحن راضون جدًا ونوصي بشدة بخدماتهم.
ران كيديم شريك, شركة ريالي تكنولوجيز المحدودةطلبتُ تقريرًا عن سوق برمجيات محدد، وأعدّه الفريق في غضون أيام قليلة. كانت المعلومات ذات صلة وثيقة وعرضها جيد. ثم طلبتُ بعض التعديلات والإضافات على التقرير. وكان الفريق متجاوبًا للغاية، وحصلتُ على التقرير النهائي في أقل من أسبوع.
جان هيرفيه جين رئيس مجلس الإدارة, فيوتشر أناليتيكاعملنا مع شركة "إنسايت بارتنرز" لإجراء دراسة سوقية وتوقعات مهمة. زودونا برؤى واضحة حول الفرص والمخاطر، مما ساعدنا في صياغة خططنا. كانت أبحاثهم سهلة الاستخدام ومبنية على بيانات دقيقة، مما ساعدنا على اتخاذ قرارات ذكية وواثقة. نوصي بهم بشدة.
بيوش ناجبال نائب الرئيس الأول, شعاع عالي عالميقدّمت شركة Insight Partners أبحاثًا سوقية ثاقبة ومنظمة جيدًا بخبرة واسعة في هذا المجال. تميّز فريقهم بالاحترافية وسرعة الاستجابة طوال الوقت. وسهّل موقعهم الإلكتروني سهل الاستخدام الوصول إلى تقارير القطاع. نوصي بهم بشدة لخدمات بحثية موثوقة وعالية الجودة.
يوكيهيكو أداتشي المدير التنفيذي, ديب بلو، ذ.م.م.هذه أول مرة أشتري فيها تقرير سوق من The Insight Partners. رغم أنني كنت مترددًا في البداية، إلا أنني زرت موقعهم الإلكتروني وشعرت براحة أكبر للمخاطرة وشراء تقرير السوق. أنا راضٍ تمامًا عن جودة التقرير وخدمة العملاء. كانت لديّ عدة أسئلة وتعليقات حول التقرير الأولي، ولكن بعد بضع محادثات عبر البريد الإلكتروني مع محللهم، أعتقد أن لديّ تقريرًا يمكنني استخدامه كمدخل لعملية التخطيط الاستراتيجي لدينا. شكرًا جزيلاً لكم على تخصيص وقتكم الإضافي وجعل هذه التجربة إيجابية. سأوصي بخدماتكم للآخرين بالتأكيد، وستكونون أول من ألجأ إليه عندما نحتاج إلى المزيد من بيانات السوق.
جون سوزوكي الرئيس والرئيس التنفيذي وعضو مجلس الإدارة, بي كيه تكنولوجيزأود أن أقدّر دعمكم واحترافيتكم في الاستجابة لطلبي للحصول على معلومات بشأن سوق التشخيص المخبري للأمراض المعدية في نيجيريا. كما أُقدّر صبركم وتوجيهكم، واستعدادكم لتقديم خصم، مما مكّننا في النهاية من إتمام الصفقة. أتطلع إلى التعامل مع "ذا إنسايت بارتنرز" مستقبلًا، كل ذلك بفضل الانطباع الذي تركتموه لديّ نتيجةً لهذا اللقاء الأول.
الدكتور تشيجيوك أونيا المدير الإداري, شركة باينكريست للرعاية الصحية المحدودةسبب الشراء
- اتخاذ قرارات مدروسة
- فهم ديناميكيات السوق
- تحليل المنافسة
- رؤى العملاء
- توقعات السوق
- تخفيف المخاطر
- التخطيط الاستراتيجي
- مبررات الاستثمار
- تحديد الأسواق الناشئة
- تحسين استراتيجيات التسويق
- تعزيز الكفاءة التشغيلية
- مواكبة التوجهات التنظيمية


 احصل على عينة مجانية ل - سوق علامات المرافق