تحليل سوق أنبوب تكثيف الصور والتنبؤ به حسب الحجم والمشاركة والنمو والاتجاهات 2031
البيانات التاريخية : 2021-2022 | سنة الأساس : 2023 | فترة التنبؤ : 2024-2031حجم سوق أنابيب تكثيف الصور وتوقعاتها (2021-2031)، والحصة العالمية والإقليمية، والاتجاهات، وفرص النمو. تغطية التقرير: حسب الجيل (الجيل الأول، والجيل الثاني، والجيل الثالث)، والمستخدم النهائي (العسكري، والرعاية الصحية، والتكنولوجيا الحيوية، وغيرها)، والجغرافيا.
- تاريخ التقرير : Jan 2026
- رمز التقرير : TIPRE00010542
- الفئة : الإلكترونيات وأشباه الموصلات
- الحالة : البيانات الصادرة
- تنسيقات التقارير المتاحة :


- عدد الصفحات : 150
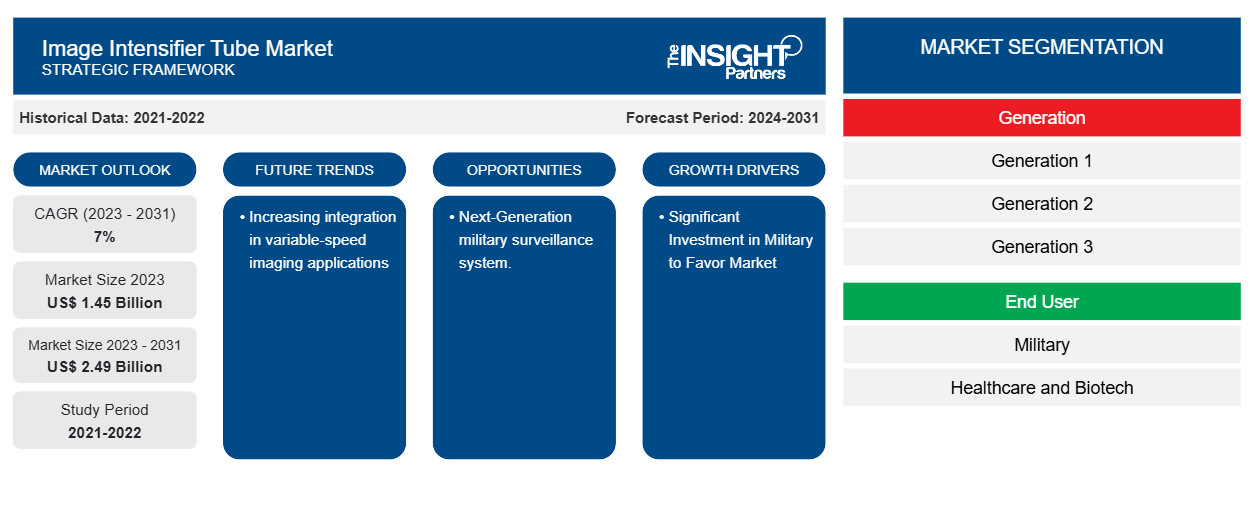
من المتوقع أن يصل حجم سوق أنابيب تكثيف الصور إلى 2.49 مليار دولار أمريكي بحلول عام 2031 من 1.45 مليار دولار أمريكي في عام 2023. ومن المتوقع أن يسجل السوق معدل نمو سنوي مركب بنسبة 7.0٪ خلال الفترة 2023-2031. ومن المرجح أن تظل العقود المتزايدة لشراء وتطوير أنظمة الرؤية الليلية والطلب المتزايد على أجهزة الأشعة السينية من الاتجاهات الرئيسية في السوق.
تحليل سوق أنابيب تكثيف الصورة
من المتوقع أن ينمو الطلب على سوق أنابيب تكثيف الصور مع زيادة عمليات شراء أنظمة الكاميرات عالية السرعة، بما في ذلك HiCATT، وهو ملحق تكثيف لأي كاميرا عالية السرعة. تُستخدم أدوات مثل هذه لالتقاط الصور في ظروف الحركة. علاوة على ذلك، فإن العقود المتزايدة لشراء وتطوير أنظمة الرؤية الليلية والطلب المتزايد على أجهزة الأشعة السينية تدفع نمو سوق أنابيب تكثيف الصور.
نظرة عامة على سوق أنابيب تكثيف الصورة
أنابيب تكثيف الصورة (IITs) هي أنابيب مفرغة تعمل على تكثيف صورة ذات مستوى ضوء منخفض إلى مستويات يمكن ملاحظتها. أنابيب تكثيف الصورة هي واحدة من أهم وحدات أجهزة الرؤية الليلية التي تحدد دورًا حاسمًا في التطبيقات الصناعية/الدفاعية/الأمنية. إن تكنولوجيا تصنيع أنابيب تكثيف الصورة صعبة، وتختلف معلمات أداء أنابيب تكثيف الصورة الحديثة حتى داخل نفس العملية التكنولوجية. علاوة على ذلك، لا يمكن الوثوق تمامًا بتقارير الاختبار التي يقدمها المصنعون لأن هناك اختلافات في طرق الاختبار المستخدمة من قبل الشركات المصنعة المختلفة. علاوة على ذلك، تقدم مصادر الأدبيات ادعاءات متضاربة من مجموعة متنوعة من الشركات المصنعة. من الشائع أن تجد في السوق العالمية جهازين للرؤية الليلية بنفس قيود ورقة البيانات ولكن بجودة صورة مختلفة. نظرًا لبعض الأسباب المذكورة أعلاه، فإن اختبار أنابيب تكثيف الصورة له أهمية كبيرة لكل من مصنعي الأنابيب ومصنعي أجهزة الرؤية الليلية (NVDs) والمستخدمين النهائيين لأجهزة NVDs.
قم بتخصيص هذا التقرير ليناسب متطلباتك
ستحصل على تخصيص لأي تقرير - مجانًا - بما في ذلك أجزاء من هذا التقرير، أو تحليل على مستوى الدولة، وحزمة بيانات Excel، بالإضافة إلى الاستفادة من العروض والخصومات الرائعة للشركات الناشئة والجامعات
سوق أنابيب تكثيف الصور: رؤى استراتيجية
- احصل على أهم اتجاهات السوق الرئيسية لهذا التقرير.ستتضمن هذه العينة المجانية تحليلاً للبيانات، بدءًا من اتجاهات السوق وحتى التقديرات والتوقعات.
محركات وفرص سوق أنابيب تكثيف الصور
استثمار كبير في الجيش لصالح السوق
أصبحت الرؤية الليلية تقنية بصرية إلكترونية بالغة الأهمية في الحروب الحديثة، وهناك المزيد من المعارك التي تنشأ وتجري ليلاً. يتم دمج أنابيب تكثيف الصور من Photonis في معدات كبار موردي الأنظمة البصرية في العالم. تقدم العديد من الشركات أنابيب تكثيف الصور للاستخدام العسكري. على سبيل المثال، تعد Photonics واحدة من الشركات الرائدة في تصنيع وتصميم أنابيب تكثيف الصور الحديثة للاستخدام العسكري والدفاعي. تقدم Photonis أنابيب تكثيف الصور عالية الجودة لمجموعة واسعة من أجهزة الرؤية الليلية لمنح الجنود ميزة استراتيجية في العمليات الليلية.optoelectronic technology in modern warfare, and more combats are emerging and taking play at night. Photonis image intensifier tubes are integrated into equipment of the world’s leading suppliers of optical systems. Various companies offer image intensifier tubes for military use. For example, Photonics is one of the pioneers in the manufacturing and design of state-of-the-art image intensifier tubes for military and defense. Photonis offers high-quality image intensifier tubes for a broad range of night vision devices to give soldiers a strategic advantage in night operations.
علاوة على ذلك، تتخذ الشركات العديد من المبادرات. على سبيل المثال، تتخذ الشركات مبادرات مختلفة، مثل تسليم عدد كبير من أنابيب تكثيف الصور. على سبيل المثال، في فبراير 2024، تم اختيار Photonis، العلامة التجارية لشركة Exosens وواحدة من الشركات الرائدة عالميًا في أنابيب تكثيف الصور، للمرة الثانية، لتوريد 40000 أنبوب تكثيف صور 4G 16 مم لمنظار الرؤية الليلية Mikron من Theon Sensors لتوريدها للقوات المسلحة الألمانية والبلجيكية. وبالتالي، فإن الاستثمار الكبير في الجيش يقود سوق أنابيب تكثيف الصور.Photonis, the brand of Exosens and one of the world leaders in image intensifier tubes, was selected, for the second time, to supply 40,000 4G 16mm image intensifier tubes for Mikron night vision binoculars of Theon Sensors to be supplied to German and Belgian Armed Forces. Thus, a significant investment in the military is driving the image intensifier tube market.
نظام المراقبة العسكرية من الجيل القادم.
يقوم الجيش بتجنيد متطلب للرادار السلبي المتحرك من الجيل التالي، وهو نوع من نظام المراقبة المستمرة طويلة المدى للجيش المثبت على شاحنة تكتيكية يمكنها نشر مستشعر يبلغ ارتفاعه 60 قدمًا بسرعة للمساعدة في التمييز بين الصواريخ المجنحة والطائرات وأنظمة الطيران غير المأهولة الأصغر حجمًا. في 26 مارس، نشر مكتب الجيش المسؤول عن تطوير وشراء أجهزة استشعار المدفعية للدفاع الجوي والمدفعية الميدانية إشعارًا يطلب ملاحظات من الشركات المهتمة المحتملة بالتنافس على الرادار الجديد . علاوة على ذلك، تم تجهيز الجيوش الرائدة بأجهزة NVD من الجيل الثالث والرابع التي توفر جودة صورة فائقة ونطاقًا ممتدًا وتأثيرات هالة مخفضة. تستخدم أجهزة الجيل الثالث كاثودات ضوئية من زرنيخيد الغاليوم وتضخيم لوحة القنوات الدقيقة (MCP). وبالتالي، فإن نظام المراقبة العسكرية من الجيل التالي يحمل الكثير من الفرص في سوق أنبوب تكثيف الصورة.
تقرير تحليلي لتجزئة سوق أنابيب تكثيف الصور
إن القطاعات الرئيسية التي ساهمت في اشتقاق تحليل سوق أنبوب تكثيف الصورة هي الجيل والمستخدم النهائي.
- استنادًا إلى الأجيال، يتم تقسيم سوق أنبوب تكثيف الصورة إلى الجيل الأول والجيل الثاني والجيل الثالث. استحوذ الجيل الثاني على حصة سوقية كبيرة في عام 2023.
- بحسب المستخدم النهائي، يتم تقسيم السوق إلى قطاعات عسكرية وتكنولوجيات حيوية للرعاية الصحية وغيرها. وقد احتل القطاع العسكري حصة كبيرة من السوق في عام 2023.
تحليل حصة سوق أنابيب تكثيف الصور حسب المنطقة الجغرافية
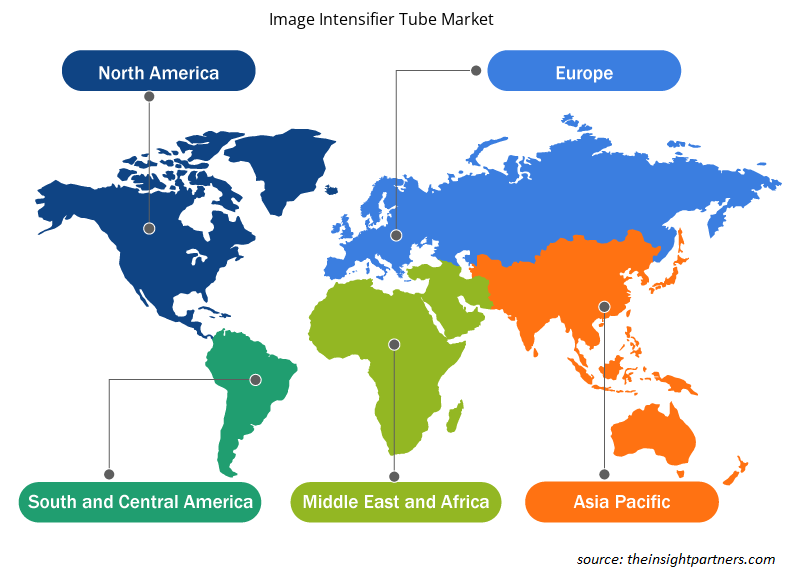
ينقسم النطاق الجغرافي لتقرير سوق أنبوب تكثيف الصورة بشكل أساسي إلى خمس مناطق: أمريكا الشمالية، ومنطقة آسيا والمحيط الهادئ، وأوروبا، والشرق الأوسط وأفريقيا، وأمريكا الجنوبية والوسطى.
سيطرت أمريكا الشمالية على سوق أنابيب تكثيف الصور. تعد أمريكا الشمالية واحدة من أكثر المناطق تقدمًا فيما يتعلق بتبني التقنيات المتقدمة. على مر السنين، شهدت أمريكا الشمالية ارتفاعًا في تبني المعدات العسكرية المتقدمة تقنيًا لتعزيز قدراتها العسكرية. زادت الهيئات الحكومية في جميع أنحاء البلدان مثل الولايات المتحدة وكندا والمكسيك من إنفاقها العسكري. علاوة على ذلك، شهدت دول أمريكا الشمالية ارتفاعًا في الاستثمار في قطاع الرعاية الصحية لتعزيز بنيتها التحتية الطبية. وبالتالي، فإن زيادة الاستثمارات في القطاعات التي يكون فيها أنبوب تكثيف الصور ضروريًا هو محرك نمو السوق.
رؤى إقليمية حول سوق أنابيب تكثيف الصور
لقد قام المحللون في Insight Partners بشرح الاتجاهات والعوامل الإقليمية المؤثرة على سوق أنابيب تكثيف الصور طوال فترة التوقعات بشكل شامل. يناقش هذا القسم أيضًا قطاعات سوق أنابيب تكثيف الصور والجغرافيا في جميع أنحاء أمريكا الشمالية وأوروبا ومنطقة آسيا والمحيط الهادئ والشرق الأوسط وأفريقيا وأمريكا الجنوبية والوسطى.
- احصل على البيانات الإقليمية المحددة لسوق أنبوب تكثيف الصور
نطاق تقرير سوق أنبوب تكثيف الصورة
| سمة التقرير | تفاصيل |
|---|---|
| حجم السوق في عام 2023 | 1.45 مليار دولار أمريكي |
| حجم السوق بحلول عام 2031 | 2.49 مليار دولار أمريكي |
| معدل النمو السنوي المركب العالمي (2023 - 2031) | 7% |
| البيانات التاريخية | 2021-2022 |
| فترة التنبؤ | 2024-2031 |
| القطاعات المغطاة | حسب الجيل
|
| المناطق والدول المغطاة | أمريكا الشمالية
|
| قادة السوق وملفات تعريف الشركات الرئيسية |
|
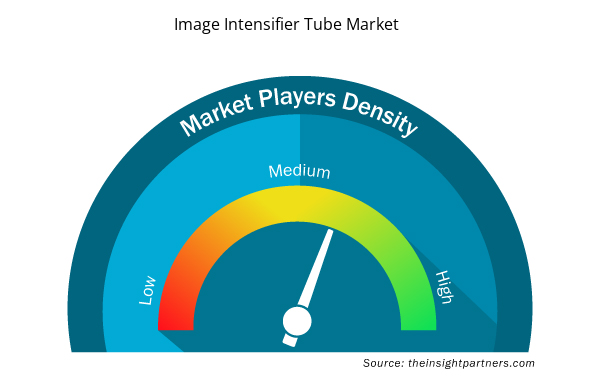
كثافة اللاعبين في السوق: فهم تأثيرها على ديناميكيات الأعمال
يشهد سوق أنابيب تكثيف الصور نموًا سريعًا، مدفوعًا بالطلب المتزايد من المستخدم النهائي بسبب عوامل مثل تفضيلات المستهلك المتطورة والتقدم التكنولوجي والوعي المتزايد بفوائد المنتج. ومع ارتفاع الطلب، تعمل الشركات على توسيع عروضها والابتكار لتلبية احتياجات المستهلكين والاستفادة من الاتجاهات الناشئة، مما يؤدي إلى زيادة نمو السوق.
تشير كثافة اللاعبين في السوق إلى توزيع الشركات أو المؤسسات العاملة في سوق أو صناعة معينة. وهي تشير إلى عدد المنافسين (اللاعبين في السوق) الموجودين في مساحة سوق معينة نسبة إلى حجمها أو قيمتها السوقية الإجمالية.
الشركات الرئيسية العاملة في سوق أنبوب تكثيف الصورة هي:
- شركة بيل أوبترونيك ديفايسز المحدودة (BELOP)
- أصعب رقميًا
- شركة كانون للأنابيب والأجهزة الإلكترونية المحدودة
- شركة L3Harris Technologies، المحدودة.
- نيوكون أوبتيك
- فوتوك
إخلاء المسؤولية : الشركات المذكورة أعلاه ليست مرتبة بأي ترتيب معين.
- احصل على نظرة عامة على أهم اللاعبين الرئيسيين في سوق أنابيب تكثيف الصور
أخبار سوق أنابيب تكثيف الصور والتطورات الأخيرة
يتم تقييم سوق أنابيب تكثيف الصور من خلال جمع البيانات النوعية والكمية بعد البحث الأولي والثانوي، والتي تتضمن منشورات الشركات المهمة وبيانات الجمعيات وقواعد البيانات. فيما يلي بعض التطورات في سوق أنابيب تكثيف الصور:
- أعلنت شركة Exosens عن توسيع مجموعة منتجات Photonis Ultimate Detection Scientific Imaging من خلال طرح حل 25 mm Image Intensifier. سيتم عرض أحدث التقنيات، المصممة لدعم مجموعة واسعة من التطبيقات العلمية مثل التصوير الطبي والتصوير عالي السرعة، والرؤية الآلية، والروبوتات، والأبحاث، في SPIE Photonics West.
(المصدر: Exosens، موقع الشركة، يناير 2024)
- تم اختيار Photonis، إحدى العلامات التجارية لشركة Exosens وأحد رواد العالم في أنابيب تكثيف الصور، للمرة الثانية لتوريد 40,000 أنبوب تكثيف صور 4G 16mm لمنظار الرؤية الليلية Mikron من شركة Theon Sensors ليتم توريدها للقوات المسلحة الألمانية والبلجيكية.
(المصدر: اسم شركة Photonis، فبراير 2024)
تقرير سوق أنبوب تكثيف الصورة والتغطية والنتائج
يوفر تقرير "حجم سوق أنبوب تكثيف الصورة والتوقعات (2021-2031)" تحليلاً مفصلاً للسوق يغطي المجالات التالية:
- حجم سوق أنبوب تكثيف الصورة وتوقعاته على المستويات العالمية والإقليمية والوطنية لجميع قطاعات السوق الرئيسية المشمولة بالنطاق.
- اتجاهات سوق أنبوب تكثيف الصورة بالإضافة إلى ديناميكيات السوق مثل المحركات والقيود والفرص الرئيسية.
- تحليل مفصل لقوى PEST/Porter الخمس و SWOT.
- تحليل سوق أنبوب تكثيف الصورة يغطي اتجاهات السوق الرئيسية والإطار العالمي والإقليمي واللاعبين الرئيسيين واللوائح والتطورات الأخيرة في السوق.
- تحليل المشهد الصناعي والمنافسة الذي يغطي تركيز السوق، وتحليل خريطة الحرارة، واللاعبين البارزين، والتطورات الأخيرة في سوق أنبوب تكثيف الصورة.
- ملفات تعريفية مفصلة للشركة.

نافين خبيرٌ متمرسٌ في أبحاث السوق والاستشارات، يتمتع بخبرةٍ تزيد عن 9 سنوات في مشاريع مُخصصة ومُشتركة واستشارية. يشغل حاليًا منصب نائب الرئيس المساعد، وقد نجح في إدارة أصحاب المصلحة عبر سلسلة قيمة المشاريع، وألّف أكثر من 100 تقرير بحثي وأكثر من 30 مهمة استشارية. يمتد نطاق عمله ليشمل مشاريع صناعية وحكومية، مساهمًا بشكل كبير في نجاح العملاء واتخاذ القرارات القائمة على البيانات.
نافين حاصلٌ على شهادة في هندسة الإلكترونيات والاتصالات من جامعة فرجينيا التقنية، كارناتاكا، وشهادة ماجستير في إدارة الأعمال في التسويق والعمليات من جامعة مانيبال. وهو عضوٌ نشطٌ في معهد مهندسي الكهرباء والإلكترونيات (IEEE) لمدة 9 سنوات، حيث شارك في مؤتمراتٍ وندواتٍ تقنية، وتطوّع على مستوى الأقسام والمناطق. قبل منصبه الحالي، عمل مستشارًا استراتيجيًا مساعدًا في IndustryARC، ومستشارًا للخوادم الصناعية في شركة هيوليت باكارد (HP Global).
- التحليل التاريخي (سنتان)، سنة الأساس، التوقعات (7 سنوات) مع معدل النمو السنوي المركب
- تحليل PEST و SWOT
- حجم السوق والقيمة / الحجم - عالمي، إقليمي، بلد
- الصناعة والمنافسة
- مجموعة بيانات إكسل
التقارير الحديثة
شهادات العملاء
تقرير سوق أنظمة SCADA من Insight Partners شامل، ويقدم رؤى قيّمة حول الاتجاهات الحالية والتوقعات المستقبلية. تميّز الفريق باحترافية عالية وسرعة في الاستجابة ودعم مستمر طوال الوقت. نحن راضون جدًا ونوصي بشدة بخدماتهم.
ران كيديم شريك, شركة ريالي تكنولوجيز المحدودةطلبتُ تقريرًا عن سوق برمجيات محدد، وأعدّه الفريق في غضون أيام قليلة. كانت المعلومات ذات صلة وثيقة وعرضها جيد. ثم طلبتُ بعض التعديلات والإضافات على التقرير. وكان الفريق متجاوبًا للغاية، وحصلتُ على التقرير النهائي في أقل من أسبوع.
جان هيرفيه جين رئيس مجلس الإدارة, فيوتشر أناليتيكاعملنا مع شركة "إنسايت بارتنرز" لإجراء دراسة سوقية وتوقعات مهمة. زودونا برؤى واضحة حول الفرص والمخاطر، مما ساعدنا في صياغة خططنا. كانت أبحاثهم سهلة الاستخدام ومبنية على بيانات دقيقة، مما ساعدنا على اتخاذ قرارات ذكية وواثقة. نوصي بهم بشدة.
بيوش ناجبال نائب الرئيس الأول, شعاع عالي عالميقدّمت شركة Insight Partners أبحاثًا سوقية ثاقبة ومنظمة جيدًا بخبرة واسعة في هذا المجال. تميّز فريقهم بالاحترافية وسرعة الاستجابة طوال الوقت. وسهّل موقعهم الإلكتروني سهل الاستخدام الوصول إلى تقارير القطاع. نوصي بهم بشدة لخدمات بحثية موثوقة وعالية الجودة.
يوكيهيكو أداتشي المدير التنفيذي, ديب بلو، ذ.م.م.هذه أول مرة أشتري فيها تقرير سوق من The Insight Partners. رغم أنني كنت مترددًا في البداية، إلا أنني زرت موقعهم الإلكتروني وشعرت براحة أكبر للمخاطرة وشراء تقرير السوق. أنا راضٍ تمامًا عن جودة التقرير وخدمة العملاء. كانت لديّ عدة أسئلة وتعليقات حول التقرير الأولي، ولكن بعد بضع محادثات عبر البريد الإلكتروني مع محللهم، أعتقد أن لديّ تقريرًا يمكنني استخدامه كمدخل لعملية التخطيط الاستراتيجي لدينا. شكرًا جزيلاً لكم على تخصيص وقتكم الإضافي وجعل هذه التجربة إيجابية. سأوصي بخدماتكم للآخرين بالتأكيد، وستكونون أول من ألجأ إليه عندما نحتاج إلى المزيد من بيانات السوق.
جون سوزوكي الرئيس والرئيس التنفيذي وعضو مجلس الإدارة, بي كيه تكنولوجيزأود أن أقدّر دعمكم واحترافيتكم في الاستجابة لطلبي للحصول على معلومات بشأن سوق التشخيص المخبري للأمراض المعدية في نيجيريا. كما أُقدّر صبركم وتوجيهكم، واستعدادكم لتقديم خصم، مما مكّننا في النهاية من إتمام الصفقة. أتطلع إلى التعامل مع "ذا إنسايت بارتنرز" مستقبلًا، كل ذلك بفضل الانطباع الذي تركتموه لديّ نتيجةً لهذا اللقاء الأول.
الدكتور تشيجيوك أونيا المدير الإداري, شركة باينكريست للرعاية الصحية المحدودةسبب الشراء
- اتخاذ قرارات مدروسة
- فهم ديناميكيات السوق
- تحليل المنافسة
- رؤى العملاء
- توقعات السوق
- تخفيف المخاطر
- التخطيط الاستراتيجي
- مبررات الاستثمار
- تحديد الأسواق الناشئة
- تحسين استراتيجيات التسويق
- تعزيز الكفاءة التشغيلية
- مواكبة التوجهات التنظيمية


 احصل على عينة مجانية ل - سوق أنابيب تكثيف الصور