نمو سوق الخراطيم الصناعية، حجمه، حصته السوقية، اتجاهاته، تحليلات اللاعبين الرئيسيين، والتوقعات حتى عام 2031
البيانات التاريخية : 2021-2023 | سنة الأساس : 2024 | فترة التنبؤ : 2025-2031حجم سوق الخراطيم الصناعية وتوقعاته (2025-2031)، والحصة العالمية والإقليمية، والاتجاهات، وفرص النمو. يغطي التقرير: حسب نوع المادة (المطاط، والبولي فينيل كلوريد، والبولي يوريثين، والسيليكون، وغيرها)، والقطاعات الصناعية (السيارات، والمياه والصرف الصحي، والنفط والغاز، والمواد الكيميائية، والبنية التحتية، والأغذية والمشروبات، والزراعة، والتعدين، وغيرها)، والجغرافيا.
- تاريخ التقرير : Jun 2025
- رمز التقرير : TIPRE00007078
- الفئة : التصنيع والبناء
- الحالة : نُشرت
- تنسيقات التقارير المتاحة :


- عدد الصفحات : 206
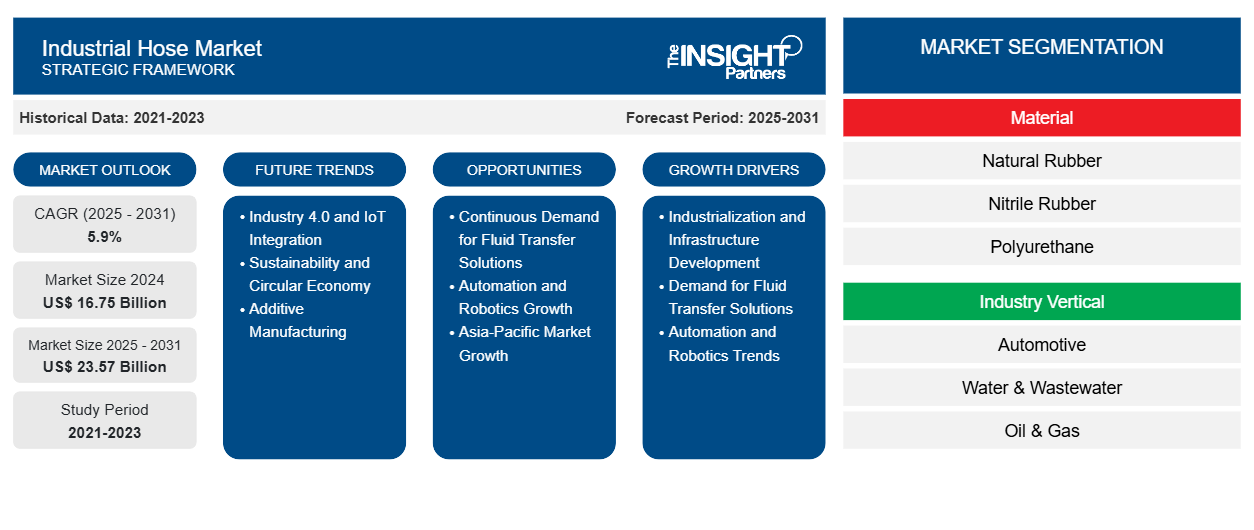
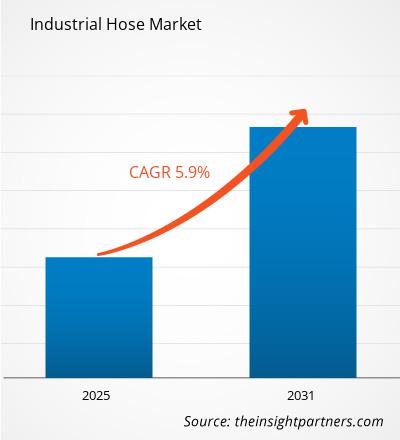
من المتوقع أن يصل حجم سوق الخراطيم الصناعية إلى 27,399.42 مليون دولار أمريكي بحلول عام 2031، مقارنةً بـ 14,659.29 مليون دولار أمريكي في عام 2024. ومن المتوقع أن يسجل السوق معدل نمو سنوي مركب قدره 9.6% خلال الفترة 2025-2031. ومن المرجح أن يُسهم تطوير مواد مبتكرة في تصنيع الخراطيم في ظهور اتجاهات جديدة في السوق خلال السنوات القادمة.
تحليل سوق الخراطيم الصناعية
أبرزت دراسة اجتماعية واقتصادية حديثة أجرتها مؤسسة "ووتر يوروب" (Water Europe) الحاجة إلى استثمارات في قطاع المياه بقيمة 290.48 مليار دولار أمريكي على مدى السنوات الست المقبلة لحماية اقتصاد أوروبا وتعزيز الاستدامة البيئية. وتؤكد هذه الدراسة على أهمية الإدارة الفعّالة للمياه في مواجهة خطر ندرة المياه، الذي يؤثر حاليًا على 38% من سكان الاتحاد الأوروبي. وتُعد قطاعات أشباه الموصلات، ومراكز البيانات، والهيدروجين المتجدد، وإنتاج بطاريات السيارات الكهربائية، معرضة للخطر بشكل خاص، لاعتمادها بشكل كبير على إمدادات مياه موثوقة. ومن المتوقع أن تنمو هذه الصناعات الأربع، التي تُقدر قيمتها بنحو 218.71 مليار دولار أمريكي، إلى ما يقرب من 1.13 تريليون دولار أمريكي بحلول عام 2030. ومع ذلك، سيؤدي هذا النمو إلى زيادة الطلب على المياه بمقدار 2.6 ضعف، مما يؤكد ضرورة اتباع ممارسات مستدامة لإدارة المياه. ومع توسع الصناعات وزيادة احتياجاتها من المياه، سيزداد الطلب على حلول نقل السوائل الفعالة، مما يؤثر بشكل مباشر على سوق الخراطيم الصناعية.
نظرة عامة على سوق الخراطيم الصناعية
الخراطيم هي أنابيب مرنة تُستخدم لنقل الغازات والسوائل والمواد الصلبة من نقطة إلى أخرى. في المنشآت الصناعية، تُستخدم لنقل المواد الكيميائية السائلة، وغازات النفايات، والماء، والمشروبات، ومواد الإنتاج، والحطام، والغبار. صُممت الخراطيم الصناعية لنقل الهواء، والماء، والمنتجات الغذائية، والمشروبات، وجزيئات الأسمنت، والمواد الجافة، والمواد الكيميائية، والوقود، والمنتجات النفطية، والغازات، وغيرها. يُسهم التصنيع السريع، بالاستثمارات في صناعات معالجة المياه ومياه الصرف الصحي ، في نمو سوق الخراطيم الصناعية.
ستحصل على تخصيص لأي تقرير - مجانًا - بما في ذلك أجزاء من هذا التقرير، أو تحليل على مستوى الدولة، وحزمة بيانات Excel، بالإضافة إلى الاستفادة من العروض والخصومات الرائعة للشركات الناشئة والجامعات
سوق الخراطيم الصناعية: رؤى استراتيجية
- احصل على أهم اتجاهات السوق الرئيسية لهذا التقرير.ستتضمن هذه العينة المجانية تحليل البيانات، بدءًا من اتجاهات السوق وحتى التقديرات والتوقعات.
محركات وفرص سوق الخراطيم الصناعية
ارتفاع الطلب في صناعة الأغذية والمشروبات
تزدهر صناعة الأغذية والمشروبات في جميع أنحاء البلدان بسبب التصنيع السريع والاستثمارات من قبل الشركات الأجنبية الكبرى. وفقًا لدائرة الإحصاء في سنغافورة، رابطة السفر الغذائي العالمية، ارتفعت مبيعات خدمات الأغذية والمشروبات بنسبة 3.9٪ في نوفمبر 2024 على أساس سنوي، مما أدى إلى تمديد النمو بنسبة 3.9٪ في أكتوبر 2024. وعلى أساس معدل موسميًا، انخفضت مبيعات خدمات الأغذية والمشروبات بنسبة 2.0٪ في نوفمبر 2024 مقارنة بالشهر السابق. يجذب هذا الاتجاه للنمو في صناعة الأغذية والمشروبات استثمارات جديدة. وفقًا لوزارة الصناعة (Kemenperin)، زادت الاستثمارات في قطاع الأغذية والمشروبات (mamin) بنسبة 28٪ على أساس سنوي لتصل إلى 1.86 مليار دولار أمريكي في الربع الثالث من عام 2024. يتكون هذا الاستثمار من 1.03 مليار دولار أمريكي من الاستثمار المحلي المباشر (DDI) و 829.45 مليون دولار أمريكي من الاستثمار الأجنبي المباشر (FDI). شملت هذه الاستثمارات الجديدة تصنيع التوابل، والأطعمة الجاهزة، والبروتينات النباتية، واللحوم والفواكه المجمدة ، والسلمون المُصنّع، والمشروبات الصحية. وقد قامت بهذه الاستثمارات شركات في تايلاند، منها: أوستريانوفا، وإيكولاب، وإمسلاند آسيا للابتكار الغذائي، وسنتوري للأغذية والمشروبات، وتي يو في سود، ومختبر أوينو للعلوم والتكنولوجيا، وزويتيس، وبيو توك تكنولوجي.
ارتفاع الاستثمارات الحكومية في البنية التحتية الفعالة للصرف الصحي والصرف الصحي
يتزايد استخدام منظفات الصرف الصحي وآلات إدارة الصرف الصحي وغيرها من المعدات المطلوبة مع تزايد التحضر. تدفع الحكومات حدود استثماراتها لدعم الإدارات البلدية بنظام صرف صحي أفضل، مما يسمح لها بالحفاظ على نظافة ولاياتها. في يوليو 2023، أعلن مجلس مدينة غيتسفيل في الولايات المتحدة (تكساس) عن موافقته على شراء آلة صرف صحي مثبتة على مقطورة بقيمة 87642.64 دولارًا أمريكيًا. تدفع مثل هذه المشتريات والمبادرات إلى اعتماد خدمات تنظيف المجاري والصرف الصحي واستخدام الخراطيم الصناعية. تستثمر الحكومات في تطوير بنية تحتية جديدة للصرف الصحي والصرف الصحي وتحديث البنية التحتية القديمة. في عام 2023، أعلنت وزارة البيئة والمحافظة في ولاية تينيسي عن حوالي 131 منحة لتحسين البنية التحتية لإدارة المياه. مُنحت إحدى المنح لمدينة نولينسفيل لتطوير القنوات المفتوحة وأنظمة الصرف المغلقة وقنوات التصريف المتقاطعة والجسور. في يناير 2023، أعلنت وكالة حماية البيئة عن قرض بقيمة 500 مليون دولار أمريكي لتحسين البنية التحتية لمياه الصرف الصحي ومياه الشرب في نيوجيرسي. وفي يناير 2024، أعلنت وزارة البيئة والبحيرات العظمى والطاقة في ميشيغان (EGLE) عن منح بقيمة 67.1 مليون دولار أمريكي لخطة المياه النظيفة في ميشيغان لمساعدة مجتمعات ميشيغان على تحسين البنية التحتية للمياه. والهدف الرئيسي للمشروع هو الحد من فيضانات مياه الصرف الصحي في بحيرة سانت كلير والحفاظ على خطوط خدمة مياه الشرب في المجتمعات. وفي يونيو 2024، أعلنت شركة المياه أنجليان ووتر عن استثمار مبلغ إضافي قدره 113.91 مليون دولار أمريكي من المساهمين في التكنولوجيا الذكية. وأعلنت الشركة عن أكثر من 100 وظيفة جديدة لإنشاء "فريق عمل للانسكابات" وتحسينات على شبكة الصرف الصحي للشركة. وتواجه أنظمة المياه الحالية تحديات تفرضها خطوط الأنابيب القديمة ومحطات المعالجة وشبكات التوزيع، مما يزيد الطلب على خدمات تنظيف المجاري والصرف الصحي واستخدام الخراطيم الصناعية.
تحليل تجزئة تقرير سوق الخراطيم الصناعية
القطاعات الرئيسية التي ساهمت في اشتقاق تحليل سوق الخراطيم الصناعية هي نوع المادة والقطاع الرأسي للصناعة.
- من حيث نوع المادة، يُصنّف السوق إلى المطاط، والبولي فينيل كلوريد (PVC)، والبولي يوريثين، والسيليكون، وغيرها. وسيُهيمن قطاع المطاط على السوق بحلول عام ٢٠٢٤.
- حسب القطاعات، يُصنَّف السوق إلى قطاعات السيارات، والمياه والصرف الصحي، والنفط والغاز، والكيماويات، والبنية التحتية، والأغذية والمشروبات، والزراعة، والتعدين، وغيرها. وقد هيمن قطاع النفط والغاز على السوق في عام ٢٠٢٤.
تحليل حصة سوق الخراطيم الصناعية حسب المنطقة الجغرافية
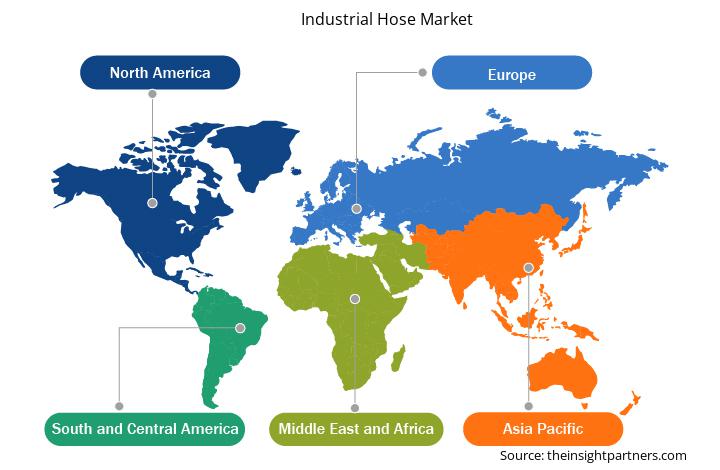
يُقسّم سوق الخراطيم الصناعية إلى خمس مناطق رئيسية: أمريكا الشمالية، وأوروبا، وآسيا والمحيط الهادئ، والشرق الأوسط وأفريقيا، وأمريكا الجنوبية والوسطى. وقد هيمنت منطقة آسيا والمحيط الهادئ على السوق في عام 2024، تلتها أمريكا الشمالية وأوروبا.
تشهد الصين طلبًا كبيرًا على الخراطيم الصناعية نظرًا لتوسع صناعة السيارات فيها. ويستثمر مصنعو السيارات في البلاد مواردهم في توسيع مصانعهم. في يوليو 2024، افتتحت شركة BYD المحدودة الصينية مصنعًا لتصنيع السيارات الكهربائية في تايلاند لتعزيز حضورها الإقليمي. ويساهم هذا المصنع في خلق طلب متزايد على أنواع مختلفة من الخراطيم الصناعية.
رؤى إقليمية حول سوق الخراطيم الصناعية
قام محللو إنسايت بارتنرز بشرح شامل للاتجاهات الإقليمية والعوامل المؤثرة في سوق الخراطيم الصناعية خلال فترة التوقعات. ويناقش هذا القسم أيضًا قطاعات سوق الخراطيم الصناعية ونطاقها الجغرافي في أمريكا الشمالية، وأوروبا، وآسيا والمحيط الهادئ، والشرق الأوسط وأفريقيا، وأمريكا الجنوبية والوسطى.
- احصل على البيانات الإقليمية المحددة لسوق الخراطيم الصناعية
نطاق تقرير سوق الخراطيم الصناعية
| سمة التقرير | تفاصيل |
|---|---|
| حجم السوق في عام 2024 | 14,659.29 مليون دولار أمريكي |
| حجم السوق بحلول عام 2031 | 27,399.42 مليون دولار أمريكي |
| معدل النمو السنوي المركب العالمي (2025 - 2031) | 9.6% |
| البيانات التاريخية | 2021-2023 |
| فترة التنبؤ | 2025-2031 |
| القطاعات المغطاة | حسب نوع المادة
|
| المناطق والدول المغطاة | أمريكا الشمالية
|
| قادة السوق وملفات تعريف الشركات الرئيسية |
|
كثافة اللاعبين في سوق الخراطيم الصناعية: فهم تأثيرها على ديناميكيات الأعمال
يشهد سوق الخراطيم الصناعية نموًا سريعًا، مدفوعًا بتزايد طلب المستخدمين النهائيين نتيجةً لعوامل مثل تطور تفضيلات المستهلكين، والتقدم التكنولوجي، وزيادة الوعي بمزايا المنتج. ومع تزايد الطلب، تعمل الشركات على توسيع عروضها، والابتكار لتلبية احتياجات المستهلكين، والاستفادة من الاتجاهات الناشئة، مما يعزز نمو السوق.
تشير كثافة اللاعبين في السوق إلى توزيع الشركات العاملة في سوق أو قطاع معين. وتشير إلى عدد المنافسين (اللاعبين في السوق) الموجودين في سوق معين نسبةً إلى حجمه أو قيمته السوقية الإجمالية.
الشركات الرئيسية العاملة في سوق الخراطيم الصناعية هي:
- شركة إيتون
- شركة نوفافليكس
- شركة باركر هانيفين
- شركة كورياما الأمريكية
- شركة جيتس
- نوريس
إخلاء المسؤولية : الشركات المذكورة أعلاه ليست مرتبة بأي ترتيب معين.
- احصل على نظرة عامة على أهم اللاعبين الرئيسيين في سوق الخراطيم الصناعية
أخبار سوق الخراطيم الصناعية والتطورات الأخيرة
يُقيّم سوق الخراطيم الصناعية بجمع بيانات نوعية وكمية بعد البحث الأولي والثانوي، والتي تشمل منشورات الشركات المهمة، وبيانات الجمعيات، وقواعد البيانات. فيما يلي بعض التطورات الرئيسية في السوق:
- أعلنت شركة غيتس، الشركة العالمية المصنّعة لحلول نقل الطاقة الهندسية وحلول طاقة السوائل، عن إطلاق خرطوم التبريد داتا ماستر ميجا فليكس. يُوسّع هذا الخرطوم ذو القطر الكبير محفظة منتجات مراكز البيانات التي تقدمها الشركة، لينضم إلى خرطوم داتا ماستر™ ذي القطر الصغير، الذي أُطلق عام ٢٠٢٤. يُتيح داتا ماستر ميجا فليكس فرصًا جديدة في مراكز البيانات، ويُمكّن غيتس من خدمة العملاء في عالم اليوم الذي تُولي فيه التكنولوجيا الرقمية الأولوية. (المصدر: غيتس، بيان صحفي، مارس ٢٠٢٥)
- أعلنت شركة كورياما الأمريكية، المُصنِّعة والمورِّدة لمنتجات الخراطيم الصناعية، عن نقل وتوسيع مركز توزيعها على الساحل الشرقي. (المصدر: بيان صحفي لشركة كورياما الأمريكية، يناير 2025)
- أعلنت شركة جيتس، الشركة العالمية المصنّعة لحلول نقل الطاقة وطاقة السوائل، عن إطلاق خرطوم تبريد مركز البيانات الرئيسي "داتا ماستر". يُعدّ حل نقل السوائل هذا، الناتج عن عملية جيتس للابتكار البيئي، توسعًا في تطبيقات التبريد السائل لمراكز البيانات، وهي قطاع متنامي في مجال تبريد مراكز البيانات، مدفوعًا بتطبيقات كثيفة الحوسبة مثل الذكاء الاصطناعي. (المصدر: جيتس، بيان صحفي، سبتمبر 2024)
تغطية تقرير سوق الخراطيم الصناعية والنتائج المتوقعة
يوفر "حجم سوق الخراطيم الصناعية والتوقعات (2025-2031)" تحليلاً مفصلاً للسوق يغطي المجالات المذكورة أدناه:
- حجم سوق الخراطيم الصناعية وتوقعاته على المستويات العالمية والإقليمية والوطنية لجميع قطاعات السوق الرئيسية التي يغطيها النطاق
- اتجاهات سوق الخراطيم الصناعية، بالإضافة إلى ديناميكيات السوق مثل المحركات والقيود والفرص الرئيسية
- تحليل مفصل لـ PEST و SWOT
- تحليل سوق الخراطيم الصناعية يغطي اتجاهات السوق الرئيسية والإطار العالمي والإقليمي والجهات الفاعلة الرئيسية واللوائح والتطورات الأخيرة في السوق
- تحليل المشهد الصناعي والمنافسة الذي يغطي تركيز السوق، وتحليل خريطة الحرارة، واللاعبين البارزين، والتطورات الأخيرة لسوق الخراطيم الصناعية
- ملفات تعريف الشركة التفصيلية

نيفيديتا خبيرة أبحاث مُتميزة، تتمتع بخبرة تزيد عن 9 سنوات في أبحاث السوق واستشارات الأعمال. تشغل حاليًا منصب مديرة مشاريع في مجال تكنولوجيا المعلومات والاتصالات لدى شركة "ذا إنسايت بارتنرز"، وتتمتع بخبرة واسعة في إدارة وتنفيذ مهام الأبحاث المُجمعة والمُخصصة والقائمة على الاشتراكات والاستشارات في مختلف قطاعات التكنولوجيا.
بفضل سجلها الحافل في تقديم تحليلات قائمة على البيانات ورؤى عملية، ساهمت نيفيديتا بشكل رئيسي في العديد من المشاريع الحيوية. يشمل عملها تنفيذ المشاريع من البداية إلى النهاية، بدءًا من فهم أهداف العملاء، وتحليل اتجاهات السوق، وصولًا إلى استخلاص التوصيات الاستراتيجية. وقد تعاونت على نطاق واسع مع شركات رائدة في مجال تكنولوجيا المعلومات والاتصالات، مما ساعدها على تحديد فرص السوق ومواكبة تحولات القطاع.
تحمل نيفيديتا ماجستير إدارة أعمال في الإدارة من شركة "آي إم إس" في دهرادون. قبل انضمامها إلى "ذا إنسايت بارتنرز"، اكتسبت خبرة قيّمة في شركتي "ماركتس آند ماركتس" و"فيوتشر ماركت إنسايتس" في بونا، حيث شغلت مناصب بحثية مُختلفة وبنت أساسًا قويًا في تحليل القطاع والتفاعل مع العملاء.
- التحليل التاريخي (سنتان)، سنة الأساس، التوقعات (7 سنوات) مع معدل النمو السنوي المركب
- تحليل PEST و SWOT
- حجم السوق والقيمة / الحجم - عالمي، إقليمي، بلد
- الصناعة والمنافسة
- مجموعة بيانات إكسل
التقارير الحديثة
شهادات العملاء
تقرير سوق أنظمة SCADA من Insight Partners شامل، ويقدم رؤى قيّمة حول الاتجاهات الحالية والتوقعات المستقبلية. تميّز الفريق باحترافية عالية وسرعة في الاستجابة ودعم مستمر طوال الوقت. نحن راضون جدًا ونوصي بشدة بخدماتهم.
ران كيديم شريك, شركة ريالي تكنولوجيز المحدودةطلبتُ تقريرًا عن سوق برمجيات محدد، وأعدّه الفريق في غضون أيام قليلة. كانت المعلومات ذات صلة وثيقة وعرضها جيد. ثم طلبتُ بعض التعديلات والإضافات على التقرير. وكان الفريق متجاوبًا للغاية، وحصلتُ على التقرير النهائي في أقل من أسبوع.
جان هيرفيه جين رئيس مجلس الإدارة, فيوتشر أناليتيكاعملنا مع شركة "إنسايت بارتنرز" لإجراء دراسة سوقية وتوقعات مهمة. زودونا برؤى واضحة حول الفرص والمخاطر، مما ساعدنا في صياغة خططنا. كانت أبحاثهم سهلة الاستخدام ومبنية على بيانات دقيقة، مما ساعدنا على اتخاذ قرارات ذكية وواثقة. نوصي بهم بشدة.
بيوش ناجبال نائب الرئيس الأول, شعاع عالي عالميقدّمت شركة Insight Partners أبحاثًا سوقية ثاقبة ومنظمة جيدًا بخبرة واسعة في هذا المجال. تميّز فريقهم بالاحترافية وسرعة الاستجابة طوال الوقت. وسهّل موقعهم الإلكتروني سهل الاستخدام الوصول إلى تقارير القطاع. نوصي بهم بشدة لخدمات بحثية موثوقة وعالية الجودة.
يوكيهيكو أداتشي المدير التنفيذي, ديب بلو، ذ.م.م.هذه أول مرة أشتري فيها تقرير سوق من The Insight Partners. رغم أنني كنت مترددًا في البداية، إلا أنني زرت موقعهم الإلكتروني وشعرت براحة أكبر للمخاطرة وشراء تقرير السوق. أنا راضٍ تمامًا عن جودة التقرير وخدمة العملاء. كانت لديّ عدة أسئلة وتعليقات حول التقرير الأولي، ولكن بعد بضع محادثات عبر البريد الإلكتروني مع محللهم، أعتقد أن لديّ تقريرًا يمكنني استخدامه كمدخل لعملية التخطيط الاستراتيجي لدينا. شكرًا جزيلاً لكم على تخصيص وقتكم الإضافي وجعل هذه التجربة إيجابية. سأوصي بخدماتكم للآخرين بالتأكيد، وستكونون أول من ألجأ إليه عندما نحتاج إلى المزيد من بيانات السوق.
جون سوزوكي الرئيس والرئيس التنفيذي وعضو مجلس الإدارة, بي كيه تكنولوجيزأود أن أقدّر دعمكم واحترافيتكم في الاستجابة لطلبي للحصول على معلومات بشأن سوق التشخيص المخبري للأمراض المعدية في نيجيريا. كما أُقدّر صبركم وتوجيهكم، واستعدادكم لتقديم خصم، مما مكّننا في النهاية من إتمام الصفقة. أتطلع إلى التعامل مع "ذا إنسايت بارتنرز" مستقبلًا، كل ذلك بفضل الانطباع الذي تركتموه لديّ نتيجةً لهذا اللقاء الأول.
الدكتور تشيجيوك أونيا المدير الإداري, شركة باينكريست للرعاية الصحية المحدودةسبب الشراء
- اتخاذ قرارات مدروسة
- فهم ديناميكيات السوق
- تحليل المنافسة
- رؤى العملاء
- توقعات السوق
- تخفيف المخاطر
- التخطيط الاستراتيجي
- مبررات الاستثمار
- تحديد الأسواق الناشئة
- تحسين استراتيجيات التسويق
- تعزيز الكفاءة التشغيلية
- مواكبة التوجهات التنظيمية


 احصل على عينة مجانية ل - سوق الخراطيم الصناعية