نظرة عامة على سوق مطيافية الأشعة تحت الحمراء والنمو والاتجاهات والتحليل والتقرير البحثي (2023-2031)
البيانات التاريخية : 2021-2022 | سنة الأساس : 2023 | فترة التنبؤ : 2024-2031حجم سوق مطيافية الأشعة تحت الحمراء وتوقعاته (2021 - 2031)، والحصة العالمية والإقليمية، والاتجاه، وفرص النمو، وتغطية تقرير تحليل: حسب التكنولوجيا (الأشعة تحت الحمراء القريبة، والأشعة تحت الحمراء المتوسطة، والأشعة تحت الحمراء البعيدة)، ونوع المنتج (أجهزة مطيافية سطح المكتب، وأجهزة مطيافية دقيقة، وأجهزة مطيافية محمولة، وأجهزة مطيافية متصلة)، والمستخدم النهائي (الرعاية الصحية، والمواد الكيميائية، والنفط والغاز، والأغذية والمشروبات، والمستخدمين النهائيين الآخرين) والجغرافيا.
- تاريخ التقرير : Mar 2026
- رمز التقرير : TIPRE00017506
- الفئة : الإلكترونيات وأشباه الموصلات
- الحالة : البيانات الصادرة
- تنسيقات التقارير المتاحة :


- عدد الصفحات : 150
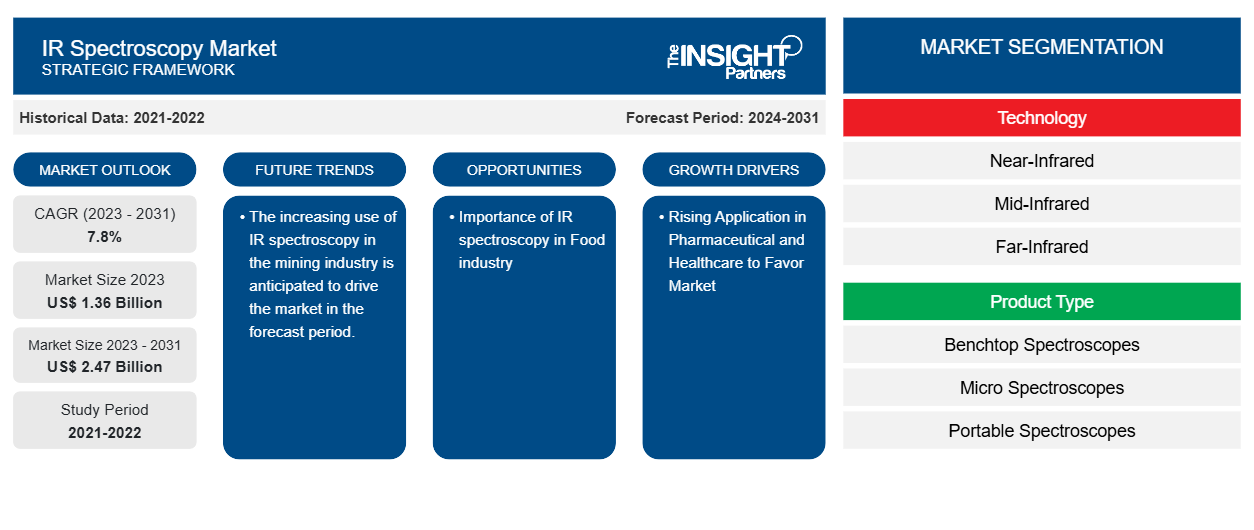
من المتوقع أن يصل حجم سوق التحليل الطيفي بالأشعة تحت الحمراء إلى 2.47 مليار دولار أمريكي بحلول عام 2031 من 1.36 مليار دولار أمريكي في عام 2023. ومن المتوقع أن يسجل السوق معدل نمو سنوي مركب بنسبة 7.8٪ خلال الفترة 2023-2031. ومن المرجح أن تظل التطبيقات المتزايدة في صناعات الأدوية والرعاية الصحية والنمو الناشئ في صناعة الأغذية من الاتجاهات والدوافع الرئيسية في السوق.
تحليل سوق مطيافية الأشعة تحت الحمراء
من المتوقع أن ينمو الطلب على سوق التحليل الطيفي بالأشعة تحت الحمراء مع زيادة عدد المرافق الطبية ومراكز الأبحاث السريرية في جميع أنحاء العالم. كما أن التطبيق المتزايد في صناعة الأدوية والرعاية الصحية والتركيز المتزايد على التحليل الطيفي بالأشعة تحت الحمراء في الاقتصادات الناشئة. علاوة على ذلك، من المتوقع أن ينمو السوق مع نمو صناعة الأغذية.
نظرة عامة على سوق مطيافية الأشعة تحت الحمراء
يُعد التحليل الطيفي بالأشعة تحت الحمراء (IR spectroscopy) أحد أنواع التحليل الطيفي التي تتعامل مع منطقة الأشعة تحت الحمراء من الطيف الكهرومغناطيسي، أي الضوء ذو الطول الموجي الأطول والتردد الأقل من الضوء المرئي. ويغطي مجموعة من التقنيات، والتي تعتمد في الغالب على التحليل الطيفي بالامتصاص. وكما هو الحال مع جميع التقنيات الطيفية، يمكن استخدامه لتحديد ودراسة المواد الكيميائية.
قم بتخصيص هذا التقرير ليناسب متطلباتك
ستحصل على تخصيص لأي تقرير - مجانًا - بما في ذلك أجزاء من هذا التقرير، أو تحليل على مستوى الدولة، وحزمة بيانات Excel، بالإضافة إلى الاستفادة من العروض والخصومات الرائعة للشركات الناشئة والجامعات
سوق التحليل الطيفي بالأشعة تحت الحمراء: رؤى استراتيجية
-
احصل على أهم اتجاهات السوق الرئيسية لهذا التقرير.ستتضمن هذه العينة المجانية تحليلاً للبيانات، بدءًا من اتجاهات السوق وحتى التقديرات والتوقعات.
محركات وفرص سوق التحليل الطيفي بالأشعة تحت الحمراء
ارتفاع الطلب في مجال الأدوية والرعاية الصحية لصالح السوق
يعاني كبار السن في العالم حاليًا من إعاقات نفسية وعصبية مختلفة . علاوة على ذلك، فإن وظائف المخ لدى هؤلاء المرضى معوقة بشدة، مما يحد من استقلاليتهم في الحياة اليومية. في هذه الحالات، يعد التحليل الطيفي بالأشعة تحت الحمراء ضروريًا للغاية. علاوة على ذلك، يتم استخدام التحليل الطيفي بالأشعة تحت الحمراء القريبة في تخليق وتنقية المواد الصيدلانية النشطة والتخمير الصيدلاني الحيوي. تعد هذه التكنولوجيا مثالية لأنها مصممة لتحليل الخلطات المعقدة.
أهمية التحليل الطيفي للأشعة تحت الحمراء في صناعة الأغذية.
على مدى السنوات الأخيرة، تطورت طريقة التحليل الطيفي بالأشعة تحت الحمراء لتحليل الأغذية بشكل كبير. يمكن استخدام التحليل الطيفي بالأشعة تحت الحمراء لإجراء تحليل الجودة على العديد من عائلات مجموعات الأغذية مثل اللحوم والفواكه والأسماك والخضروات ومنتجات الألبان والبيض والحبوب. مع تطور تقنية التحليل الطيفي بالأشعة تحت الحمراء وتطورها في تطبيقها في تحليل الأغذية، أصبحت في النهاية أداة موثوقة وقوية. تتمتع الطريقة بفوائد مختلفة تجعلها الأداة التحليلية المناسبة للعديد من مجموعات الأغذية وشركات الأغذية.
تقرير تحليل تجزئة سوق التحليل الطيفي بالأشعة تحت الحمراء
إن القطاعات الرئيسية التي ساهمت في اشتقاق تحليل سوق مطيافية الأشعة تحت الحمراء هي التكنولوجيا ونوع المنتج والمستخدم النهائي.
- استنادًا إلى التكنولوجيا، ينقسم سوق التحليل الطيفي بالأشعة تحت الحمراء إلى الأشعة تحت الحمراء القريبة والأشعة تحت الحمراء المتوسطة والأشعة تحت الحمراء البعيدة. ومن المتوقع أن يستحوذ قطاع الأشعة تحت الحمراء القريبة على حصة سوقية كبيرة في فترة التوقعات.
- بناءً على نوع المنتج، يتم تقسيم سوق مطياف الأشعة تحت الحمراء إلى مطياف سطح المكتب ، ومطياف مجهري، ومطياف محمول، ومطياف مركب. ومن المتوقع أن يستحوذ قطاع مطياف سطح المكتب على حصة سوقية كبيرة في فترة التوقعات.
- من حيث المستخدم النهائي، يتم تقسيم السوق إلى الرعاية الصحية والمواد الكيميائية والنفط والغاز والأغذية والمشروبات والمستخدمين النهائيين الآخرين. ومن المتوقع أن يحظى قطاع الرعاية الصحية بحصة سوقية كبيرة في الفترة المتوقعة.
تحليل حصة سوق مطيافية الأشعة تحت الحمراء حسب المنطقة الجغرافية
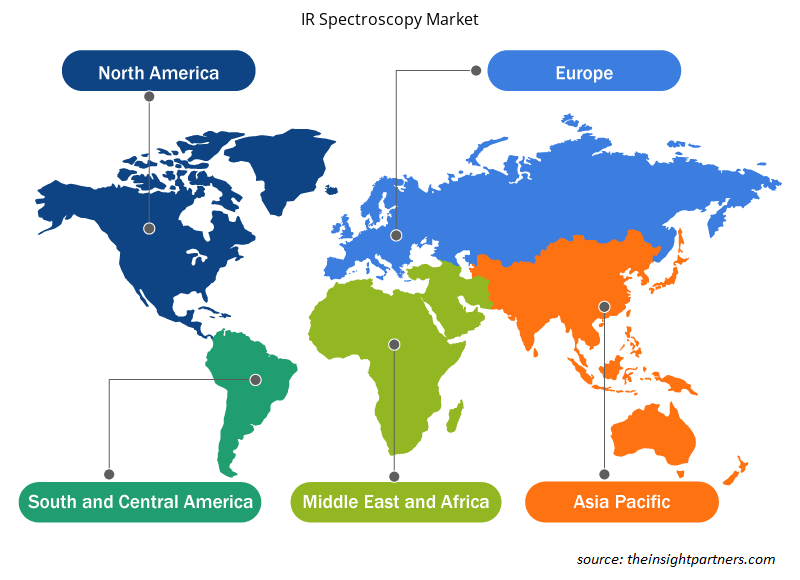
ينقسم النطاق الجغرافي لتقرير سوق التحليل الطيفي للأشعة تحت الحمراء بشكل أساسي إلى خمس مناطق: أمريكا الشمالية، ومنطقة آسيا والمحيط الهادئ، وأوروبا، والشرق الأوسط وأفريقيا، وأمريكا الجنوبية والوسطى.
سيطرت أمريكا الشمالية على السوق. ينمو سوق التحليل الطيفي بالأشعة تحت الحمراء في أمريكا الشمالية بسبب النمو القوي في الطلب على التحليل الطيفي بالأشعة تحت الحمراء في مختلف الصناعات مثل الرعاية الصحية والأدوية والمواد الكيميائية والأغذية والمشروبات. علاوة على ذلك، فإن التركيز القوي على البحث والتطوير يجعل المنطقة متقدمة من الناحية التكنولوجية. بالإضافة إلى ذلك، تضم أمريكا الشمالية عددًا كبيرًا من مصنعي التحليل الطيفي بالأشعة تحت الحمراء. وبالتالي، نظرًا للمعايير المذكورة أعلاه، ينمو سوق التحليل الطيفي بالأشعة تحت الحمراء في أمريكا الشمالية.
رؤى إقليمية حول سوق التحليل الطيفي بالأشعة تحت الحمراء
لقد قام المحللون في Insight Partners بشرح الاتجاهات والعوامل الإقليمية المؤثرة على سوق مطيافية الأشعة تحت الحمراء طوال فترة التوقعات بشكل شامل. يناقش هذا القسم أيضًا قطاعات سوق مطيافية الأشعة تحت الحمراء والجغرافيا في جميع أنحاء أمريكا الشمالية وأوروبا ومنطقة آسيا والمحيط الهادئ والشرق الأوسط وأفريقيا وأمريكا الجنوبية والوسطى.
- احصل على البيانات الإقليمية المحددة لسوق التحليل الطيفي بالأشعة تحت الحمراء
نطاق تقرير سوق مطيافية الأشعة تحت الحمراء
| سمة التقرير | تفاصيل |
|---|---|
| حجم السوق في عام 2023 | 1.36 مليار دولار أمريكي |
| حجم السوق بحلول عام 2031 | 2.47 مليار دولار أمريكي |
| معدل النمو السنوي المركب العالمي (2023 - 2031) | 7.8% |
| البيانات التاريخية | 2021-2022 |
| فترة التنبؤ | 2024-2031 |
| القطاعات المغطاة |
حسب التكنولوجيا
|
| المناطق والدول المغطاة |
أمريكا الشمالية
|
| قادة السوق وملفات تعريف الشركات الرئيسية |
|
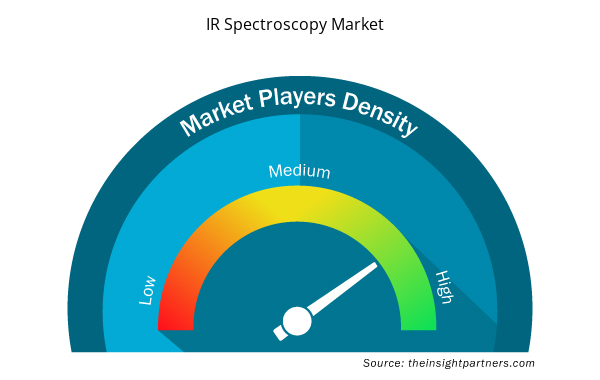
كثافة اللاعبين في السوق: فهم تأثيرها على ديناميكيات الأعمال
يشهد سوق التحليل الطيفي بالأشعة تحت الحمراء نموًا سريعًا، مدفوعًا بالطلب المتزايد من المستخدم النهائي بسبب عوامل مثل تفضيلات المستهلك المتطورة والتقدم التكنولوجي والوعي المتزايد بفوائد المنتج. ومع ارتفاع الطلب، تعمل الشركات على توسيع عروضها والابتكار لتلبية احتياجات المستهلكين والاستفادة من الاتجاهات الناشئة، مما يؤدي إلى زيادة نمو السوق.
تشير كثافة اللاعبين في السوق إلى توزيع الشركات أو المؤسسات العاملة في سوق أو صناعة معينة. وهي تشير إلى عدد المنافسين (اللاعبين في السوق) الموجودين في مساحة سوق معينة نسبة إلى حجمها أو قيمتها السوقية الإجمالية.
الشركات الرئيسية العاملة في سوق التحليل الطيفي بالأشعة تحت الحمراء هي:
- اجيلنت تكنولوجيز
- شركة.
- شركة بروكر
- هيتاشي
- المحدودة
- شركة هوريبا المحدودة
إخلاء المسؤولية : الشركات المذكورة أعلاه ليست مرتبة بأي ترتيب معين.
- احصل على نظرة عامة على أهم اللاعبين الرئيسيين في سوق التحليل الطيفي بالأشعة تحت الحمراء
أخبار سوق التحليل الطيفي بالأشعة تحت الحمراء والتطورات الأخيرة
يتم تقييم سوق التحليل الطيفي بالأشعة تحت الحمراء من خلال جمع البيانات النوعية والكمية بعد البحث الأولي والثانوي، والتي تتضمن منشورات الشركات المهمة وبيانات الجمعيات وقواعد البيانات. فيما يلي بعض التطورات في سوق التحليل الطيفي بالأشعة تحت الحمراء:
- أعلنت شركة وايلي، إحدى أكبر دور النشر في العالم والرائدة عالميًا في مجال البحث والتعلم، عن إصدار قاعدة بيانات وايلي الجديدة للأطياف المتوقعة للأشعة تحت الحمراء. تجمع قاعدة البيانات بين أكثر من 60 عامًا من الخبرة في مجال التحليل الطيفي للأشعة تحت الحمراء (IR) وتنظيم البيانات الطيفية مع أحدث تقنيات التعلم الآلي لتوسيع عدد البيانات الطيفية للأشعة تحت الحمراء المتاحة للتحليل الطيفي بشكل كبير. (المصدر: موقع شركة وايلي على الويب، نوفمبر 2023)
- أعلنت شركة Edinburgh Instruments عن إطلاق جهاز مطياف الأشعة تحت الحمراء بتقنية تحويل فورييه الجديد IR5، والذي تم تصميمه وتصنيعه في مقرها الرئيسي العالمي في اسكتلندا. يعد جهاز IR5 أول مطياف الأشعة تحت الحمراء بتقنية تحويل فورييه من علامة Edinburgh Instruments التجارية، والتي تشتهر بخبرتها في مجال الأجهزة المستخدمة في التحليل الطيفي لامتصاص رامان والفلورسنت والأشعة فوق البنفسجية. (المصدر: موقع شركة Edinburgh Instruments الإلكتروني، مارس 2023)
تغطية تقرير سوق التحليل الطيفي بالأشعة تحت الحمراء والمنتجات النهائية
يوفر تقرير "حجم سوق التحليل الطيفي بالأشعة تحت الحمراء والتوقعات (2021-2031)" تحليلاً مفصلاً للسوق يغطي المجالات التالية:
- حجم سوق التحليل الطيفي للأشعة تحت الحمراء وتوقعاته على المستويات العالمية والإقليمية والوطنية لجميع قطاعات السوق الرئيسية التي يغطيها النطاق.
- اتجاهات سوق التحليل الطيفي للأشعة تحت الحمراء بالإضافة إلى ديناميكيات السوق مثل المحركات والقيود والفرص الرئيسية.
- تحليل مفصل لقوى PEST/Porter الخمس و SWOT.
- تحليل سوق مطيافية الأشعة تحت الحمراء يغطي اتجاهات السوق الرئيسية والإطار العالمي والإقليمي واللاعبين الرئيسيين واللوائح والتطورات الأخيرة في السوق.
- تحليل المشهد الصناعي والمنافسة الذي يغطي تركيز السوق، وتحليل خريطة الحرارة، واللاعبين البارزين، والتطورات الأخيرة لسوق التحليل الطيفي للأشعة تحت الحمراء.
- ملفات تعريفية مفصلة للشركة.

نافين خبيرٌ متمرسٌ في أبحاث السوق والاستشارات، يتمتع بخبرةٍ تزيد عن 9 سنوات في مشاريع مُخصصة ومُشتركة واستشارية. يشغل حاليًا منصب نائب الرئيس المساعد، وقد نجح في إدارة أصحاب المصلحة عبر سلسلة قيمة المشاريع، وألّف أكثر من 100 تقرير بحثي وأكثر من 30 مهمة استشارية. يمتد نطاق عمله ليشمل مشاريع صناعية وحكومية، مساهمًا بشكل كبير في نجاح العملاء واتخاذ القرارات القائمة على البيانات.
نافين حاصلٌ على شهادة في هندسة الإلكترونيات والاتصالات من جامعة فرجينيا التقنية، كارناتاكا، وشهادة ماجستير في إدارة الأعمال في التسويق والعمليات من جامعة مانيبال. وهو عضوٌ نشطٌ في معهد مهندسي الكهرباء والإلكترونيات (IEEE) لمدة 9 سنوات، حيث شارك في مؤتمراتٍ وندواتٍ تقنية، وتطوّع على مستوى الأقسام والمناطق. قبل منصبه الحالي، عمل مستشارًا استراتيجيًا مساعدًا في IndustryARC، ومستشارًا للخوادم الصناعية في شركة هيوليت باكارد (HP Global).
- التحليل التاريخي (سنتان)، سنة الأساس، التوقعات (7 سنوات) مع معدل النمو السنوي المركب
- تحليل PEST و SWOT
- حجم السوق والقيمة / الحجم - عالمي، إقليمي، بلد
- الصناعة والمنافسة
- مجموعة بيانات إكسل
التقارير الحديثة
شهادات العملاء
تقرير سوق أنظمة SCADA من Insight Partners شامل، ويقدم رؤى قيّمة حول الاتجاهات الحالية والتوقعات المستقبلية. تميّز الفريق باحترافية عالية وسرعة في الاستجابة ودعم مستمر طوال الوقت. نحن راضون جدًا ونوصي بشدة بخدماتهم.
ران كيديم شريك, شركة ريالي تكنولوجيز المحدودةطلبتُ تقريرًا عن سوق برمجيات محدد، وأعدّه الفريق في غضون أيام قليلة. كانت المعلومات ذات صلة وثيقة وعرضها جيد. ثم طلبتُ بعض التعديلات والإضافات على التقرير. وكان الفريق متجاوبًا للغاية، وحصلتُ على التقرير النهائي في أقل من أسبوع.
جان هيرفيه جين رئيس مجلس الإدارة, فيوتشر أناليتيكاعملنا مع شركة "إنسايت بارتنرز" لإجراء دراسة سوقية وتوقعات مهمة. زودونا برؤى واضحة حول الفرص والمخاطر، مما ساعدنا في صياغة خططنا. كانت أبحاثهم سهلة الاستخدام ومبنية على بيانات دقيقة، مما ساعدنا على اتخاذ قرارات ذكية وواثقة. نوصي بهم بشدة.
بيوش ناجبال نائب الرئيس الأول, شعاع عالي عالميقدّمت شركة Insight Partners أبحاثًا سوقية ثاقبة ومنظمة جيدًا بخبرة واسعة في هذا المجال. تميّز فريقهم بالاحترافية وسرعة الاستجابة طوال الوقت. وسهّل موقعهم الإلكتروني سهل الاستخدام الوصول إلى تقارير القطاع. نوصي بهم بشدة لخدمات بحثية موثوقة وعالية الجودة.
يوكيهيكو أداتشي المدير التنفيذي, ديب بلو، ذ.م.م.هذه أول مرة أشتري فيها تقرير سوق من The Insight Partners. رغم أنني كنت مترددًا في البداية، إلا أنني زرت موقعهم الإلكتروني وشعرت براحة أكبر للمخاطرة وشراء تقرير السوق. أنا راضٍ تمامًا عن جودة التقرير وخدمة العملاء. كانت لديّ عدة أسئلة وتعليقات حول التقرير الأولي، ولكن بعد بضع محادثات عبر البريد الإلكتروني مع محللهم، أعتقد أن لديّ تقريرًا يمكنني استخدامه كمدخل لعملية التخطيط الاستراتيجي لدينا. شكرًا جزيلاً لكم على تخصيص وقتكم الإضافي وجعل هذه التجربة إيجابية. سأوصي بخدماتكم للآخرين بالتأكيد، وستكونون أول من ألجأ إليه عندما نحتاج إلى المزيد من بيانات السوق.
جون سوزوكي الرئيس والرئيس التنفيذي وعضو مجلس الإدارة, بي كيه تكنولوجيزأود أن أقدّر دعمكم واحترافيتكم في الاستجابة لطلبي للحصول على معلومات بشأن سوق التشخيص المخبري للأمراض المعدية في نيجيريا. كما أُقدّر صبركم وتوجيهكم، واستعدادكم لتقديم خصم، مما مكّننا في النهاية من إتمام الصفقة. أتطلع إلى التعامل مع "ذا إنسايت بارتنرز" مستقبلًا، كل ذلك بفضل الانطباع الذي تركتموه لديّ نتيجةً لهذا اللقاء الأول.
الدكتور تشيجيوك أونيا المدير الإداري, شركة باينكريست للرعاية الصحية المحدودةسبب الشراء
- اتخاذ قرارات مدروسة
- فهم ديناميكيات السوق
- تحليل المنافسة
- رؤى العملاء
- توقعات السوق
- تخفيف المخاطر
- التخطيط الاستراتيجي
- مبررات الاستثمار
- تحديد الأسواق الناشئة
- تحسين استراتيجيات التسويق
- تعزيز الكفاءة التشغيلية
- مواكبة التوجهات التنظيمية


 احصل على عينة مجانية ل - سوق مطيافية الأشعة تحت الحمراء