نظرة عامة على سوق طابعات الملصقات والنمو والاتجاهات والتحليل والتقرير البحثي (2021-2031)
البيانات التاريخية : 2021-2022 | سنة الأساس : 2023 | فترة التنبؤ : 2024-2031حجم سوق طابعات الملصقات وتوقعاته (2021-2031)، والحصة العالمية والإقليمية، والاتجاهات، وفرص النمو. يغطي التقرير: حسب النوع (صناعي، مكتبي، ومحمول)، والتكنولوجيا (النقل الحراري، والحراري المباشر، وغير الحراري)، وقطاع المستخدم النهائي (التصنيع، والتجزئة، والنقل والخدمات اللوجستية، والرعاية الصحية، والسلع الاستهلاكية سريعة التداول، والترفيه، وغيرها)، والجغرافيا.
- تاريخ التقرير : Mar 2026
- رمز التقرير : TIPRE00013769
- الفئة : الإلكترونيات وأشباه الموصلات
- الحالة : البيانات الصادرة
- تنسيقات التقارير المتاحة :


- عدد الصفحات : 150
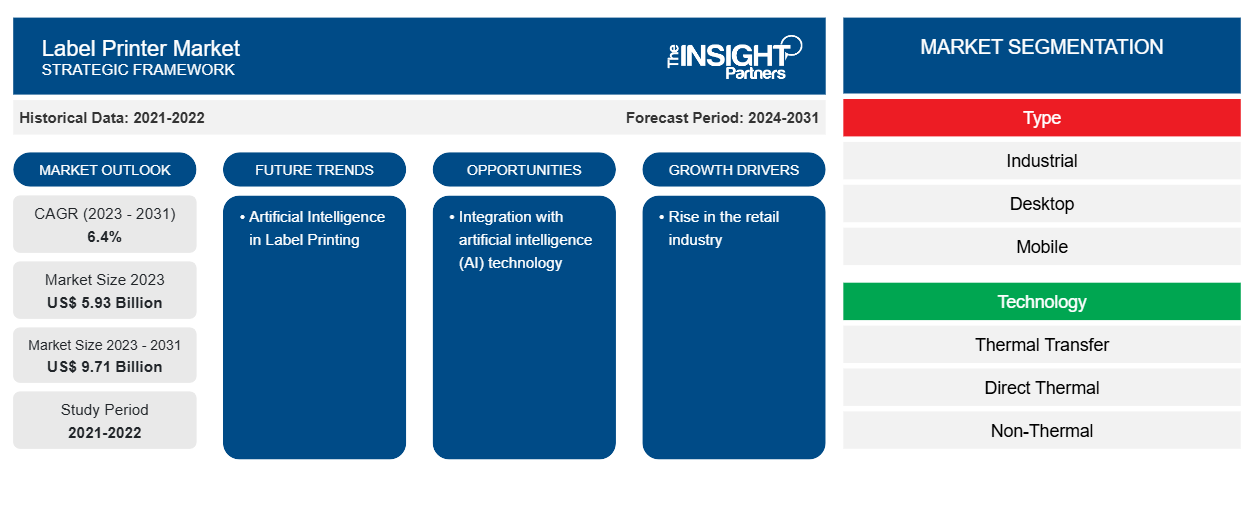
من المتوقع أن يصل حجم سوق طابعات الملصقات إلى 9.71 مليار دولار أمريكي بحلول عام 2031 من 5.93 مليار دولار أمريكي في عام 2023. ومن المتوقع أن يسجل السوق معدل نمو سنوي مركب بنسبة 6.4٪ في الفترة 2023-2031. ومن المرجح أن يظل الطلب المتزايد على طابعات الملصقات من قطاع الأدوية والنمو في صناعة التعبئة والتغليف من الاتجاهات الرئيسية لسوق طابعات الملصقات.
تحليل سوق طابعات الملصقات
تستخدم العديد من الصناعات، بما في ذلك إدارة سلسلة التوريد، ووضع علامات على أسعار التجزئة، وملصقات التغليف، وغيرها، طابعات الملصقات. تتم طباعة المعلومات أو الرموز حول المنتج أو العنصر والتي تساعد كل من البائع والعميل باستخدام طابعات الملصقات. ومن المتوقع أن يرتفع الطلب على الطابعات المكتبية والمحمولة/المحمولة خلال فترة التنبؤ بسبب الحاجة المستمرة لصناعة التصنيع إلى أدوات طباعة ملصقات بسيطة ومريحة. بالإضافة إلى ذلك، فإن النمو في صناعة التجزئة يعزز الطلب على طابعات الملصقات.
نظرة عامة على سوق طابعات الملصقات
طابعة الملصقات هي نوع من الطابعات الحاسوبية التي يمكنها الطباعة على ورق مقوى (علامات) أو مواد ملصقات ذاتية اللصق. أجهزة صنع الملصقات هي طابعات ملصقات تأتي مع لوحة مفاتيح وشاشة مدمجة للعمل بشكل مستقل (أي غير متصلة بجهاز كمبيوتر منفصل). نظرًا لأنها تتطلب آليات تغذية متخصصة للتعامل مع المخزون الملفوف أو المخزون الممزق (المروحة)، فإن طابعات الملصقات تختلف عن الطابعات العادية. تستخدم طابعات الملصقات مجموعة متنوعة من مواد الملصقات، مثل الورق والمواد البوليمرية الاصطناعية (البلاستيكية).
قم بتخصيص هذا التقرير ليناسب متطلباتك
ستحصل على تخصيص لأي تقرير - مجانًا - بما في ذلك أجزاء من هذا التقرير، أو تحليل على مستوى الدولة، وحزمة بيانات Excel، بالإضافة إلى الاستفادة من العروض والخصومات الرائعة للشركات الناشئة والجامعات
سوق طابعات الملصقات: رؤى استراتيجية
-
احصل على أهم اتجاهات السوق الرئيسية لهذا التقرير.ستتضمن هذه العينة المجانية تحليلاً للبيانات، بدءًا من اتجاهات السوق وحتى التقديرات والتوقعات.
محركات وفرص سوق طابعات الملصقات
ارتفاع في صناعة التجزئة لصالح السوق
في جميع أنحاء العالم، يتزايد ارتفاع الدخل المتاح والقدرة الشرائية للمستهلكين، مما يؤدي إلى شراء منتجات التجزئة المختلفة. بالإضافة إلى ذلك، يؤدي النمو السكاني أيضًا إلى زيادة الطلب على منتجات التجزئة. وبالتالي، فإن النمو في قطاع التجزئة وصناعة التجارة الإلكترونية يولد الطلب على المعدات والآلات مثل طابعات الملصقات، والتي تسرع العمليات في هذه الصناعات لتلبية طلب العملاء في الوقت المحدد. تضمن الطابعات، مثل طابعات ملصقات الأسعار وطابعات الباركود، تتبع البضائع وتسعيرها وعرضها للمستهلكين بشكل مناسب. نظرًا لأن المعلومات الموجودة على الملصق تساعد تجار التجزئة في إدارة مخزونهم وتخزين المنتجات بكفاءة، فإن الطلب على طابعات الملصقات يكتسب زخمًا في صناعة التجزئة.
الذكاء الاصطناعي في طباعة الملصقات – فرصة في سوق طابعات الملصقات
في الوقت الحاضر، ومع تغير المشهد الرقمي باستمرار، تبحث الشركات في جميع القطاعات دائمًا عن طرق جديدة ومبتكرة لتحسين عملياتها والحصول على ميزة تنافسية. تعد طباعة الملصقات مجرد أحد المجالات العديدة لعمليات الأعمال التي تتمتع الذكاء الاصطناعي بإمكانية تحويلها تمامًا. يمكن للشركات استخدام الذكاء الاصطناعي لأتمتة عملية التصميم وإنتاج ملصقات جميلة من خلال الاستفادة من خوارزميات متطورة. يمكن تحليل كميات كبيرة من البيانات، مثل عناصر التصميم واتجاهات الصناعة وتفضيلات المستهلكين، بواسطة خوارزميات الذكاء الاصطناعي لإنشاء تصميمات ملصقات مخصصة لعلامات تجارية أو منتجات معينة. يمكن للشركات ضمان أن ملصقاتها تلبي أعلى معايير الدقة والجاذبية الجمالية من خلال تنفيذ أنظمة مراقبة الجودة التي تعمل بالذكاء الاصطناعي. سيؤدي هذا العامل في النهاية إلى تحسين رضا العملاء وسمعة العلامة التجارية. ستولد مثل هذه الفوائد للذكاء الاصطناعي في طباعة الملصقات الطلب على الطابعات المتقدمة وستخلق فرص نمو مربحة لسوق طابعات الملصقات.
تقرير تحليل تجزئة سوق طابعات الملصقات
إن القطاعات الرئيسية التي ساهمت في اشتقاق تحليل سوق طابعات الملصقات هي النوع والتكنولوجيا وصناعة المستخدم النهائي.
- بناءً على النوع، يتم تقسيم السوق إلى صناعي وسطح مكتبي ومحمول. احتل قطاع سطح المكتب حصة سوقية أكبر في عام 2023.
- من حيث التكنولوجيا، يتم تقسيم السوق إلى نقل حراري ، ونقل حراري مباشر، وغير حراري. احتلت شريحة النقل الحراري المباشر الحصة الأكبر من السوق في عام 2023.
- استنادًا إلى صناعة الاستخدام النهائي، يتم تقسيم السوق إلى التصنيع والتجزئة والنقل والخدمات اللوجستية والرعاية الصحية والسلع الاستهلاكية سريعة الاستهلاك والترفيه وغيرها. احتل قطاع التجزئة حصة سوقية أكبر في عام 2023.
تحليل حصة سوق طابعات الملصقات حسب المنطقة الجغرافية
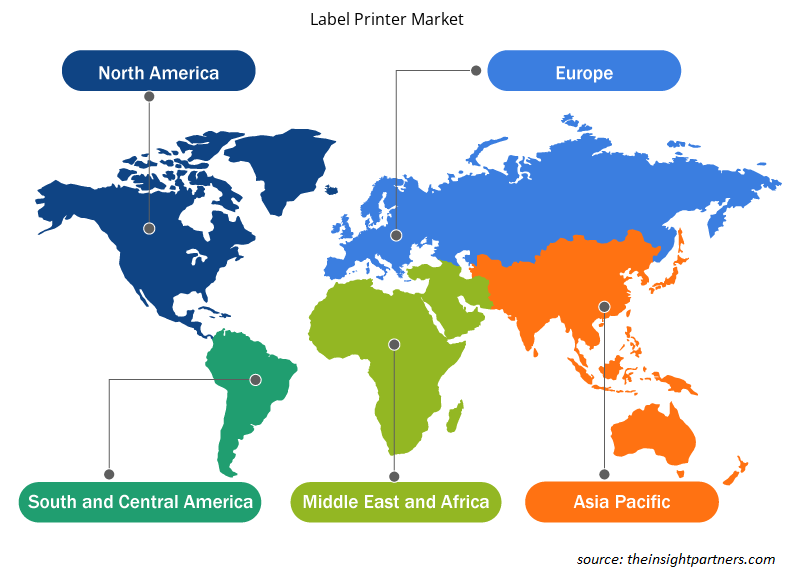
ينقسم النطاق الجغرافي لتقرير سوق طابعات الملصقات بشكل أساسي إلى خمس مناطق: أمريكا الشمالية، ومنطقة آسيا والمحيط الهادئ، وأوروبا، والشرق الأوسط وأفريقيا، وأمريكا الجنوبية/أمريكا الجنوبية والوسطى.
من حيث الإيرادات، استحوذت أمريكا الشمالية على أكبر حصة في سوق طابعات الملصقات. تعد الولايات المتحدة وكندا والمكسيك من بين الدول الرئيسية في أمريكا الشمالية. إن ارتفاع الطلب على طابعات الملصقات من صناعات المستخدم النهائي، مثل التصنيع وتجارة التجزئة والخدمات اللوجستية وغيرها، يغذي نمو السوق في المنطقة. كما يعمل النمو السكاني في المنطقة على زيادة الطلب على المنتجات والخدمات المختلفة التي تتطلب ملصقات تحمل جميع المعلومات المتعلقة بالمنتج، مما يزيد من الطلب على طابعات الملصقات.
رؤى إقليمية حول سوق طابعات الملصقات
لقد قام المحللون في Insight Partners بشرح الاتجاهات والعوامل الإقليمية المؤثرة على سوق طابعات الملصقات طوال فترة التوقعات بشكل شامل. يناقش هذا القسم أيضًا قطاعات سوق طابعات الملصقات والجغرافيا في جميع أنحاء أمريكا الشمالية وأوروبا ومنطقة آسيا والمحيط الهادئ والشرق الأوسط وأفريقيا وأمريكا الجنوبية والوسطى.
- احصل على البيانات الإقليمية المحددة لسوق طابعات الملصقات
نطاق تقرير سوق طابعات الملصقات
| سمة التقرير | تفاصيل |
|---|---|
| حجم السوق في عام 2023 | 5.93 مليار دولار أمريكي |
| حجم السوق بحلول عام 2031 | 9.71 مليار دولار أمريكي |
| معدل النمو السنوي المركب العالمي (2023 - 2031) | 6.4% |
| البيانات التاريخية | 2021-2022 |
| فترة التنبؤ | 2024-2031 |
| القطاعات المغطاة |
حسب النوع
|
| المناطق والدول المغطاة |
أمريكا الشمالية
|
| قادة السوق وملفات تعريف الشركات الرئيسية |
|
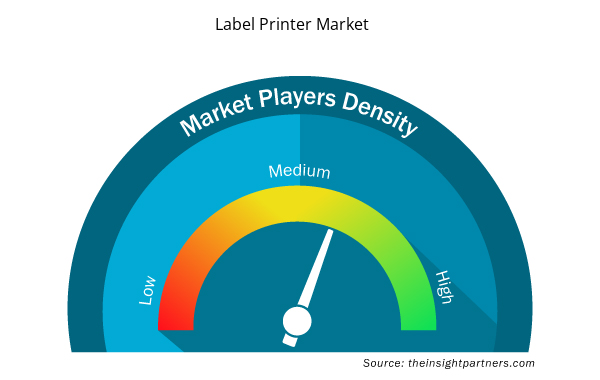
كثافة اللاعبين في سوق طابعات الملصقات: فهم تأثيرها على ديناميكيات الأعمال
يشهد سوق طابعات الملصقات نموًا سريعًا، مدفوعًا بالطلب المتزايد من المستخدم النهائي بسبب عوامل مثل تفضيلات المستهلك المتطورة والتقدم التكنولوجي والوعي المتزايد بفوائد المنتج. ومع ارتفاع الطلب، تعمل الشركات على توسيع عروضها والابتكار لتلبية احتياجات المستهلكين والاستفادة من الاتجاهات الناشئة، مما يؤدي إلى زيادة نمو السوق.
تشير كثافة اللاعبين في السوق إلى توزيع الشركات أو المؤسسات العاملة في سوق أو صناعة معينة. وهي تشير إلى عدد المنافسين (اللاعبين في السوق) الموجودين في مساحة سوق معينة نسبة إلى حجمها أو قيمتها السوقية الإجمالية.
الشركات الرئيسية العاملة في سوق طابعات الملصقات هي:
- شركة توشيبا تيك
- شركة هونيويل الدولية
- شركة بوستيك للإلكترونيات المحدودة
- تكنولوجيا الباركود من شركة واسب
- شركة VIPColor Technologies Pte Ltd.
- شركة جوديكس الدولية المحدودة
إخلاء المسؤولية : الشركات المذكورة أعلاه ليست مرتبة بأي ترتيب معين.
- احصل على نظرة عامة على أهم اللاعبين الرئيسيين في سوق طابعات الملصقات
أخبار سوق طابعات الملصقات والتطورات الأخيرة
يتم تقييم سوق طابعات الملصقات من خلال جمع البيانات النوعية والكمية بعد البحث الأولي والثانوي، والتي تتضمن منشورات الشركات المهمة وبيانات الجمعيات وقواعد البيانات. فيما يلي قائمة بالتطورات في السوق:
- في فبراير 2023، أعلنت شركة إبسون عن أول طابعات ملصقات خاصة بها للحرفيين والمنزل. تتميز الطابعتان LabelWorks LW-C610 وLW-C410 بخفة الوزن وسهولة الحمل والاستخدام من الهاتف المحمول، مما يجعلها مثالية لإزالة الفوضى والتنظيم والحرف اليدوية في جميع أنحاء المنزل والمكتب. (المصدر: إبسون، بيان صحفي، 2023)
- في مايو 2023، أعلنت شركة Newland AIDC، وهي شركة رائدة في صناعة التعريف الآلي والتقاط البيانات، عن إطلاق أول طابعة ملصقات لها، وهي NLS-LP410. تعد طابعة الملصقات الجديدة ذات النقل الحراري أحدث إضافة إلى خط المنتجات الشامل المتفوق للشركة، والذي يتضمن ماسحات الباركود، والمحطات المتنقلة، والأكشاك التفاعلية، ومحركات المسح الضوئي OEM. (المصدر: Newland AIDC، بيان صحفي، 2023)
- في أبريل 2023، أعلنت شركة SATO، الرائدة عالميًا في مجال طباعة الباركود ووضع العلامات وحلول التعريف التلقائي، عن إطلاق CT4-LX-HC، وهي طابعة ملصقات ذكية وبديهية مخصصة مقاس 4 بوصات لقطاع الرعاية الصحية. تعد CT4-LX-HC طابعة سطح مكتب متعددة الاستخدامات بشكل استثنائي ومصممة لتحقيق رعاية عالية المستوى للمرضى والمستهلكين. كما تتميز بغلاف مضاد للميكروبات يمكن مسحه بمناديل مطهرة لتقليل مخاطر العدوى وإعادة التلوث في البيئة السريرية. (المصدر: SATO، بيان صحفي، 2023)
تقرير سوق طابعات الملصقات والتغطية والنتائج المتوقعة
يوفر تقرير "حجم سوق طابعات الملصقات والتوقعات (2021-2031)" تحليلاً مفصلاً للسوق يغطي المجالات التالية:
- حجم السوق والتوقعات على المستويات العالمية والإقليمية والوطنية لجميع قطاعات السوق الرئيسية التي يغطيها النطاق
- ديناميكيات السوق مثل المحركات والقيود والفرص الرئيسية
- الاتجاهات المستقبلية الرئيسية
- تحليل مفصل لقوى PEST/Porter الخمس وSWOT
- تحليل السوق العالمي والإقليمي الذي يغطي اتجاهات السوق الرئيسية واللاعبين الرئيسيين واللوائح والتطورات الأخيرة في السوق
- تحليل المشهد الصناعي والمنافسة الذي يغطي تركيز السوق، وتحليل خريطة الحرارة، واللاعبين البارزين، والتطورات الأخيرة
- ملفات تعريف الشركة التفصيلية

نافين خبيرٌ متمرسٌ في أبحاث السوق والاستشارات، يتمتع بخبرةٍ تزيد عن 9 سنوات في مشاريع مُخصصة ومُشتركة واستشارية. يشغل حاليًا منصب نائب الرئيس المساعد، وقد نجح في إدارة أصحاب المصلحة عبر سلسلة قيمة المشاريع، وألّف أكثر من 100 تقرير بحثي وأكثر من 30 مهمة استشارية. يمتد نطاق عمله ليشمل مشاريع صناعية وحكومية، مساهمًا بشكل كبير في نجاح العملاء واتخاذ القرارات القائمة على البيانات.
نافين حاصلٌ على شهادة في هندسة الإلكترونيات والاتصالات من جامعة فرجينيا التقنية، كارناتاكا، وشهادة ماجستير في إدارة الأعمال في التسويق والعمليات من جامعة مانيبال. وهو عضوٌ نشطٌ في معهد مهندسي الكهرباء والإلكترونيات (IEEE) لمدة 9 سنوات، حيث شارك في مؤتمراتٍ وندواتٍ تقنية، وتطوّع على مستوى الأقسام والمناطق. قبل منصبه الحالي، عمل مستشارًا استراتيجيًا مساعدًا في IndustryARC، ومستشارًا للخوادم الصناعية في شركة هيوليت باكارد (HP Global).
- التحليل التاريخي (سنتان)، سنة الأساس، التوقعات (7 سنوات) مع معدل النمو السنوي المركب
- تحليل PEST و SWOT
- حجم السوق والقيمة / الحجم - عالمي، إقليمي، بلد
- الصناعة والمنافسة
- مجموعة بيانات إكسل
التقارير الحديثة
تقارير ذات صلة
شهادات العملاء
تقرير سوق أنظمة SCADA من Insight Partners شامل، ويقدم رؤى قيّمة حول الاتجاهات الحالية والتوقعات المستقبلية. تميّز الفريق باحترافية عالية وسرعة في الاستجابة ودعم مستمر طوال الوقت. نحن راضون جدًا ونوصي بشدة بخدماتهم.
ران كيديم شريك, شركة ريالي تكنولوجيز المحدودةطلبتُ تقريرًا عن سوق برمجيات محدد، وأعدّه الفريق في غضون أيام قليلة. كانت المعلومات ذات صلة وثيقة وعرضها جيد. ثم طلبتُ بعض التعديلات والإضافات على التقرير. وكان الفريق متجاوبًا للغاية، وحصلتُ على التقرير النهائي في أقل من أسبوع.
جان هيرفيه جين رئيس مجلس الإدارة, فيوتشر أناليتيكاعملنا مع شركة "إنسايت بارتنرز" لإجراء دراسة سوقية وتوقعات مهمة. زودونا برؤى واضحة حول الفرص والمخاطر، مما ساعدنا في صياغة خططنا. كانت أبحاثهم سهلة الاستخدام ومبنية على بيانات دقيقة، مما ساعدنا على اتخاذ قرارات ذكية وواثقة. نوصي بهم بشدة.
بيوش ناجبال نائب الرئيس الأول, شعاع عالي عالميقدّمت شركة Insight Partners أبحاثًا سوقية ثاقبة ومنظمة جيدًا بخبرة واسعة في هذا المجال. تميّز فريقهم بالاحترافية وسرعة الاستجابة طوال الوقت. وسهّل موقعهم الإلكتروني سهل الاستخدام الوصول إلى تقارير القطاع. نوصي بهم بشدة لخدمات بحثية موثوقة وعالية الجودة.
يوكيهيكو أداتشي المدير التنفيذي, ديب بلو، ذ.م.م.هذه أول مرة أشتري فيها تقرير سوق من The Insight Partners. رغم أنني كنت مترددًا في البداية، إلا أنني زرت موقعهم الإلكتروني وشعرت براحة أكبر للمخاطرة وشراء تقرير السوق. أنا راضٍ تمامًا عن جودة التقرير وخدمة العملاء. كانت لديّ عدة أسئلة وتعليقات حول التقرير الأولي، ولكن بعد بضع محادثات عبر البريد الإلكتروني مع محللهم، أعتقد أن لديّ تقريرًا يمكنني استخدامه كمدخل لعملية التخطيط الاستراتيجي لدينا. شكرًا جزيلاً لكم على تخصيص وقتكم الإضافي وجعل هذه التجربة إيجابية. سأوصي بخدماتكم للآخرين بالتأكيد، وستكونون أول من ألجأ إليه عندما نحتاج إلى المزيد من بيانات السوق.
جون سوزوكي الرئيس والرئيس التنفيذي وعضو مجلس الإدارة, بي كيه تكنولوجيزأود أن أقدّر دعمكم واحترافيتكم في الاستجابة لطلبي للحصول على معلومات بشأن سوق التشخيص المخبري للأمراض المعدية في نيجيريا. كما أُقدّر صبركم وتوجيهكم، واستعدادكم لتقديم خصم، مما مكّننا في النهاية من إتمام الصفقة. أتطلع إلى التعامل مع "ذا إنسايت بارتنرز" مستقبلًا، كل ذلك بفضل الانطباع الذي تركتموه لديّ نتيجةً لهذا اللقاء الأول.
الدكتور تشيجيوك أونيا المدير الإداري, شركة باينكريست للرعاية الصحية المحدودةسبب الشراء
- اتخاذ قرارات مدروسة
- فهم ديناميكيات السوق
- تحليل المنافسة
- رؤى العملاء
- توقعات السوق
- تخفيف المخاطر
- التخطيط الاستراتيجي
- مبررات الاستثمار
- تحديد الأسواق الناشئة
- تحسين استراتيجيات التسويق
- تعزيز الكفاءة التشغيلية
- مواكبة التوجهات التنظيمية


 احصل على عينة مجانية ل - سوق طابعات الملصقات