نمو سوق نظام إدارة الطوابير والحجم والحصة والاتجاهات وتحليل اللاعبين الرئيسيين والتوقعات حتى عام 2031
البيانات التاريخية : 2021-2022 | سنة الأساس : 2023 | فترة التنبؤ : 2024-2031حجم سوق أنظمة إدارة الطوابير وتوقعاتها (2021-2031)، والحصة العالمية والإقليمية، والاتجاهات، وفرص النمو. يغطي التقرير: حسب النوع (الطوابير الافتراضية والخطية)، والمكون (الحلول والخدمات)، والتطبيق (قطاع الخدمات المصرفية والمالية والتأمين، والمستشفيات، ومنافذ البيع بالتجزئة، والمطاعم، ومقدمي خدمات المرافق والمطارات، والمكاتب الحكومية، وغيرها)، والموقع الجغرافي.
- تاريخ التقرير : Oct 2024
- رمز التقرير : TIPRE00010671
- الفئة : التكنولوجيا والإعلام والاتصالات
- الحالة : نُشرت
- تنسيقات التقارير المتاحة :


- عدد الصفحات : 183
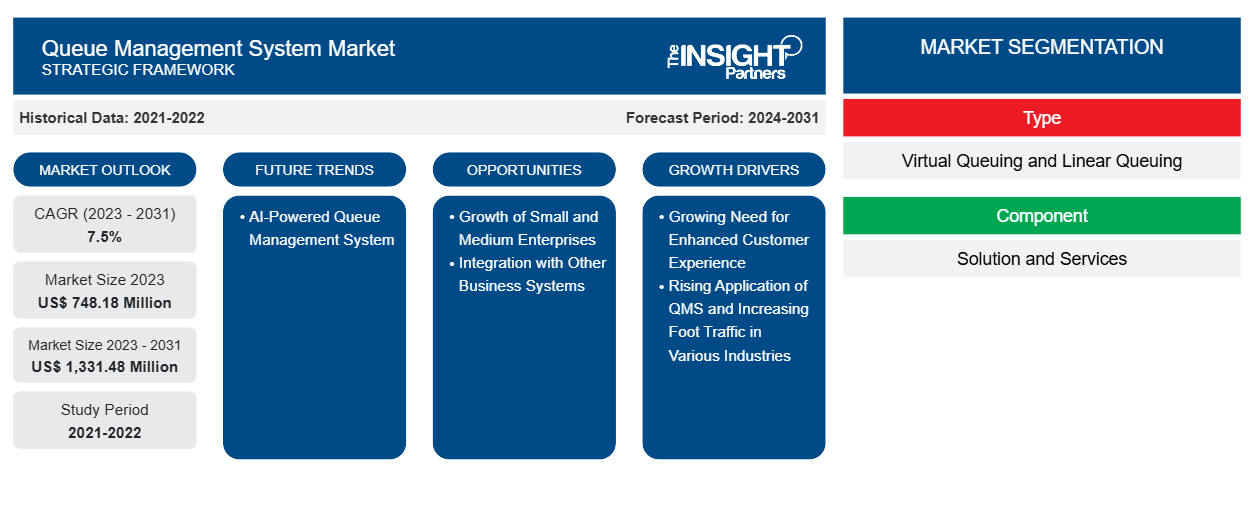
من المتوقع أن يصل حجم سوق نظام إدارة الطوابير إلى 1,331.48 مليون دولار أمريكي بحلول عام 2031 من 748.18 مليون دولار أمريكي في عام 2023. ومن المتوقع أن يسجل السوق معدل نمو سنوي مركب بنسبة 7.5٪ خلال الفترة 2023-2031. ومن المرجح أن يؤدي الطلب المتزايد على أنظمة إدارة الطوابير المدعومة بالذكاء الاصطناعي إلى ظهور اتجاهات جديدة في السوق في السنوات القادمة.
تحليل سوق نظام إدارة الطوابير
إن عوامل مثل الحاجة إلى تحسين تجربة العملاء، والتطبيق المتزايد لنظام إدارة الجودة، وزيادة حركة المشاة في مختلف الصناعات تدفع سوق نظام إدارة الطوابير . ومن المتوقع أن ينمو السوق في الفترة المتوقعة بسبب نمو الشركات الصغيرة والمتوسطة الحجم، والطلب المتزايد على إدارة الطوابير الافتراضية، ودمج نظام إدارة الجودة مع أنظمة الأعمال الأخرى. إن ارتفاع أنظمة إدارة الطوابير التي تعمل بالذكاء الاصطناعي هو اتجاه رئيسي في السوق. بالإضافة إلى ذلك، أدى ظهور التقنيات القائمة على السحابة وتبني الحلول المتقدمة مثل الطوابير الافتراضية والتذاكر عبر الهاتف المحمول إلى تحويل الطريقة التي تتفاعل بها المؤسسات مع العملاء، مما يسمح بمرونة وكفاءة أكبر. تعد قطاعات الرعاية الصحية وتجارة التجزئة والخدمات المصرفية من المساهمين الرئيسيين في هذا النمو، حيث تقوم بشكل متزايد بتنفيذ نظام إدارة الجودة للتعامل مع أحجام العملاء المتزايدة وتحسين الكفاءة التشغيلية. علاوة على ذلك، يوفر دمج تحليلات البيانات داخل هذه الأنظمة رؤى قيمة تساعد المؤسسات على تحسين عمليات الخدمة الخاصة بها، مما يؤدي في النهاية إلى دفع تبني المنتج وتوسيع السوق.
نظرة عامة على سوق نظام إدارة طوابير الانتظار
يتألف نظام إدارة الطوابير (QMS) من أدوات تُستخدم لإدارة وتحليل تدفق العملاء أو الزوار في قائمة الانتظار. ويهدف النظام إلى تحسين الكفاءة التشغيلية من خلال تقليل أوقات انتظار المستخدم النهائي. تساعد أنظمة إدارة الطوابير مقدم الخدمة على تحسين تقديم الخدمة وزيادة إنتاجية الموظفين وتبسيط تجربة الانتظار. لقد كان سوق نظام إدارة الطوابير ينمو بمعدل ثابت على مر السنين بسبب الارتفاع في الطلب على هيكلة وإدارة الطوابير بكفاءة وراحة. على مر السنين، استمر عدد المستخدمين النهائيين لأنظمة إدارة الطوابير في الارتفاع. تم تصميم النظام خصيصًا ليناسب احتياجات متاجر التجزئة، والخدمات المصرفية والمالية والتأمين، والرعاية الصحية، والمكاتب الحكومية، والمؤسسات التعليمية. على سبيل المثال، وفقًا لمجلس المطارات الدولي (ACI) العالمي، هناك نمو سنوي متوسط بنسبة 5.8% في حركة الركاب من عام 2022 إلى عام 2040، وسيستخدم أكثر من 19 مليار مسافر المطارات كل عام حتى عام 2040. ومن المتوقع أن يؤدي هذا إلى زيادة اعتماد أنظمة إدارة طوابير الانتظار في المطارات خلال الفترة المتوقعة.
قم بتخصيص هذا التقرير ليناسب متطلباتك
ستحصل على تخصيص لأي تقرير - مجانًا - بما في ذلك أجزاء من هذا التقرير، أو تحليل على مستوى الدولة، وحزمة بيانات Excel، بالإضافة إلى الاستفادة من العروض والخصومات الرائعة للشركات الناشئة والجامعات
سوق نظام إدارة الطوابير: رؤى استراتيجية
- احصل على أهم اتجاهات السوق الرئيسية لهذا التقرير.ستتضمن هذه العينة المجانية تحليلاً للبيانات، بدءًا من اتجاهات السوق وحتى التقديرات والتوقعات.
محركات وفرص سوق نظام إدارة الطوابير
الحاجة المتزايدة لتحسين تجربة العملاء
تدرك الشركات بشكل متزايد أن إدارة حركة العملاء وتقليل أوقات الانتظار يمكن أن يعزز بشكل كبير من رضا العملاء. يلعب كل تفاعل، سواء كان يتضمن إرجاع عنصر أو الحصول على إصلاح أو معالجة سؤال، دورًا مهمًا في تشكيل العلاقة الوشيكة بين العميل والشركة. وفقًا لـ Qtrac، يشير 93٪ من المستهلكين إلى أنهم أكثر عرضة ليصبحوا عملاء متكررين عندما تقدم الشركة خدمة عملاء متميزة. وعلاوة على ذلك، وفقًا لـ Zendesk، يشير 73٪ من المستهلكين إلى أنهم من المرجح أن يتحولوا إلى منافس بعد عدة تجارب سلبية مع الشركة. تسلط هذه الإحصائية الضوء على أهمية الحفاظ على خدمة عملاء عالية الجودة وتفاعلات إيجابية متسقة. في سيناريو السوق شديد التنافسية، حيث يتوفر للمستهلكين العديد من الخيارات، يجب على الشركات ألا تتجاهل تأثير تجربة العميل على الاحتفاظ. غالبًا ما لا يتعلق قرار التحول بالتجربة الفورية فحسب، بل يتعلق أيضًا بالتأثير التراكمي للتفاعلات السابقة. للتخفيف من خطر فقدان العملاء، يجب على المؤسسات معالجة المشكلات المحتملة بشكل استباقي، والسعي للحصول على تعليقات العملاء، وتنفيذ التحسينات بناءً على تلك التعليقات. من خلال إعطاء الأولوية للخدمة الاستثنائية وإظهار الالتزام بإرضاء العملاء، يمكن للشركات تعزيز الولاء وتقليل احتمالية لجوء العملاء إلى المنافسين. هذا التحول نحو إعطاء الأولوية لتجربة العملاء يشجع المؤسسات على تبني حلول إدارة الطوابير.
النمو السريع في عدد السكان هو عامل رئيسي يؤدي إلى طوابير غير منظمة في المستشفيات والمتاجر والعيادات والمطارات وغيرها من المرافق، مما يسبب الإحباط بين الحشود ويؤدي إلى تدهور جودة الخدمة. بالإضافة إلى ذلك، في وقت ذروة ساعات العمل، يستمر الازدحام في الطابور، وهذا يؤدي إلى فقدان جودة الخدمة حيث يحاول الموظفون إدارة الطابور يدويًا. وفقًا لبيانات Midlands Technical College لشهر يناير 2022، تفقد الشركات عملائها المحتملين بسبب سوء الخدمة وعدم رضا العملاء. وقدرت البيانات أن سوء خدمة العملاء تسبب في خسارة الأعمال، تتراوح من 75 مليار دولار أمريكي إلى 1.6 تريليون دولار أمريكي سنويًا، بسبب الطوابير الطويلة واستراتيجيات خفض التكاليف وعدم فهم رغبات العملاء والتضحية برضا العملاء من أجل النمو، من بين قضايا أخرى. ومن المتوقع أن تزداد هذه الخسارة في الإيرادات في السنوات القادمة، مما يحول تفضيل العملاء إلى منتجات المنافسين، مما يؤدي بالتالي إلى فقدان العملاء المحتملين. بهدف إدارة طوابير الانتظار بكفاءة وتحسين جودة الخدمة، يختار مزودو الخدمة المعنيون حلول إدارة طوابير الانتظار. وبالتالي، فإن الحاجة المتزايدة إلى تحسين تجربة العملاء تدفع سوق أنظمة إدارة طوابير الانتظار.
نمو الشركات الصغيرة والمتوسطة
من المتوقع أن يقدم نمو الشركات الصغيرة والمتوسطة فرصًا كبيرة لتوسيع سوق نظام إدارة الطوابير خلال فترة التنبؤ. غالبًا ما تتميز الشركات الصغيرة والمتوسطة بمرونتها وقدرتها على التكيف، مما يمكنها من تطوير حلول مخصصة تلبي احتياجات العملاء المحددة بشكل أكثر فعالية من الشركات الكبيرة الحجم. في عام 2022، غالبًا ما تكون الشركات الصغيرة والمتوسطة، التي تمثل ما يقرب من 99٪ من جميع الشركات في الاتحاد الأوروبي، أكثر مرونة وإبداعًا، مما يسمح لها بتبني التقنيات المتقدمة مثل أنظمة إدارة الجودة لتعزيز تجارب العملاء والكفاءة التشغيلية. علاوة على ذلك، في عام 2021، وفقًا لمنظمة التعاون الاقتصادي والتنمية، تلعب الشركات الصغيرة والمتوسطة دورًا حاسمًا في المشهد الاقتصادي للعديد من البلدان، حيث تساهم بنحو 50٪ من إجمالي العمالة و40٪ من الناتج المحلي الإجمالي. مع استمرار الشركات الصغيرة والمتوسطة في النمو والسعي إلى الحصول على مزايا تنافسية، سيزداد اعتماد أنظمة إدارة الطوابير (QMS) حيث تدرك هذه الشركات أهمية تعزيز الكفاءة التشغيلية وتجربة العملاء. مع توسع الشركات الصغيرة والمتوسطة الحجم، تواجه توقعات متزايدة من العملاء بشأن الخدمة السريعة والفعّالة، مما يجعل إدارة تدفق العملاء بشكل فعّال أمرًا ضروريًا. توفر أنظمة إدارة الطوابير لهذه الشركات الأدوات اللازمة لتبسيط العمليات، وتقليل أوقات الانتظار، وتحسين تقديم الخدمة بشكل عام، وهو أمر بالغ الأهمية للاحتفاظ بالعملاء في سوق تنافسية. علاوة على ذلك، أصبح دمج الحلول الرقمية في الشركات الصغيرة والمتوسطة الحجم أكثر انتشارًا، مما يسمح بتنفيذ أنظمة إدارة الجودة المتقدمة التي تستخدم تحليلات البيانات في الوقت الفعلي لتحسين عمليات الخدمة. يعمل هذا الاتجاه على تحسين رضا العملاء فضلاً عن دعم الشركات الصغيرة والمتوسطة الحجم في تحقيق إنتاجية أعلى وفعالية تشغيلية، مما يؤدي في النهاية إلى دفع استدامتها في السوق.
تقرير تحليلي لتجزئة سوق نظام إدارة طوابير الانتظار
إن القطاعات الرئيسية التي ساهمت في اشتقاق تحليل سوق نظام إدارة الطوابير هي النوع والمكونات والتطبيق.
- بناءً على النوع، ينقسم سوق نظام إدارة الطوابير إلى طوابير افتراضية وطوابير خطية. سيطر قطاع الطوابير الافتراضية على السوق في عام 2023.
- بناءً على المكون، ينقسم سوق نظام إدارة الطوابير إلى حلول وخدمات. احتل قطاع الحلول حصة أكبر من السوق في عام 2023.
- من حيث التطبيق، يتم تصنيف سوق نظام إدارة الطوابير إلى BFSI والمستشفيات ومنافذ البيع بالتجزئة والمطاعم ومقدمي خدمات المرافق والمطارات والمكاتب الحكومية وغيرها. هيمن قطاع منافذ البيع بالتجزئة على السوق في عام 2023.
تحليل حصة سوق نظام إدارة الطوابير حسب المنطقة الجغرافية
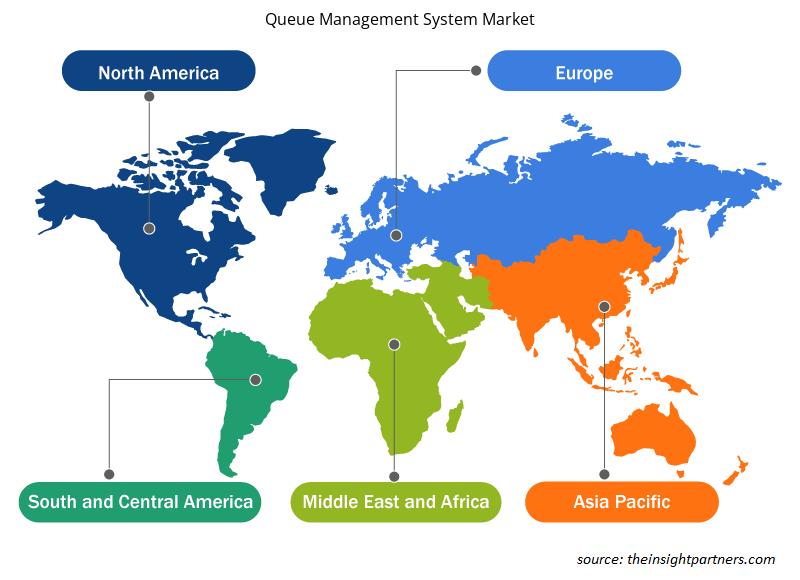
- تم تقسيم سوق نظام إدارة الطوابير إلى خمس مناطق رئيسية: أمريكا الشمالية وأوروبا وآسيا والمحيط الهادئ (APAC) والشرق الأوسط وأفريقيا (MEA) وأمريكا الجنوبية والوسطى. سيطرت أمريكا الشمالية على السوق في عام 2023، تليها أوروبا ومنطقة آسيا والمحيط الهادئ.
- سيطرت أمريكا الشمالية على سوق نظام إدارة الطوابير، تليها أوروبا ومنطقة آسيا والمحيط الهادئ. تتعلق هيمنة السوق في أمريكا الشمالية بشكل أساسي بوجود العديد من الصناعات الخاصة بالمستخدم النهائي. إن تطوير سوق نظام إدارة الطوابير في أمريكا الشمالية مدفوع بالاستخدام المتزايد في صناعات الرعاية الصحية والطيران والتجزئة. إن الاستثمار في صناعة الرعاية الصحية لتبني التقنيات المتقدمة ينمو بسرعة في جميع أنحاء المنطقة. وفقًا لشركة JAHANI AND ASSOCIATES LLC، في عام 2022، لاحظ قطاع الرعاية الصحية في الولايات المتحدة زيادة في أنشطة سوق رأس المال بسبب تأثير جائحة COVID-19. تلقت صناعة الرعاية الصحية استثمارًا بقيمة 110 مليار دولار أمريكي لتطوير التكنولوجيا لتحسين خدمات الرعاية الصحية. علاوة على ذلك، كانت حوالي 45٪ من المعاملات في صناعة الرعاية الصحية عبارة عن صفقات اندماج واستحواذ (M&A)، والتي قامت بها شركات لتطوير التكنولوجيا الحالية. إن توسع صناعة الرعاية الصحية بسبب زيادة عدد المرضى الذين يزورون المستشفيات يغذي نمو السوق في جميع أنحاء المنطقة. بالإضافة إلى ذلك، تتمتع أمريكا الشمالية بتركيز أعلى من مصنعي أجهزة ومطوري برامج أنظمة إدارة الطوابير، مما يتيح للمستخدمين النهائيين شراء الأنظمة من مجموعة متنوعة من المزودين. علاوة على ذلك، تكتسب سوق أنظمة إدارة الطوابير في كندا والمكسيك شعبية سريعة أيضًا، حيث يتزايد عدد مزودي الأنظمة وكذلك المستخدمين النهائيين باستمرار. وبالتالي، فإن معدل الشراء المتزايد يدفع سوق أنظمة إدارة الطوابير في أمريكا الشمالية إلى الأمام.
رؤى إقليمية حول سوق نظام إدارة الطوابير
لقد قام المحللون في Insight Partners بشرح الاتجاهات والعوامل الإقليمية المؤثرة على سوق نظام إدارة الطوابير طوال فترة التوقعات بشكل شامل. يناقش هذا القسم أيضًا قطاعات سوق نظام إدارة الطوابير والجغرافيا في جميع أنحاء أمريكا الشمالية وأوروبا ومنطقة آسيا والمحيط الهادئ والشرق الأوسط وأفريقيا وأمريكا الجنوبية والوسطى.
- احصل على البيانات الإقليمية المحددة لسوق نظام إدارة الطوابير
نطاق تقرير سوق نظام إدارة الطوابير
| سمة التقرير | تفاصيل |
|---|---|
| حجم السوق في عام 2023 | 748.18 مليون دولار أمريكي |
| حجم السوق بحلول عام 2031 | 1,331.48 مليون دولار أمريكي |
| معدل النمو السنوي المركب العالمي (2023 - 2031) | 7.5% |
| البيانات التاريخية | 2021-2022 |
| فترة التنبؤ | 2024-2031 |
| القطاعات المغطاة | حسب النوع
|
| المناطق والدول المغطاة | أمريكا الشمالية
|
| قادة السوق وملفات تعريف الشركات الرئيسية |
|
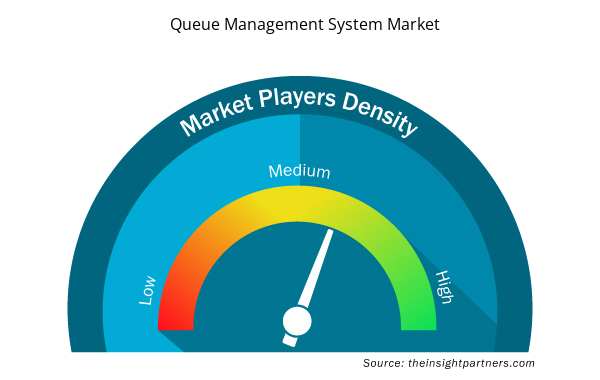
كثافة اللاعبين في السوق: فهم تأثيرها على ديناميكيات الأعمال
يشهد سوق أنظمة إدارة الطوابير نموًا سريعًا، مدفوعًا بالطلب المتزايد من المستخدم النهائي بسبب عوامل مثل تفضيلات المستهلكين المتطورة والتقدم التكنولوجي والوعي المتزايد بفوائد المنتج. ومع ارتفاع الطلب، تعمل الشركات على توسيع عروضها والابتكار لتلبية احتياجات المستهلكين والاستفادة من الاتجاهات الناشئة، مما يؤدي إلى زيادة نمو السوق.
تشير كثافة اللاعبين في السوق إلى توزيع الشركات أو المؤسسات العاملة في سوق أو صناعة معينة. وهي تشير إلى عدد المنافسين (اللاعبين في السوق) الموجودين في مساحة سوق معينة نسبة إلى حجمها أو قيمتها السوقية الإجمالية.
الشركات الرئيسية العاملة في سوق نظام إدارة الطوابير هي:
- مجموعة Q-MATIC AB
- شركة كيوميندر المحدودة
- شركة كيو نومي
- سكيبلينو
- وايفتيك
- شركة اوريون برو سوليوشنز المحدودة
إخلاء المسؤولية : الشركات المذكورة أعلاه ليست مرتبة بأي ترتيب معين.
- احصل على نظرة عامة على أهم اللاعبين الرئيسيين في سوق نظام إدارة الطوابير
أخبار سوق نظام إدارة الطوابير والتطورات الأخيرة
يتم تقييم سوق نظام إدارة الطوابير من خلال جمع البيانات النوعية والكمية بعد البحث الأولي والثانوي، والتي تتضمن منشورات الشركات المهمة وبيانات الجمعيات وقواعد البيانات. فيما يلي بعض التطورات في سوق نظام إدارة الطوابير:
- أعلنت شركة Advantech عن استحواذها على شركة Aures Technologies SA، وهي شركة فرنسية مشهورة بعلاماتها التجارية الخاصة بنقاط البيع وأجهزة الأكشاك. وتهدف هذه الخطوة الاستراتيجية إلى تعزيز التغطية العالمية لشركة Advantech في مجال منتجات وخدمات التجزئة الذكية، وتعزيز مكانتها بين مزودي حلول التجزئة الذكية الرائدين في جميع أنحاء العالم. (المصدر: Advantech، بيان صحفي، أبريل 2024)
- أعلنت شركة Wavetec عن توسيع شراكتها مع بنك البنجاب. حيث قام البنك بتثبيت 300 نظام إدارة طوابير (QMS) في جميع فروعه. (المصدر: Wavetec، بيان صحفي، يونيو 2024)
تقرير سوق نظام إدارة الطوابير والتغطية والنتائج المتوقعة
يوفر "حجم سوق نظام إدارة الطوابير والتوقعات (2021-2031)" تحليلاً مفصلاً للسوق يغطي المجالات المذكورة أدناه:
- حجم سوق نظام إدارة الطوابير وتوقعاته على المستويات العالمية والإقليمية والوطنية لجميع قطاعات السوق الرئيسية التي يغطيها النطاق
- اتجاهات سوق نظام إدارة الطوابير بالإضافة إلى ديناميكيات السوق مثل المحركات والقيود والفرص الرئيسية
- تحليل مفصل لـ PEST و SWOT
- تحليل سوق نظام إدارة الطوابير الذي يغطي اتجاهات السوق الرئيسية والإطار العالمي والإقليمي والجهات الفاعلة الرئيسية واللوائح والتطورات الأخيرة في السوق
- تحليل المشهد الصناعي والمنافسة الذي يغطي تركيز السوق، وتحليل خريطة الحرارة، واللاعبين البارزين، والتطورات الأخيرة لسوق نظام إدارة الطوابير
- ملفات تعريف الشركة التفصيلية

أنكيتا خبيرة ديناميكية في أبحاث السوق والاستشارات، تتمتع بخبرة تزيد عن 8 سنوات في قطاعات التكنولوجيا والإعلام وتكنولوجيا المعلومات والاتصالات والإلكترونيات وأشباه الموصلات. وقد قادت ونفذت بنجاح أكثر من 100 مهمة استشارية وبحثية لعملاء عالميين مثل مايكروسوفت وأوراكل وشركة NEC وSAP وKPMG وExpeditors International. تشمل كفاءاتها الأساسية تقييم السوق، وتحليل البيانات، والتنبؤ، وصياغة الاستراتيجيات، والاستخبارات التنافسية، وكتابة التقارير.
أنكيتا بارعة في إدارة دورات المشاريع الكاملة، بدءًا من تصميم عروض ما قبل البيع ومناقشات العملاء، وصولًا إلى تقديم رؤى عملية بعد البيع. كما أنها ماهرة في إدارة فرق متعددة الوظائف، وهيكلة وحدات بحثية معقدة، ومواءمة الحلول مع أهداف العمل الخاصة بالعملاء. وقد مكنتها مهاراتها الممتازة في التواصل والقيادة والعرض التقديمي من تحقيق نتائج قيّمة باستمرار في بيئات سوقية سريعة التطور.
- التحليل التاريخي (سنتان)، سنة الأساس، التوقعات (7 سنوات) مع معدل النمو السنوي المركب
- تحليل PEST و SWOT
- حجم السوق والقيمة / الحجم - عالمي، إقليمي، بلد
- الصناعة والمنافسة
- مجموعة بيانات إكسل
التقارير الحديثة
تقارير ذات صلة
شهادات العملاء
تقرير سوق أنظمة SCADA من Insight Partners شامل، ويقدم رؤى قيّمة حول الاتجاهات الحالية والتوقعات المستقبلية. تميّز الفريق باحترافية عالية وسرعة في الاستجابة ودعم مستمر طوال الوقت. نحن راضون جدًا ونوصي بشدة بخدماتهم.
ران كيديم شريك, شركة ريالي تكنولوجيز المحدودةطلبتُ تقريرًا عن سوق برمجيات محدد، وأعدّه الفريق في غضون أيام قليلة. كانت المعلومات ذات صلة وثيقة وعرضها جيد. ثم طلبتُ بعض التعديلات والإضافات على التقرير. وكان الفريق متجاوبًا للغاية، وحصلتُ على التقرير النهائي في أقل من أسبوع.
جان هيرفيه جين رئيس مجلس الإدارة, فيوتشر أناليتيكاعملنا مع شركة "إنسايت بارتنرز" لإجراء دراسة سوقية وتوقعات مهمة. زودونا برؤى واضحة حول الفرص والمخاطر، مما ساعدنا في صياغة خططنا. كانت أبحاثهم سهلة الاستخدام ومبنية على بيانات دقيقة، مما ساعدنا على اتخاذ قرارات ذكية وواثقة. نوصي بهم بشدة.
بيوش ناجبال نائب الرئيس الأول, شعاع عالي عالميقدّمت شركة Insight Partners أبحاثًا سوقية ثاقبة ومنظمة جيدًا بخبرة واسعة في هذا المجال. تميّز فريقهم بالاحترافية وسرعة الاستجابة طوال الوقت. وسهّل موقعهم الإلكتروني سهل الاستخدام الوصول إلى تقارير القطاع. نوصي بهم بشدة لخدمات بحثية موثوقة وعالية الجودة.
يوكيهيكو أداتشي المدير التنفيذي, ديب بلو، ذ.م.م.هذه أول مرة أشتري فيها تقرير سوق من The Insight Partners. رغم أنني كنت مترددًا في البداية، إلا أنني زرت موقعهم الإلكتروني وشعرت براحة أكبر للمخاطرة وشراء تقرير السوق. أنا راضٍ تمامًا عن جودة التقرير وخدمة العملاء. كانت لديّ عدة أسئلة وتعليقات حول التقرير الأولي، ولكن بعد بضع محادثات عبر البريد الإلكتروني مع محللهم، أعتقد أن لديّ تقريرًا يمكنني استخدامه كمدخل لعملية التخطيط الاستراتيجي لدينا. شكرًا جزيلاً لكم على تخصيص وقتكم الإضافي وجعل هذه التجربة إيجابية. سأوصي بخدماتكم للآخرين بالتأكيد، وستكونون أول من ألجأ إليه عندما نحتاج إلى المزيد من بيانات السوق.
جون سوزوكي الرئيس والرئيس التنفيذي وعضو مجلس الإدارة, بي كيه تكنولوجيزأود أن أقدّر دعمكم واحترافيتكم في الاستجابة لطلبي للحصول على معلومات بشأن سوق التشخيص المخبري للأمراض المعدية في نيجيريا. كما أُقدّر صبركم وتوجيهكم، واستعدادكم لتقديم خصم، مما مكّننا في النهاية من إتمام الصفقة. أتطلع إلى التعامل مع "ذا إنسايت بارتنرز" مستقبلًا، كل ذلك بفضل الانطباع الذي تركتموه لديّ نتيجةً لهذا اللقاء الأول.
الدكتور تشيجيوك أونيا المدير الإداري, شركة باينكريست للرعاية الصحية المحدودةسبب الشراء
- اتخاذ قرارات مدروسة
- فهم ديناميكيات السوق
- تحليل المنافسة
- رؤى العملاء
- توقعات السوق
- تخفيف المخاطر
- التخطيط الاستراتيجي
- مبررات الاستثمار
- تحديد الأسواق الناشئة
- تحسين استراتيجيات التسويق
- تعزيز الكفاءة التشغيلية
- مواكبة التوجهات التنظيمية


 احصل على عينة مجانية ل - سوق نظام إدارة الطوابير