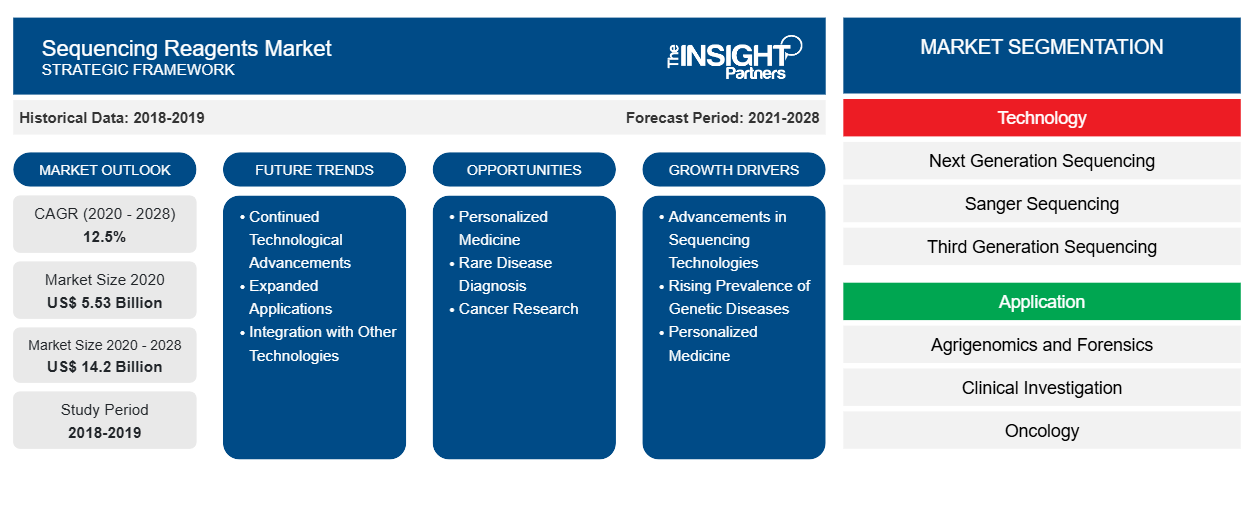
بلغت قيمة سوق كواشف التسلسل 5،530.32 مليون دولار أمريكي في عام 2020 ومن المتوقع أن تصل إلى 14،195.60 مليون دولار أمريكي بحلول عام 2028؛ ومن المتوقع أن تنمو بمعدل نمو سنوي مركب قدره 12.5٪ من عام 2020 إلى عام 2028.
تُستخدم كواشف التسلسل أثناء عملية التسلسل. ويعتمد استخدام هذه الكواشف بشكل كبير على النتيجة المرجوة التي يجب الحصول عليها. وتشكل جزءًا أساسيًا من تفاعلات التسلسل، والتي يمكن استخدامها في تطبيقات أخرى مختلفة أيضًا. ومن المتوقع أن يؤدي زيادة أنشطة البحث والتطوير في جميع أنحاء العالم إلى دفع نمو السوق خلال فترة التنبؤ.
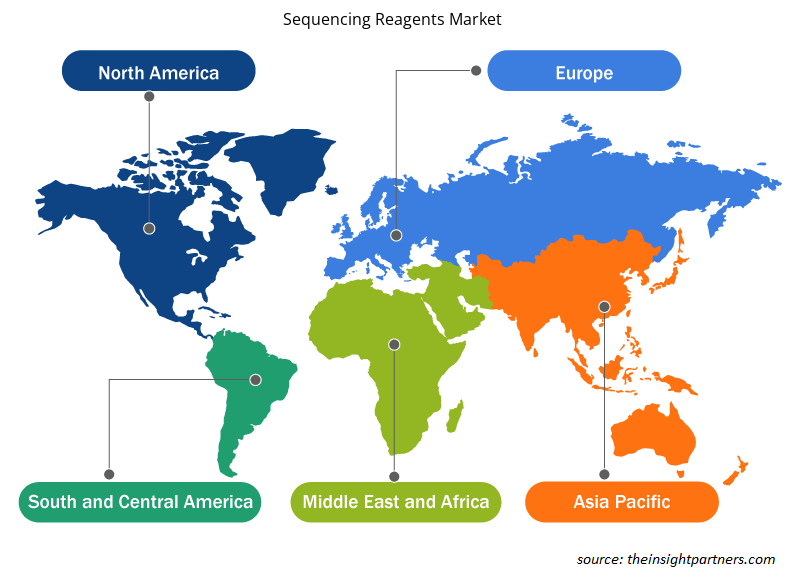
يتم تقسيم سوق كواشف التسلسل على أساس نوع الكواشف والتكنولوجيا والتطبيق والمستخدم النهائي والجغرافيا. من خلال الجغرافيا، يتم تقسيم السوق إلى أمريكا الشمالية وأوروبا وآسيا والمحيط الهادئ والشرق الأوسط وأفريقيا وأمريكا الجنوبية والوسطى. يقدم التقرير رؤى وتحليلات متعمقة لسوق كواشف التسلسل، مع التركيز على معايير مثل اتجاهات السوق والتقدم التكنولوجي وديناميكيات السوق جنبًا إلى جنب مع تحليل المشهد التنافسي للاعبين الرائدين في السوق في العالم.
قم بتخصيص هذا التقرير ليناسب متطلباتك
ستحصل على تخصيص لأي تقرير - مجانًا - بما في ذلك أجزاء من هذا التقرير، أو تحليل على مستوى الدولة، وحزمة بيانات Excel، بالإضافة إلى الاستفادة من العروض والخصومات الرائعة للشركات الناشئة والجامعات
سوق كواشف التسلسل:
- احصل على أهم اتجاهات السوق الرئيسية لهذا التقرير.ستتضمن هذه العينة المجانية تحليلاً للبيانات، بدءًا من اتجاهات السوق وحتى التقديرات والتوقعات.
رؤى السوق
قبل خمس سنوات، كان التسلسل الجينومي مقتصرًا على بيئة البحث. أما الآن، فهو يستخدم بشكل متزايد في الممارسة السريرية، ومن المتوقع أن يتم توليد البيانات الجينومية لأكثر من 60 مليون مريض في مجال الرعاية الصحية على مدى السنوات الخمس المقبلة. ويتحول التسلسل الجينومي بسرعة إلى الممارسة السريرية، وقد تم دعم التنفيذ في أنظمة الرعاية الصحية من خلال استثمار حكومي كبير، بلغ إجماليه أكثر من 4 مليارات دولار أمريكي في 14 دولة على الأقل. وتدفع مبادرات الطب الجينومي الوطنية هذه التغيير التحويلي في ظل ظروف الحياة الواقعية بينما تعالج في الوقت نفسه الحواجز التي تحول دون التنفيذ وجمع الأدلة من أجل التبني الأوسع، وبالتالي دفع نمو السوق.
أعلنت المملكة المتحدة عن أكبر مشروع جينوم في العالم كجزء من تعاون بين القطاعين العام والخاص بقيمة 200 مليون دولار بين الجمعيات الخيرية وشركات الأدوية . وقد طورت المملكة المتحدة بالفعل أكبر قاعدة بيانات جينوم في العالم من خلال مشروع 100000 جينوم. بقيادة Innovate UK كجزء من البحث والابتكار في المملكة المتحدة، سيمول المشروع الباحثين والصناعة للجمع بين البيانات والأدلة الواقعية من الخدمات الصحية في المملكة المتحدة وإنشاء منتجات وخدمات جديدة لتشخيص الأمراض في وقت مبكر وبكفاءة أكبر.
في نوفمبر 2018، أعلنت Stilla Technologies أنها أكملت جولة تمويل من الفئة A بقيمة 18.3 مليون دولار أمريكي (16 مليون يورو) بقيادة Illumina Ventures. ستستخدم الشركة الأموال لتسويق نظام تفاعل البوليميراز المتسلسل الرقمي Naica وتطوير التطبيقات السريرية.
في أغسطس 2018، أعلنت شركة بوسطن، ومقرها ماساتشوستس، أنها حصلت على 4.3 مليون دولار أمريكي في تمويل أولي، وستشترك مع شركة فيريتاس جينيتكس، وهي شركة تسلسل الجينوم. ستدعم الأموال مهمة الشركة في إدخال عصر تسلسل الجينوم الشخصي من خلال إنشاء سوق موثوق وآمن ولامركزي للبيانات الجينومية .
في أبريل 2020، أعلنت شركة ميدجينوم -وهي شركة تشخيص وأبحاث وبيانات وراثية مقرها بنغالورو- أنها جمعت 55 مليون دولار أمريكي (حوالي 419 كرور روبية هندية ) في جولة جديدة من التمويل، بقيادة شركة الاستثمار العالمية ليب فروغ إنفستمنتس. كما تدعي ميدجينوم أنها بنت أكبر قاعدة بيانات للمتغيرات الجينية في جنوب آسيا في التشخيص الجيني في الهند والشراكات البحثية. وقد أكملت أكثر من 200000 اختبار جينومي حتى الآن وحصلت على عينات من أكثر من 550 مستشفى و6000 طبيب في جميع أنحاء الهند.
وبالتالي، وبفضل التمويل المستمر من قبل الشركات المصنعة والحكومة في مجال علم الجينوم، فمن المتوقع أن يشهد سوق كواشف التسلسل نموًا خلال الفترة المتوقعة.
انخفاض تكلفة إجراءات التسلسل يساهم بشكل كبير في نمو السوق
لقد انخفضت تكلفة تسلسل الجينوم بشكل جذري، بما يقرب من مليون ضعف في السنوات الست أو السبع الماضية. وفي السنوات الأخيرة، انخفضت أسعار تسلسل الجيل التالي بشكل كبير. على سبيل المثال، بلغت تكلفة تسلسل الجينوم البشري الكامل الأول أكثر من 3.7 مليار دولار أمريكي في عام 2000 واستغرق إكماله أكثر من عقد من الزمان. ومع ذلك، انخفضت تكاليف نفس الشيء في السنوات الأخيرة إلى 1000 دولار أمريكي وتتطلب العملية عددًا أقل من الأيام. في عام 2000، كانت تكلفة التسلسل 3.7 مليار دولار أمريكي، وانخفضت إلى 10 ملايين دولار أمريكي في عام 2006 وانخفضت إلى 5000 دولار أمريكي في عام 2012. ويمكن التحقق من انخفاض التكلفة من خلال تكلفة تسلسل الجينوم التي انحدرت بشكل كبير حوالي عام 2008، حيث انخفضت من حوالي 10 ملايين دولار أمريكي إلى ما يقرب من 1000 دولار أمريكي في الوقت الحاضر.
إن العديد من خدمات الاختبار تكلف بضع مئات من الدولارات، والتكلفة المنخفضة والسرعة العالية لا يمكن أن تمنحهم هامشًا أكبر في الأرباح فحسب، بل والقدرة على المعالجة بشكل أسرع وربما جلب حمولة أكبر من المستهلكين. أحدث الأجهزة التي تقدمها Illumina هي أجهزة منخفضة السعر ومتوفرة في طرازين - NovaSeq 5000 مقابل 850.000 دولار أمريكي و NovaSeq 6000 مقابل 985.000 دولار أمريكي.
ساعد الانخفاض السريع في التكاليف الآن في البحث السريري، ولكن السرعة الأكبر ونقطة السعر المنخفضة من المرجح أن تغري الشركات الناشئة في مجال الصحة لمساعدة المستهلكين. في عام 2003، كلف أول تسلسل للجينوم البشري بالكامل حوالي 2.7 مليار دولار أمريكي؛ ومع ذلك، أطلقت شركة تسلسل الحمض النووي Illumina أحدث جهاز متقدم لتسلسل الجينوم الكامل، بتكلفة أقل من 100 دولار أمريكي. كان سعر تسلسل الجينوم في هبوط حر مستمر منذ التأسيس. في عام 2006، بلغت تكلفة أول آلة لشركة Illumina ، والتي استُخدمت في تسلسل الجينوم البشري، 300 ألف دولار أمريكي، وفي عام 2014، كشفت الشركة أن تكلفة نفس التسلسل قد انخفضت إلى 1000 دولار أمريكي. وقد قدم كبار اللاعبين في السوق مثل Illumina وRoche تقنيات رائدة مكنت من خفض التكلفة والوقت في التسلسل.
في عام 2003، بدأ اتحاد تسلسل الجينوم البشري الدولي تحليل الجينوم من خلال تسلسل جينوم بشري كامل. بلغت تكلفة التسلسل حوالي 2.6 مليار دولار أمريكي (2.3 مليار يورو). وبحلول عام 2008، انخفضت التكاليف إلى أقل من 1.4 مليون دولار أمريكي (مليون يورو) لكل جينوم. كما أصبحت تكلفة تسلسل الإكسوم أرخص. تبلغ تكلفة تسلسل الإكسوم من 400 إلى 500 دولار أمريكي ، وتسلسل الجينوم من 1000 إلى 1200 دولار أمريكي. وبسبب عوامل مثل التقدم في مجال الجينوم، والتطور في أساليب واستراتيجيات مختلفة للتسلسل، هناك انخفاض ملحوظ في تكلفة التسلسل.
رؤى التكنولوجيا
بناءً على التكنولوجيا، يتم تقسيم سوق كواشف التسلسل العالمية إلى تسلسل الجيل التالي، وتسلسل سانجر، وتسلسل الجيل الثالث. في عام 2020، احتل قطاع تسلسل الجيل التالي الحصة الأكبر في السوق. علاوة على ذلك، من المتوقع أن ينمو سوق نفس القطاع بأعلى معدل بحلول عام 2028. تسلسل الجيل التالي هو تقنية توفر فك تشفير متوازي ضخم لشظايا الحمض النووي الريبي أو الحمض النووي، بناءً على مبادئ تسلسل الجزيء الفردي أو التسلسل عن طريق التخليق. إنه ينتج كميات هائلة من بيانات التسلسل، والتي لا يمكن تحليلها إلا باستخدام أدوات المعلوماتية الحيوية المخصصة. من المرجح أن يعزز هذا العامل الطلب على كواشف التسلسل في جميع أنحاء العالم خلال فترة التنبؤ
رؤى حول نوع الكواشف
بناءً على نوع الكاشف، يتم تقسيم سوق كواشف التسلسل العالمية إلى مجموعات التحكم ومجموعات المكتبة ومجموعات القوالب ومجموعات التسلسل وأنواع الكواشف الأخرى. احتل قطاع مجموعات التحكم أكبر حصة في السوق في عام 2020، ومن المتوقع أن يهيمن على السوق بحلول عام 2028. توفر مجموعات التحكم التحكم في الجودة لتوليد المجموعة والتسلسل والمحاذاة، بالإضافة إلى التحكم في المعايرة لتوليد مصفوفة التداخل والتدريج والتدريج المسبق.
رؤى التطبيق
بناءً على التطبيق، يتم تقسيم سوق كواشف التسلسل العالمية إلى علم الجينوم الزراعي والطب الشرعي والتحقيق السريري وعلم الأورام والصحة الإنجابية وتطبيقات أخرى. احتل قطاع الأورام أكبر حصة سوقية في عام 2020، ومن المتوقع أن يهيمن على السوق بحلول عام 2028. إن الجمع بين أدوات التسلسل من الجيل التالي (NGS) والمعلوماتية الحيوية لديه القدرة على تحويل أبحاث الأورام والتشخيص والعلاج.
رؤى المستخدم النهائي
بناءً على المستخدم النهائي، يتم تقسيم سوق كواشف التسلسل العالمية إلى المستشفيات والعيادات ومعاهد الأبحاث وشركات الأدوية والتكنولوجيا الحيوية وغيرها. احتل قطاع المستشفيات والعيادات أكبر حصة في السوق في عام 2020، ومن المتوقع أن يهيمن على السوق بحلول عام 2028. المستشفيات والعيادات هي نقاط الاتصال الأساسية للمرضى لإجراء التشخيص واختيار خيارات العلاج والبدائل.
تعد عمليات إطلاق المنتجات والاندماج والاستحواذ من الاستراتيجيات المعتمدة على نطاق واسع من قبل اللاعبين العاملين في سوق الكواشف التسلسلية العالمية. فيما يلي بعض التطورات الرئيسية الأخيرة في المنتجات:
في أبريل 2021، أطلقت شركة QIAGEN NV مجموعة QIAseq DIRECT SARS-CoV-2 Kit، وهي عبارة عن حل لإثراء الجينوم الفيروسي وإعداد المكتبة يقلل بشكل كبير من أوقات استجابة المكتبة واستخدام البلاستيك مقارنة ببروتوكولات مشروع ARTIC [نهج قائمة على البادئ للتسلسل الجيني من الجيل التالي (NGS)].
في ديسمبر 2018، وقعت شركة Abcam plc، وهي شركة عالمية مبتكرة في مجال الكواشف والأدوات الخاصة بعلوم الحياة، وشركة QIAGEN (Suzhou) Translational Medicine Co., Ltd. (QIAGEN (Suzhou)) مذكرة تفاهم لتطوير خط أنابيب من الكواشف والأدوات التشخيصية المرافقة (CDx) والتشخيص المخبري لتلبية الاحتياجات المحددة للسوق الصينية.
كان لجائحة كوفيد-19 تأثير إيجابي على سوق كواشف التسلسل. فقد طورت العديد من شركات الأدوية لقاحًا لكوفيد-19، كما بدأت عمليات التطعيم في معظم البلدان. وأصبح تسلسل الجينوم أداة مهمة بشكل متزايد لدراسة تفشي الأمراض، ومن المتوقع أن يكون له تأثير إيجابي على قطاعات أخرى من السوق في الأشهر المقبلة. ومن ناحية أخرى، تعمل الاضطرابات في سلسلة التوريد الناجمة عن توقف العمليات العالمية على إعاقة نمو السوق.
رؤى إقليمية حول سوق كواشف التسلسل
لقد قام المحللون في Insight Partners بشرح الاتجاهات والعوامل الإقليمية المؤثرة على سوق كواشف التسلسل طوال فترة التوقعات بشكل شامل. يناقش هذا القسم أيضًا قطاعات سوق كواشف التسلسل والجغرافيا في جميع أنحاء أمريكا الشمالية وأوروبا ومنطقة آسيا والمحيط الهادئ والشرق الأوسط وأفريقيا وأمريكا الجنوبية والوسطى.
- احصل على البيانات الإقليمية المحددة لسوق كواشف التسلسل
نطاق تقرير سوق كواشف التسلسل
| سمة التقرير | تفاصيل |
|---|---|
| حجم السوق في عام 2020 | 5.53 مليار دولار أمريكي |
| حجم السوق بحلول عام 2028 | 14.2 مليار دولار أمريكي |
| معدل النمو السنوي المركب العالمي (2020 - 2028) | 12.5% |
| البيانات التاريخية | 2018-2019 |
| فترة التنبؤ | 2021-2028 |
| القطاعات المغطاة | حسب التكنولوجيا
|
| المناطق والدول المغطاة | أمريكا الشمالية
|
| قادة السوق وملفات تعريف الشركات الرئيسية |
|
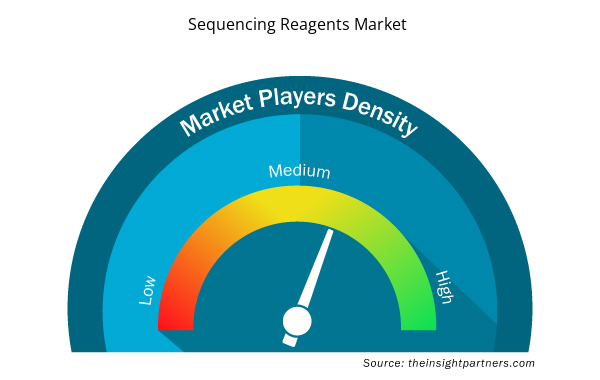
كثافة اللاعبين في السوق: فهم تأثيرها على ديناميكيات الأعمال
يشهد سوق كواشف التسلسل نموًا سريعًا، مدفوعًا بالطلب المتزايد من المستخدم النهائي بسبب عوامل مثل تفضيلات المستهلك المتطورة والتقدم التكنولوجي والوعي المتزايد بفوائد المنتج. ومع ارتفاع الطلب، تعمل الشركات على توسيع عروضها والابتكار لتلبية احتياجات المستهلكين والاستفادة من الاتجاهات الناشئة، مما يؤدي إلى زيادة نمو السوق.
تشير كثافة اللاعبين في السوق إلى توزيع الشركات أو المؤسسات العاملة في سوق أو صناعة معينة. وهي تشير إلى عدد المنافسين (اللاعبين في السوق) الموجودين في مساحة سوق معينة نسبة إلى حجمها أو قيمتها السوقية الإجمالية.
الشركات الرئيسية العاملة في سوق كواشف التسلسل هي:
- مجموعة بي جي آي
- شركة ف. هوفمان-لاروش المحدودة
- شركة فلويديجم
- شركة إيلومينا
- تكنولوجيا البحث الحيوي LGC
إخلاء المسؤولية : الشركات المذكورة أعلاه ليست مرتبة بأي ترتيب معين.
- احصل على نظرة عامة على أهم اللاعبين الرئيسيين في سوق كواشف التسلسل
كواشف التسلسل – تقسيم السوق
حسب التكنولوجيا
- تسلسل الجيل القادم
- تسلسل سانجر
- تسلسل الجيل الثالث
حسب نوع الكاشف
- أطقم التحكم
- مجموعات المكتبة
- مجموعات القوالب
- مجموعات التسلسل
- أنواع الكواشف الأخرى
حسب الطلب
- الزراعة الجينومية والطب الشرعي
- التحقيق السريري
- علم الأورام
- الصحة الإنجابية
- تطبيقات أخرى
حسب المستخدم النهائي
- المستشفيات والعيادات
- معاهد البحوث
- شركات الأدوية والتكنولوجيا الحيوية
- المستخدمون النهائيون الآخرون
حسب الجغرافيا
أمريكا الشمالية
- نحن
- كندا
- المكسيك
أوروبا
- فرنسا
- ألمانيا
- المملكة المتحدة
- إيطاليا
- إسبانيا
- بقية أوروبا
آسيا والمحيط الهادئ (APAC)
- الصين
- اليابان
- الهند
- أستراليا
- كوريا الجنوبية
- بقية آسيا والمحيط الهادئ
الشرق الأوسط وأفريقيا
- المملكة العربية السعودية
- جنوب أفريقيا
- الامارات العربية المتحدة
- بقية الشرق الأوسط وأفريقيا
أمريكا الجنوبية والوسطى (SCAM)
- البرازيل
- الأرجنتين
- بقية أمريكا الجنوبية والوسطى
نبذة عن الشركة
- مجموعة بي جي آي
- شركة ف. هوفمان-لاروش المحدودة
- شركة فلويديجم
- شركة إيلومينا
- تكنولوجيا البحث الحيوي LGC
- علوم المحيط الهادئ البيولوجية في كاليفورنيا، المحدودة
- كياجن
- شركة تاكارا بيو
- شركة ثيرمو فيشر العلمية
- تريلينك للتكنولوجيا الحيوية
- التحليل التاريخي (سنتان)، السنة الأساسية، التوقعات (7 سنوات) مع معدل النمو السنوي المركب
- تحليل PEST و SWOT
- حجم السوق والقيمة / الحجم - عالميًا وإقليميًا وقطريًا
- الصناعة والمنافسة
- مجموعة بيانات Excel


Report Coverage
Revenue forecast, Company Analysis, Industry landscape, Growth factors, and Trends

Segment Covered
This text is related
to segments covered.

Regional Scope
North America, Europe, Asia Pacific, Middle East & Africa, South & Central America

Country Scope
This text is related
to country scope.
الأسئلة الشائعة
The sequencing reagents market majorly consists of the players such BGI Group, F. Hoffmann-La Roche Ltd., Fluidigm Corporation, Illumina, Inc., LGC Biosearch Technologies, Pacific Biosciences of California, Inc., Qiagen, Takara Bio, Inc., Thermo Fisher Scientific, Inc., and Trilink Biotechnologies among others.
The factors that are driving growth of the market are growing funding for genomics, declining cost of sequencing procedures and increasing prevalence of chronic diseases are anticipated to drive the growth of the global sequencing reagents market during the forecast period. However, dearth of skilled professionals is hindering the market growth.
Sequencing reagents are used during the process of sequencing. The use of these reagents highly depends on the desired result to be obtained. They form an essential part of the sequencing reactions, which can be used across various other applications as well. An increase in R&D activities worldwide is expected to drive the growth of the market during the forecast period.
The List of Companies - Sequencing Reagents Market
- BGI Group
- F. Hoffmann-La Roche Ltd.
- Fluidigm Corporation
- Illumina, Inc.
- LGC Biosearch Technologies
- Pacific Biosciences of California, Inc.
- Qiagen
- Takara Bio, Inc.
- Thermo Fisher Scientific, Inc.
- Trilink Biotechnologies


The Insight Partners performs research in 4 major stages: Data Collection & Secondary Research, Primary Research, Data Analysis and Data Triangulation & Final Review.
- Data Collection and Secondary Research:
As a market research and consulting firm operating from a decade, we have published and advised several client across the globe. First step for any study will start with an assessment of currently available data and insights from existing reports. Further, historical and current market information is collected from Investor Presentations, Annual Reports, SEC Filings, etc., and other information related to company’s performance and market positioning are gathered from Paid Databases (Factiva, Hoovers, and Reuters) and various other publications available in public domain.
Several associations trade associates, technical forums, institutes, societies and organization are accessed to gain technical as well as market related insights through their publications such as research papers, blogs and press releases related to the studies are referred to get cues about the market. Further, white papers, journals, magazines, and other news articles published in last 3 years are scrutinized and analyzed to understand the current market trends.
- Primary Research:
The primarily interview analysis comprise of data obtained from industry participants interview and answers to survey questions gathered by in-house primary team.
For primary research, interviews are conducted with industry experts/CEOs/Marketing Managers/VPs/Subject Matter Experts from both demand and supply side to get a 360-degree view of the market. The primary team conducts several interviews based on the complexity of the markets to understand the various market trends and dynamics which makes research more credible and precise.
A typical research interview fulfils the following functions:
- Provides first-hand information on the market size, market trends, growth trends, competitive landscape, and outlook
- Validates and strengthens in-house secondary research findings
- Develops the analysis team’s expertise and market understanding
Primary research involves email interactions and telephone interviews for each market, category, segment, and sub-segment across geographies. The participants who typically take part in such a process include, but are not limited to:
- Industry participants: VPs, business development managers, market intelligence managers and national sales managers
- Outside experts: Valuation experts, research analysts and key opinion leaders specializing in the electronics and semiconductor industry.
Below is the breakup of our primary respondents by company, designation, and region:

Once we receive the confirmation from primary research sources or primary respondents, we finalize the base year market estimation and forecast the data as per the macroeconomic and microeconomic factors assessed during data collection.
- Data Analysis:
Once data is validated through both secondary as well as primary respondents, we finalize the market estimations by hypothesis formulation and factor analysis at regional and country level.
- Macro-Economic Factor Analysis:
We analyse macroeconomic indicators such the gross domestic product (GDP), increase in the demand for goods and services across industries, technological advancement, regional economic growth, governmental policies, the influence of COVID-19, PEST analysis, and other aspects. This analysis aids in setting benchmarks for various nations/regions and approximating market splits. Additionally, the general trend of the aforementioned components aid in determining the market's development possibilities.
- Country Level Data:
Various factors that are especially aligned to the country are taken into account to determine the market size for a certain area and country, including the presence of vendors, such as headquarters and offices, the country's GDP, demand patterns, and industry growth. To comprehend the market dynamics for the nation, a number of growth variables, inhibitors, application areas, and current market trends are researched. The aforementioned elements aid in determining the country's overall market's growth potential.
- Company Profile:
The “Table of Contents” is formulated by listing and analyzing more than 25 - 30 companies operating in the market ecosystem across geographies. However, we profile only 10 companies as a standard practice in our syndicate reports. These 10 companies comprise leading, emerging, and regional players. Nonetheless, our analysis is not restricted to the 10 listed companies, we also analyze other companies present in the market to develop a holistic view and understand the prevailing trends. The “Company Profiles” section in the report covers key facts, business description, products & services, financial information, SWOT analysis, and key developments. The financial information presented is extracted from the annual reports and official documents of the publicly listed companies. Upon collecting the information for the sections of respective companies, we verify them via various primary sources and then compile the data in respective company profiles. The company level information helps us in deriving the base number as well as in forecasting the market size.
- Developing Base Number:
Aggregation of sales statistics (2020-2022) and macro-economic factor, and other secondary and primary research insights are utilized to arrive at base number and related market shares for 2022. The data gaps are identified in this step and relevant market data is analyzed, collected from paid primary interviews or databases. On finalizing the base year market size, forecasts are developed on the basis of macro-economic, industry and market growth factors and company level analysis.
- Data Triangulation and Final Review:
The market findings and base year market size calculations are validated from supply as well as demand side. Demand side validations are based on macro-economic factor analysis and benchmarks for respective regions and countries. In case of supply side validations, revenues of major companies are estimated (in case not available) based on industry benchmark, approximate number of employees, product portfolio, and primary interviews revenues are gathered. Further revenue from target product/service segment is assessed to avoid overshooting of market statistics. In case of heavy deviations between supply and demand side values, all thes steps are repeated to achieve synchronization.
We follow an iterative model, wherein we share our research findings with Subject Matter Experts (SME’s) and Key Opinion Leaders (KOLs) until consensus view of the market is not formulated – this model negates any drastic deviation in the opinions of experts. Only validated and universally acceptable research findings are quoted in our reports.
We have important check points that we use to validate our research findings – which we call – data triangulation, where we validate the information, we generate from secondary sources with primary interviews and then we re-validate with our internal data bases and Subject matter experts. This comprehensive model enables us to deliver high quality, reliable data in shortest possible time.
 احصل على عينة مجانية لهذا التقرير