استراتيجيات السوق العاكسون للطاقة الشمسية، وأفضل اللاعبين، وفرص النمو، والتحليل والتنبؤ بحلول عام 2031
البيانات التاريخية : 2021-2022 | سنة الأساس : 2023 | فترة التنبؤ : 2024-2031حجم سوق العاكسات الشمسية وتوقعاته (2021-2031)، والحصة العالمية والإقليمية، والاتجاهات، وفرص النمو. يغطي التقرير: حسب النوع (مركزي، وسلسلة، وصغير)، ونوع النظام (داخل الشبكة وخارجها)، والمستخدم النهائي (سكني، وتجاري، وخدمي)، والموقع الجغرافي.
- تاريخ التقرير : Mar 2026
- رمز التقرير : TIPRE00009372
- الفئة : الإلكترونيات وأشباه الموصلات
- الحالة : البيانات الصادرة
- تنسيقات التقارير المتاحة :


- عدد الصفحات : 150
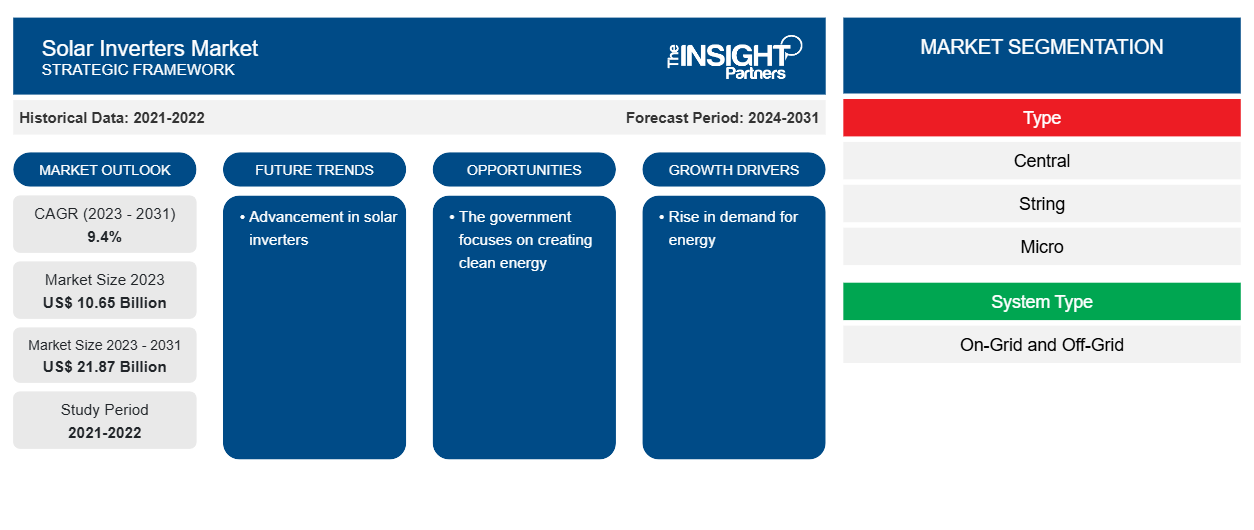
من المتوقع أن يصل حجم سوق العاكسات الشمسية إلى 21.87 مليار دولار أمريكي بحلول عام 2031 من 10.65 مليار دولار أمريكي في عام 2023. ومن المتوقع أن يسجل السوق معدل نمو سنوي مركب بنسبة 9.4٪ خلال الفترة 2023-2031. ومن المرجح أن تظل الحاجة المتزايدة إلى حلول الطاقة النظيفة والزيادة في المبادرات الحكومية لتثبيت العاكسات الشمسية من الاتجاهات الرئيسية في السوق.
تحليل سوق العاكسات الشمسية
إن ارتفاع الاستثمار في الطاقة الشمسية هو أحد العوامل الرئيسية التي تغذي سوق العاكسات الشمسية. على سبيل المثال، في أبريل 2024، أعلنت وزارة الداخلية الأمريكية عن استثمار بقيمة 19 مليون دولار أمريكي من أجندة الرئيس بايدن للاستثمار في أمريكا لتثبيت الألواح الشمسية فوق قنوات الري في كاليفورنيا وأوريجون ويوتا، مما يقلل في الوقت نفسه من تبخر إمدادات المياه الحرجة وتعزيز أهداف الطاقة النظيفة. بالإضافة إلى ذلك، فإن التثبيت المتزايد لتكنولوجيا الطاقة الشمسية على الأسطح في القطاع السكني يدفع نمو السوق. كما تعمل الحكومة على دعم تركيب تكنولوجيا الطاقة الشمسية على تعزيز نمو سوق العاكسات الشمسية.
نظرة عامة على سوق العاكسات الشمسية
العاكس الشمسي، المعروف أيضًا باسم العاكس الكهروضوئي
(
العاكس الكهروضوئي هو نوع من العاكسات التي تستمد الطاقة من ضوء الشمس. فهو يحول التيار المستمر الكهروضوئي المتغير إلى تيار متردد يوفر الطاقة للشبكة الكهربائية التجارية أو يستخدمه شبكة كهربائية محلية خارج الشبكة. تزداد الحاجة إلى الطاقة النظيفة في جميع أنحاء العالم لتقليل التأثيرات البيئية السلبية. يعزز هذا العامل الطلب على الطاقة الشمسية، مما يزيد من تغذية سوق العاكسات الشمسية.
قم بتخصيص هذا التقرير ليناسب متطلباتك
ستحصل على تخصيص لأي تقرير - مجانًا - بما في ذلك أجزاء من هذا التقرير، أو تحليل على مستوى الدولة، وحزمة بيانات Excel، بالإضافة إلى الاستفادة من العروض والخصومات الرائعة للشركات الناشئة والجامعات
سوق العاكسات الشمسية: رؤى استراتيجية
-
احصل على أهم اتجاهات السوق الرئيسية لهذا التقرير.ستتضمن هذه العينة المجانية تحليلاً للبيانات، بدءًا من اتجاهات السوق وحتى التقديرات والتوقعات.
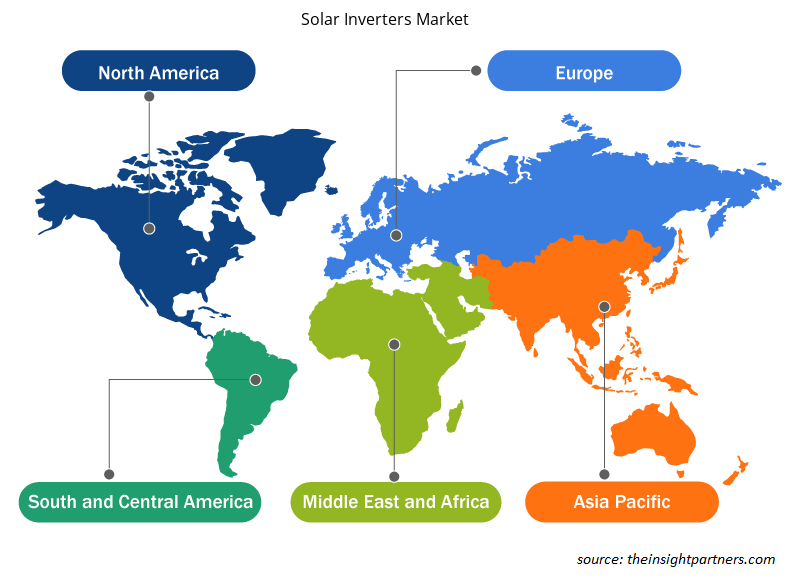
نظرة إقليمية على سوق العاكسات الشمسية
لقد قام المحللون في Insight Partners بشرح الاتجاهات والعوامل الإقليمية المؤثرة على سوق العاكسات الشمسية طوال فترة التوقعات بشكل شامل. يناقش هذا القسم أيضًا قطاعات سوق العاكسات الشمسية والجغرافيا في جميع أنحاء أمريكا الشمالية وأوروبا ومنطقة آسيا والمحيط الهادئ والشرق الأوسط وأفريقيا وأمريكا الجنوبية والوسطى.
- احصل على البيانات الإقليمية المحددة لسوق العاكسات الشمسية
نطاق تقرير سوق العاكسات الشمسية
| سمة التقرير | تفاصيل |
|---|---|
| حجم السوق في عام 2023 | 10.65 مليار دولار أمريكي |
| حجم السوق بحلول عام 2031 | 21.87 مليار دولار أمريكي |
| معدل النمو السنوي المركب العالمي (2023 - 2031) | 9.4% |
| البيانات التاريخية | 2021-2022 |
| فترة التنبؤ | 2024-2031 |
| القطاعات المغطاة |
حسب النوع
|
| المناطق والدول المغطاة |
أمريكا الشمالية
|
| قادة السوق وملفات تعريف الشركات الرئيسية |
|
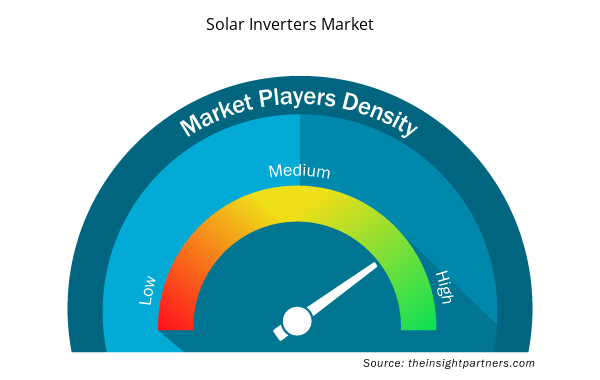
كثافة اللاعبين في سوق العاكسات الشمسية: فهم تأثيرها على ديناميكيات الأعمال
يشهد سوق العاكسات الشمسية نموًا سريعًا، مدفوعًا بالطلب المتزايد من المستخدم النهائي بسبب عوامل مثل تفضيلات المستهلكين المتطورة والتقدم التكنولوجي والوعي المتزايد بفوائد المنتج. ومع ارتفاع الطلب، تعمل الشركات على توسيع عروضها والابتكار لتلبية احتياجات المستهلكين والاستفادة من الاتجاهات الناشئة، مما يؤدي إلى زيادة نمو السوق.
تشير كثافة اللاعبين في السوق إلى توزيع الشركات أو المؤسسات العاملة في سوق أو صناعة معينة. وهي تشير إلى عدد المنافسين (اللاعبين في السوق) الموجودين في مساحة سوق معينة نسبة إلى حجمها أو قيمتها السوقية الإجمالية.
الشركات الرئيسية العاملة في سوق العاكسات الشمسية هي:
- فيمر سبا.
- دلتا للإلكترونيات، المحدودة
- إنيرتكوبس
- جودوي
- إلكترونيات الطاقة SL
- شركة باور ون مايكرو سيستمز المحدودة
إخلاء المسؤولية : الشركات المذكورة أعلاه ليست مرتبة بأي ترتيب معين.
- احصل على نظرة عامة على أهم اللاعبين الرئيسيين في سوق العاكسات الشمسية
أخبار سوق العاكسات الشمسية والتطورات الأخيرة
يتم تقييم سوق العاكسات الشمسية من خلال جمع البيانات النوعية والكمية بعد البحث الأولي والثانوي، والتي تتضمن منشورات الشركات المهمة وبيانات الجمعيات وقواعد البيانات. فيما يلي بعض التطورات في سوق العاكسات الشمسية:
- أطلقت شركة INVTSolar بنجاح أحدث منتجاتها من العاكس الشمسي على الشبكة XG1-5kW-S، في اجتماع الأعمال الحكومي SolarQuarter لعام 2023 الذي أقيم في الهند. فازت شركة INVTSolar بجائزة "State Leadership Awards 2023- Gujarat" التي أثبتت تراكمها التقني العميق وقوتها البحثية والتطويرية القوية وإنجازاتها المتميزة - العاكس الشمسي أحادي الطور على الشبكة XG1-5KTL-S. (المصدر: NTT Ltd، بيان صحفي، ديسمبر 2023)
- أعلنت شركة Colt Data Centre Services (DCS)، وهي شركة عالمية تقدم حلول مراكز البيانات الضخمة والكبيرة الحجم للمؤسسات، عن إطلاق أول مركز بيانات لها في الهند. ويمثل مركز البيانات الرائد في نافي مومباي التوسع الاستراتيجي لشركة Colt DCS والتزامها بدعم الطلب المتزايد من مقدمي خدمات الحوسبة السحابية الضخمة الحجم والشركات التجارية الكبيرة في سوق مراكز البيانات الهندية سريعة النمو. ويضم مركز البيانات محطة فرعية GIS عالية المرونة بقوة 220 كيلو فولت في الموقع مع تكوين LILO. (المصدر: Colt Data Centre Services Holdings، بيان صحفي، سبتمبر 2023)
تقرير سوق العاكسات الشمسية يغطي النتائج المتوقعة
يقدم تقرير "حجم سوق العاكسات الشمسية والتوقعات (2021-2031)" تحليلاً مفصلاً للسوق يغطي المجالات التالية:
- حجم سوق العاكسات الشمسية وتوقعاتها على المستويات العالمية والإقليمية والوطنية لجميع قطاعات السوق الرئيسية التي يغطيها النطاق
- اتجاهات سوق العاكسات الشمسية بالإضافة إلى ديناميكيات السوق مثل المحركات والقيود والفرص الرئيسية
- تحليل مفصل لقوى PEST/Porter الخمس وSWOT
- تحليل سوق العاكسات الشمسية يغطي اتجاهات السوق الرئيسية والإطار العالمي والإقليمي واللاعبين الرئيسيين واللوائح والتطورات الأخيرة في السوق
- تحليل المشهد الصناعي والمنافسة الذي يغطي تركيز السوق، وتحليل خريطة الحرارة، واللاعبين البارزين، والتطورات الأخيرة في سوق العاكسات الشمسية
- ملفات تعريف الشركة التفصيلية

نافين خبيرٌ متمرسٌ في أبحاث السوق والاستشارات، يتمتع بخبرةٍ تزيد عن 9 سنوات في مشاريع مُخصصة ومُشتركة واستشارية. يشغل حاليًا منصب نائب الرئيس المساعد، وقد نجح في إدارة أصحاب المصلحة عبر سلسلة قيمة المشاريع، وألّف أكثر من 100 تقرير بحثي وأكثر من 30 مهمة استشارية. يمتد نطاق عمله ليشمل مشاريع صناعية وحكومية، مساهمًا بشكل كبير في نجاح العملاء واتخاذ القرارات القائمة على البيانات.
نافين حاصلٌ على شهادة في هندسة الإلكترونيات والاتصالات من جامعة فرجينيا التقنية، كارناتاكا، وشهادة ماجستير في إدارة الأعمال في التسويق والعمليات من جامعة مانيبال. وهو عضوٌ نشطٌ في معهد مهندسي الكهرباء والإلكترونيات (IEEE) لمدة 9 سنوات، حيث شارك في مؤتمراتٍ وندواتٍ تقنية، وتطوّع على مستوى الأقسام والمناطق. قبل منصبه الحالي، عمل مستشارًا استراتيجيًا مساعدًا في IndustryARC، ومستشارًا للخوادم الصناعية في شركة هيوليت باكارد (HP Global).
- التحليل التاريخي (سنتان)، سنة الأساس، التوقعات (7 سنوات) مع معدل النمو السنوي المركب
- تحليل PEST و SWOT
- حجم السوق والقيمة / الحجم - عالمي، إقليمي، بلد
- الصناعة والمنافسة
- مجموعة بيانات إكسل
التقارير الحديثة
تقارير ذات صلة
شهادات العملاء
تقرير سوق أنظمة SCADA من Insight Partners شامل، ويقدم رؤى قيّمة حول الاتجاهات الحالية والتوقعات المستقبلية. تميّز الفريق باحترافية عالية وسرعة في الاستجابة ودعم مستمر طوال الوقت. نحن راضون جدًا ونوصي بشدة بخدماتهم.
ران كيديم شريك, شركة ريالي تكنولوجيز المحدودةطلبتُ تقريرًا عن سوق برمجيات محدد، وأعدّه الفريق في غضون أيام قليلة. كانت المعلومات ذات صلة وثيقة وعرضها جيد. ثم طلبتُ بعض التعديلات والإضافات على التقرير. وكان الفريق متجاوبًا للغاية، وحصلتُ على التقرير النهائي في أقل من أسبوع.
جان هيرفيه جين رئيس مجلس الإدارة, فيوتشر أناليتيكاعملنا مع شركة "إنسايت بارتنرز" لإجراء دراسة سوقية وتوقعات مهمة. زودونا برؤى واضحة حول الفرص والمخاطر، مما ساعدنا في صياغة خططنا. كانت أبحاثهم سهلة الاستخدام ومبنية على بيانات دقيقة، مما ساعدنا على اتخاذ قرارات ذكية وواثقة. نوصي بهم بشدة.
بيوش ناجبال نائب الرئيس الأول, شعاع عالي عالميقدّمت شركة Insight Partners أبحاثًا سوقية ثاقبة ومنظمة جيدًا بخبرة واسعة في هذا المجال. تميّز فريقهم بالاحترافية وسرعة الاستجابة طوال الوقت. وسهّل موقعهم الإلكتروني سهل الاستخدام الوصول إلى تقارير القطاع. نوصي بهم بشدة لخدمات بحثية موثوقة وعالية الجودة.
يوكيهيكو أداتشي المدير التنفيذي, ديب بلو، ذ.م.م.هذه أول مرة أشتري فيها تقرير سوق من The Insight Partners. رغم أنني كنت مترددًا في البداية، إلا أنني زرت موقعهم الإلكتروني وشعرت براحة أكبر للمخاطرة وشراء تقرير السوق. أنا راضٍ تمامًا عن جودة التقرير وخدمة العملاء. كانت لديّ عدة أسئلة وتعليقات حول التقرير الأولي، ولكن بعد بضع محادثات عبر البريد الإلكتروني مع محللهم، أعتقد أن لديّ تقريرًا يمكنني استخدامه كمدخل لعملية التخطيط الاستراتيجي لدينا. شكرًا جزيلاً لكم على تخصيص وقتكم الإضافي وجعل هذه التجربة إيجابية. سأوصي بخدماتكم للآخرين بالتأكيد، وستكونون أول من ألجأ إليه عندما نحتاج إلى المزيد من بيانات السوق.
جون سوزوكي الرئيس والرئيس التنفيذي وعضو مجلس الإدارة, بي كيه تكنولوجيزأود أن أقدّر دعمكم واحترافيتكم في الاستجابة لطلبي للحصول على معلومات بشأن سوق التشخيص المخبري للأمراض المعدية في نيجيريا. كما أُقدّر صبركم وتوجيهكم، واستعدادكم لتقديم خصم، مما مكّننا في النهاية من إتمام الصفقة. أتطلع إلى التعامل مع "ذا إنسايت بارتنرز" مستقبلًا، كل ذلك بفضل الانطباع الذي تركتموه لديّ نتيجةً لهذا اللقاء الأول.
الدكتور تشيجيوك أونيا المدير الإداري, شركة باينكريست للرعاية الصحية المحدودةسبب الشراء
- اتخاذ قرارات مدروسة
- فهم ديناميكيات السوق
- تحليل المنافسة
- رؤى العملاء
- توقعات السوق
- تخفيف المخاطر
- التخطيط الاستراتيجي
- مبررات الاستثمار
- تحديد الأسواق الناشئة
- تحسين استراتيجيات التسويق
- تعزيز الكفاءة التشغيلية
- مواكبة التوجهات التنظيمية


 احصل على عينة مجانية ل - سوق العاكسات الشمسية