تقرير سوق المراقبة الاصطناعية 2031 حسب القطاعات والجغرافيا والديناميكيات والتطورات الأخيرة والرؤى الاستراتيجية
البيانات التاريخية : 2021-2022 | سنة الأساس : 2023 | فترة التنبؤ : 2024-2031حجم سوق المراقبة الاصطناعية وتوقعاته (2021-2031)، والحصة العالمية والإقليمية، والاتجاهات، وفرص النمو. يغطي التقرير: حسب النشر (محليًا وسحابيًا)، وحجم المؤسسة (الشركات الصغيرة والمتوسطة والكبيرة)، ونوع المراقبة (مراقبة واجهة برمجة التطبيقات، ومراقبة تطبيقات البرمجيات كخدمة، ومراقبة تطبيقات الهاتف المحمول، ومراقبة تطبيقات الويب)، والقطاع (قطاع الخدمات المصرفية والمالية والتأمين، والحكومة، وتجارة التجزئة، والرعاية الصحية، وتكنولوجيا المعلومات والاتصالات، وغيرها من الصناعات)، والموقع الجغرافي.
- تاريخ التقرير : Mar 2026
- رمز التقرير : TIPRE00010358
- الفئة : التكنولوجيا والإعلام والاتصالات
- الحالة : البيانات الصادرة
- تنسيقات التقارير المتاحة :


- عدد الصفحات : 150
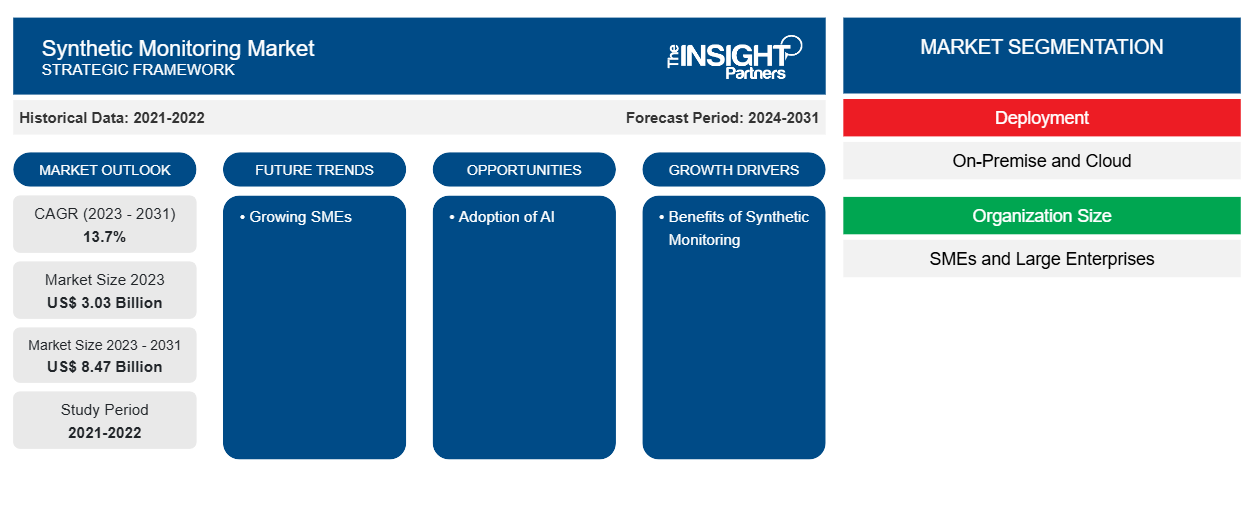
من المتوقع أن يصل حجم سوق المراقبة الاصطناعية إلى 8.47 مليار دولار أمريكي بحلول عام 2031 من 3.03 مليار دولار أمريكي في عام 2023. ومن المتوقع أن يسجل السوق معدل نمو سنوي مركب بنسبة 13.7٪ في الفترة 2023-2031. ومن المرجح أن يظل التبني المتزايد للسحابة والارتفاع في الرقمنة مفتاحًا لاتجاهات سوق المراقبة الاصطناعية.
تحليل سوق المراقبة الاصطناعية
إن الدعم الحكومي لتعزيز قدرات الشركات الصغيرة والمتوسطة الحجم على أعمالها من خلال توفير المساعدات المالية والحوافز والمبادرات يمكن أن يساهم في تبني حلول البرمجيات مثل حلول المراقبة الاصطناعية. إن سوق السحابة المتنامية هي أحد العوامل الرئيسية التي تدفع سوق المراقبة الاصطناعية حيث تعد السحابة حلاً فعالاً من حيث التكلفة يؤدي إلى اعتماد حلول المراقبة الاصطناعية المستندة إلى السحابة من قبل العديد من الشركات الكبيرة والشركات الصغيرة والمتوسطة الحجم، مما يدفع سوق المراقبة الاصطناعية إلى الأمام.
نظرة عامة على سوق المراقبة الاصطناعية
يشير مصطلح المراقبة الاصطناعية إلى استخدام البرامج لمحاكاة تفاعلات المستخدم مع النظام. ثم يتم تحليل البيانات التي تم جمعها من المعاملات المحاكاة لتحديد كيفية عمل النظام. على سبيل المثال، يمكن استخدام المراقبة الاصطناعية لتحديد ما إذا كان موقع الويب يحقق تحميل الصفحة المطلوب ووقت الاستجابة ووقت التشغيل.
قم بتخصيص هذا التقرير ليناسب متطلباتك
ستحصل على تخصيص لأي تقرير - مجانًا - بما في ذلك أجزاء من هذا التقرير، أو تحليل على مستوى الدولة، وحزمة بيانات Excel، بالإضافة إلى الاستفادة من العروض والخصومات الرائعة للشركات الناشئة والجامعات
سوق المراقبة الاصطناعية: رؤى استراتيجية
-
احصل على أهم اتجاهات السوق الرئيسية لهذا التقرير.ستتضمن هذه العينة المجانية تحليلاً للبيانات، بدءًا من اتجاهات السوق وحتى التقديرات والتوقعات.
محركات وفرص سوق المراقبة الاصطناعية
فوائد المراقبة الاصطناعية لصالح السوق
تسمح حلول المراقبة الاصطناعية للمستخدم النهائي بالتنبؤ بكيفية استجابة النظام لطلبات المستخدم قبل تفاعل المستخدمين الفعليين معه. تسمح المراقبة الاصطناعية للمستخدم النهائي بالتحقق مما إذا كانت الأنظمة تلبي متطلبات الأداء والتوافر قبل الدخول في الإنتاج. في هذا الصدد، تسمح المراقبة الاصطناعية بالمراقبة الاستباقية . علاوة على ذلك، تعد المراقبة الاصطناعية مفيدة لتقييم استجابة النظام للطلبات غير العادية أو غير المتكررة التي قد لا يتم التقاطها في البيانات التي تم جمعها من المعاملات التي بدأها المستخدمون الحقيقيون. وبالتالي، تساعد المراقبة الاصطناعية في التحقق من صحة أداء النظام وتحديد المشكلات المحتملة قبل أن تؤثر على تجربة المستخدم النهائي. تمكن المراقبة الاصطناعية من المراقبة بشكل استباقي وتعالج مشكلات الأداء والتوافر قبل أن تعطل تطبيقات الإنتاج، مما يساعد المستخدمين النهائيين على تحسين تجربة عملائهم.
نمو سوق الشركات الصغيرة والمتوسطة
تستخدم الشركات أدوات مراقبة اصطناعية لمراقبة تطبيقات المؤسسة، وتوفر معلومات حول وقت التشغيل والأداء العام للمعاملات التجارية المهمة من خلال محاكاة العديد من أنشطة العملاء. تمكن هذه الأدوات الشركات من سد فجوات الأداء التي قد تؤثر على تجربة المستخدم النهائي الإجمالية. وبالتالي، فإن التحول الرقمي المتزايد والدعم الحكومي للشركات الصغيرة والمتوسطة الحجم يعزز قدرة الشركات الصغيرة والمتوسطة الحجم على تبني حلول برمجية لتعزيز كفاءة سير العمل لديها. وعلاوة على ذلك، مع اتجاه التحول الرقمي لتحسين الكفاءة التشغيلية الإجمالية وتجربة المستخدم النهائي، ستتبنى المزيد من الشركات الصغيرة والمتوسطة الحجم حلول المراقبة الاصطناعية في المستقبل.
تقرير تحليل تجزئة سوق المراقبة الاصطناعية
إن القطاعات الرئيسية التي ساهمت في اشتقاق تحليل سوق المراقبة الاصطناعية هي نشر الحبر، وحجم المنظمة، ونوع المراقبة، والصناعة.
- من خلال النشر، يتم تقسيم السوق إلى محلي وسحابي. ومن المتوقع أن ينمو قطاع السحابة بأعلى معدل نمو سنوي مركب.
- بناءً على حجم المنظمة، يتم تقسيم السوق إلى الشركات الصغيرة والمتوسطة الحجم والشركات الكبيرة. ومن المتوقع أن ينمو قطاع الشركات الصغيرة والمتوسطة الحجم بأعلى معدل نمو سنوي مركب.
- بحسب نوع المراقبة، يتم تقسيم السوق إلى مراقبة واجهة برمجة التطبيقات، ومراقبة تطبيقات SaaS، ومراقبة تطبيقات الهاتف المحمول، ومراقبة تطبيقات الويب . احتل قطاع مراقبة واجهة برمجة التطبيقات أكبر حصة في السوق في عام 2023.
- بناءً على الصناعة، يتم تقسيم السوق إلى قطاعات الخدمات المصرفية والمالية والتأمين والحكومة وتجارة التجزئة والرعاية الصحية وتكنولوجيا المعلومات والاتصالات وغيرها من الصناعات. ومن المتوقع أن ينمو قطاع التجزئة بأعلى معدل نمو سنوي مركب.
تحليل حصة سوق المراقبة الاصطناعية حسب المنطقة الجغرافية
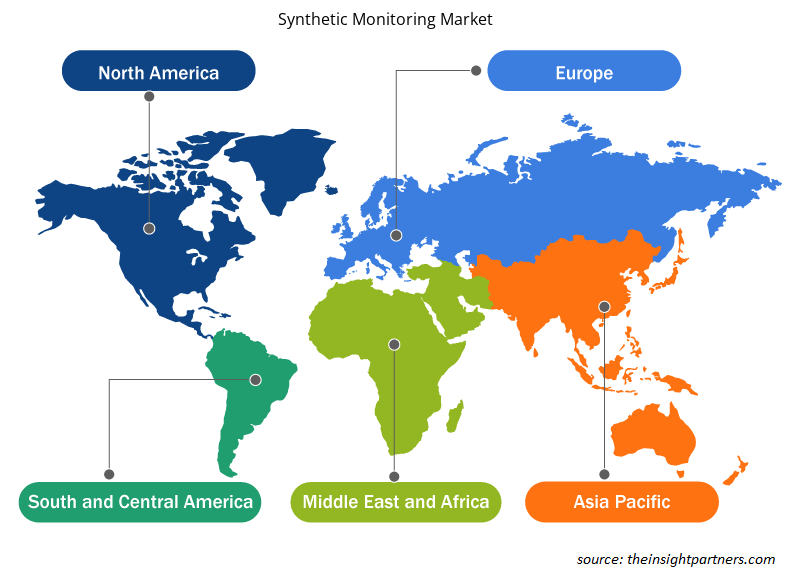
ينقسم النطاق الجغرافي لتقرير سوق المراقبة الاصطناعية بشكل أساسي إلى خمس مناطق: أمريكا الشمالية، ومنطقة آسيا والمحيط الهادئ، وأوروبا، والشرق الأوسط وأفريقيا، وأمريكا الجنوبية/أمريكا الجنوبية والوسطى.
من المتوقع أن تنمو منطقة آسيا والمحيط الهادئ بأعلى معدل نمو سنوي مركب. ويؤدي انتشار تكنولوجيا الحوسبة السحابية في المنطقة إلى نمو سوق المنطقة. كما تعمل الشركات الصغيرة والمتوسطة الحجم المتنامية في المنطقة على تغذية الطلب على حلول البرمجيات في المنطقة، مما يدفع إلى استخدام تكنولوجيا المراقبة الاصطناعية. ويؤدي التحول الرقمي في الاقتصادات الناشئة مثل الهند والصين إلى اعتماد حلول المراقبة الاصطناعية في مختلف الصناعات التي تستهدف المستخدم النهائي.
رؤى إقليمية حول سوق المراقبة الاصطناعية
لقد قام المحللون في Insight Partners بشرح الاتجاهات والعوامل الإقليمية المؤثرة على سوق المراقبة الاصطناعية طوال فترة التوقعات بشكل شامل. يناقش هذا القسم أيضًا قطاعات سوق المراقبة الاصطناعية والجغرافيا في جميع أنحاء أمريكا الشمالية وأوروبا ومنطقة آسيا والمحيط الهادئ والشرق الأوسط وأفريقيا وأمريكا الجنوبية والوسطى.
- احصل على البيانات الإقليمية المحددة لسوق المراقبة الاصطناعية
نطاق تقرير سوق المراقبة الاصطناعية
| سمة التقرير | تفاصيل |
|---|---|
| حجم السوق في عام 2023 | 3.03 مليار دولار أمريكي |
| حجم السوق بحلول عام 2031 | 8.47 مليار دولار أمريكي |
| معدل النمو السنوي المركب العالمي (2023 - 2031) | 13.7% |
| البيانات التاريخية | 2021-2022 |
| فترة التنبؤ | 2024-2031 |
| القطاعات المغطاة |
حسب النشر
|
| المناطق والدول المغطاة |
أمريكا الشمالية
|
| قادة السوق وملفات تعريف الشركات الرئيسية |
|
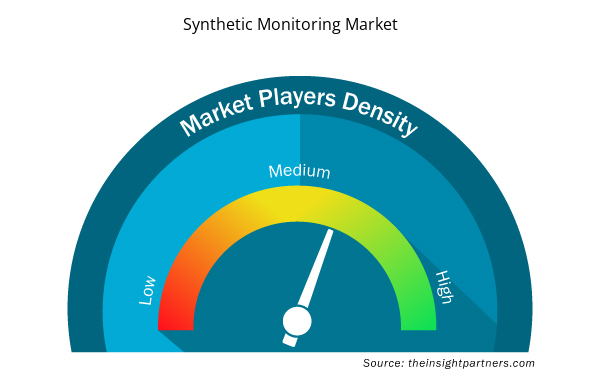
كثافة اللاعبين في سوق المراقبة الاصطناعية: فهم تأثيرها على ديناميكيات الأعمال
يشهد سوق المراقبة الاصطناعية نموًا سريعًا، مدفوعًا بالطلب المتزايد من المستخدم النهائي بسبب عوامل مثل تفضيلات المستهلكين المتطورة والتقدم التكنولوجي والوعي المتزايد بفوائد المنتج. ومع ارتفاع الطلب، تعمل الشركات على توسيع عروضها والابتكار لتلبية احتياجات المستهلكين والاستفادة من الاتجاهات الناشئة، مما يؤدي إلى زيادة نمو السوق.
تشير كثافة اللاعبين في السوق إلى توزيع الشركات أو المؤسسات العاملة في سوق أو صناعة معينة. وهي تشير إلى عدد المنافسين (اللاعبين في السوق) الموجودين في مساحة سوق معينة نسبة إلى حجمها أو قيمتها السوقية الإجمالية.
الشركات الرئيسية العاملة في سوق المراقبة الاصطناعية هي:
- أبيكا
- شركة آب داينامكس المحدودة
- شركة برودكوم
- شركة ديناتريس المحدودة.
- شركة إي جي للابتكارات
- شركة آي بي إم
إخلاء المسؤولية : الشركات المذكورة أعلاه ليست مرتبة بأي ترتيب معين.
- احصل على نظرة عامة على أهم اللاعبين الرئيسيين في سوق المراقبة الاصطناعية
أخبار سوق المراقبة الاصطناعية والتطورات الأخيرة
يتم تقييم سوق المراقبة الاصطناعية من خلال جمع البيانات النوعية والكمية بعد البحث الأولي والثانوي، والذي يتضمن منشورات الشركات المهمة وبيانات الجمعيات وقواعد البيانات. فيما يلي قائمة بالتطورات في السوق:
- في يوليو 2023، قدمت Google المراقبة الاصطناعية، وهي قدرة مراقبة استباقية جديدة تستخدم نصوص Node.js الآلية لمحاكاة تفاعلات المستخدم مع تطبيق أو خدمة. يتيح لك هذا اختبار مدى توفر واتساق وأداء تطبيقات الويب وواجهات برمجة التطبيقات وتدفقات العمل التجارية الرئيسية من منظور مستخدم حقيقي على أساس دوري. في نوفمبر 2023، أعلنت Google عن التوفر العام للمراقبة الاصطناعية. بالإضافة إلى ذلك، مع هذا الإطلاق، تضمنت الشركة أيضًا قدرات جديدة للمراقبة الاصطناعية. (المصدر: Google، بيان صحفي، 2023)
- في مارس 2022، قامت Synthetic API Monitoring بتوسيع نطاق AppDynamics Synthetic Monitoring، مما مكن ITOps وDevOps من المساعدة في تقليل تأثير مشكلات أداء وتوافر واجهة برمجة التطبيقات على نتائج الأعمال وتجربة المستخدم. (المصدر: AppDynamics، بيان صحفي، 2022)
تغطية تقرير سوق المراقبة الاصطناعية والمنتجات النهائية
يوفر تقرير "حجم سوق المراقبة الاصطناعية والتوقعات (2021-2031)" تحليلاً مفصلاً للسوق يغطي المجالات التالية:
- حجم السوق والتوقعات على المستويات العالمية والإقليمية والوطنية لجميع قطاعات السوق الرئيسية التي يغطيها النطاق
- ديناميكيات السوق مثل المحركات والقيود والفرص الرئيسية
- الاتجاهات المستقبلية الرئيسية
- تحليل مفصل لقوى PEST/Porter الخمس وSWOT
- تحليل السوق العالمي والإقليمي الذي يغطي اتجاهات السوق الرئيسية واللاعبين الرئيسيين واللوائح والتطورات الأخيرة في السوق
- تحليل المشهد الصناعي والمنافسة الذي يغطي تركيز السوق، وتحليل خريطة الحرارة، واللاعبين البارزين، والتطورات الأخيرة
- ملفات تعريف الشركة التفصيلية

أنكيتا خبيرة ديناميكية في أبحاث السوق والاستشارات، تتمتع بخبرة تزيد عن 8 سنوات في قطاعات التكنولوجيا والإعلام وتكنولوجيا المعلومات والاتصالات والإلكترونيات وأشباه الموصلات. وقد قادت ونفذت بنجاح أكثر من 100 مهمة استشارية وبحثية لعملاء عالميين مثل مايكروسوفت وأوراكل وشركة NEC وSAP وKPMG وExpeditors International. تشمل كفاءاتها الأساسية تقييم السوق، وتحليل البيانات، والتنبؤ، وصياغة الاستراتيجيات، والاستخبارات التنافسية، وكتابة التقارير.
أنكيتا بارعة في إدارة دورات المشاريع الكاملة، بدءًا من تصميم عروض ما قبل البيع ومناقشات العملاء، وصولًا إلى تقديم رؤى عملية بعد البيع. كما أنها ماهرة في إدارة فرق متعددة الوظائف، وهيكلة وحدات بحثية معقدة، ومواءمة الحلول مع أهداف العمل الخاصة بالعملاء. وقد مكنتها مهاراتها الممتازة في التواصل والقيادة والعرض التقديمي من تحقيق نتائج قيّمة باستمرار في بيئات سوقية سريعة التطور.
- التحليل التاريخي (سنتان)، سنة الأساس، التوقعات (7 سنوات) مع معدل النمو السنوي المركب
- تحليل PEST و SWOT
- حجم السوق والقيمة / الحجم - عالمي، إقليمي، بلد
- الصناعة والمنافسة
- مجموعة بيانات إكسل
التقارير الحديثة
شهادات العملاء
تقرير سوق أنظمة SCADA من Insight Partners شامل، ويقدم رؤى قيّمة حول الاتجاهات الحالية والتوقعات المستقبلية. تميّز الفريق باحترافية عالية وسرعة في الاستجابة ودعم مستمر طوال الوقت. نحن راضون جدًا ونوصي بشدة بخدماتهم.
ران كيديم شريك, شركة ريالي تكنولوجيز المحدودةطلبتُ تقريرًا عن سوق برمجيات محدد، وأعدّه الفريق في غضون أيام قليلة. كانت المعلومات ذات صلة وثيقة وعرضها جيد. ثم طلبتُ بعض التعديلات والإضافات على التقرير. وكان الفريق متجاوبًا للغاية، وحصلتُ على التقرير النهائي في أقل من أسبوع.
جان هيرفيه جين رئيس مجلس الإدارة, فيوتشر أناليتيكاعملنا مع شركة "إنسايت بارتنرز" لإجراء دراسة سوقية وتوقعات مهمة. زودونا برؤى واضحة حول الفرص والمخاطر، مما ساعدنا في صياغة خططنا. كانت أبحاثهم سهلة الاستخدام ومبنية على بيانات دقيقة، مما ساعدنا على اتخاذ قرارات ذكية وواثقة. نوصي بهم بشدة.
بيوش ناجبال نائب الرئيس الأول, شعاع عالي عالميقدّمت شركة Insight Partners أبحاثًا سوقية ثاقبة ومنظمة جيدًا بخبرة واسعة في هذا المجال. تميّز فريقهم بالاحترافية وسرعة الاستجابة طوال الوقت. وسهّل موقعهم الإلكتروني سهل الاستخدام الوصول إلى تقارير القطاع. نوصي بهم بشدة لخدمات بحثية موثوقة وعالية الجودة.
يوكيهيكو أداتشي المدير التنفيذي, ديب بلو، ذ.م.م.هذه أول مرة أشتري فيها تقرير سوق من The Insight Partners. رغم أنني كنت مترددًا في البداية، إلا أنني زرت موقعهم الإلكتروني وشعرت براحة أكبر للمخاطرة وشراء تقرير السوق. أنا راضٍ تمامًا عن جودة التقرير وخدمة العملاء. كانت لديّ عدة أسئلة وتعليقات حول التقرير الأولي، ولكن بعد بضع محادثات عبر البريد الإلكتروني مع محللهم، أعتقد أن لديّ تقريرًا يمكنني استخدامه كمدخل لعملية التخطيط الاستراتيجي لدينا. شكرًا جزيلاً لكم على تخصيص وقتكم الإضافي وجعل هذه التجربة إيجابية. سأوصي بخدماتكم للآخرين بالتأكيد، وستكونون أول من ألجأ إليه عندما نحتاج إلى المزيد من بيانات السوق.
جون سوزوكي الرئيس والرئيس التنفيذي وعضو مجلس الإدارة, بي كيه تكنولوجيزأود أن أقدّر دعمكم واحترافيتكم في الاستجابة لطلبي للحصول على معلومات بشأن سوق التشخيص المخبري للأمراض المعدية في نيجيريا. كما أُقدّر صبركم وتوجيهكم، واستعدادكم لتقديم خصم، مما مكّننا في النهاية من إتمام الصفقة. أتطلع إلى التعامل مع "ذا إنسايت بارتنرز" مستقبلًا، كل ذلك بفضل الانطباع الذي تركتموه لديّ نتيجةً لهذا اللقاء الأول.
الدكتور تشيجيوك أونيا المدير الإداري, شركة باينكريست للرعاية الصحية المحدودةسبب الشراء
- اتخاذ قرارات مدروسة
- فهم ديناميكيات السوق
- تحليل المنافسة
- رؤى العملاء
- توقعات السوق
- تخفيف المخاطر
- التخطيط الاستراتيجي
- مبررات الاستثمار
- تحديد الأسواق الناشئة
- تحسين استراتيجيات التسويق
- تعزيز الكفاءة التشغيلية
- مواكبة التوجهات التنظيمية


 احصل على عينة مجانية ل - سوق المراقبة الاصطناعية