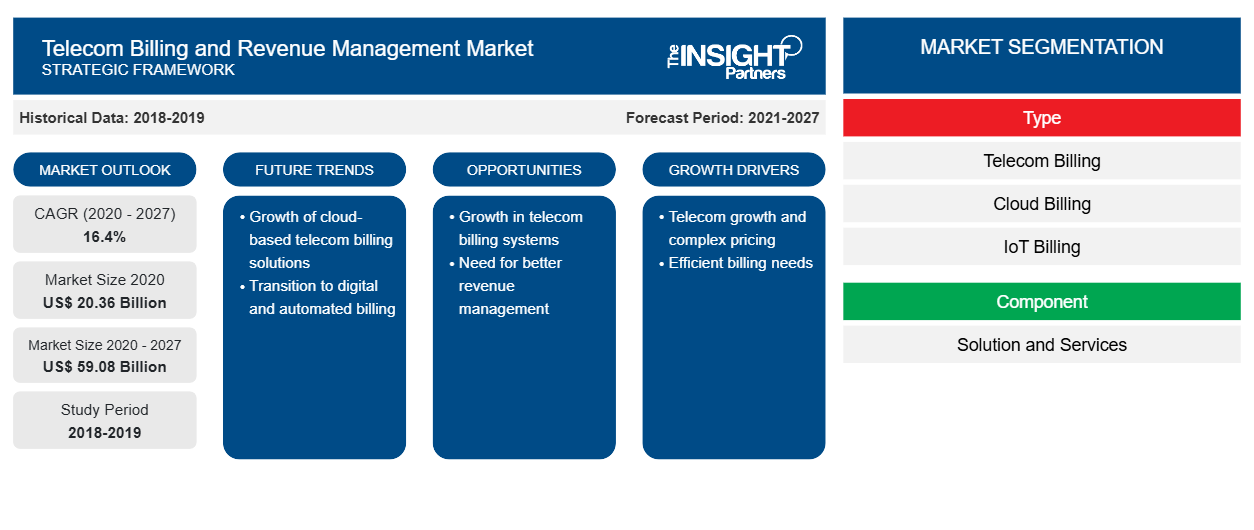
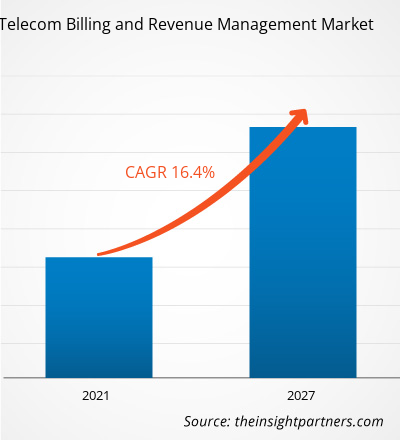
من المتوقع أن ينمو سوق الفواتير وإدارة الإيرادات في قطاع الاتصالات من 20,362.5 مليون دولار أمريكي في عام 2020 إلى 59,075.4 مليون دولار أمريكي بحلول عام 2027؛ ومن المتوقع أن ينمو بمعدل نمو سنوي مركب قدره 16.4٪ من عام 2020 إلى عام 2027.
إن تحسن الاحتياجات إلى حلول وخدمات الفوترة وإدارة الإيرادات المبتكرة يعزى إلى نمو السوق. إن الحاجة المستمرة والحاجة إلى توفير خدمات اتصالات غنية وتجارب عملاء عالية الجودة محسنة تحث مزودي حلول وخدمات الفوترة وإدارة الإيرادات في مجال الاتصالات على مواصلة تطوير مثل هذه الحلول والخدمات المتوافقة والمتكافئة لتلبية المتطلبات الديناميكية وطلبات المستخدمين النهائيين مع تحسين قابلية التوسع والمرونة والوظائف. تساعد حلول الفوترة وإدارة الإيرادات الفعّالة والمرنة شركات تقديم الخدمات على تحقيق الدخل من استخدام البيانات والخدمات بشكل أكبر، مما يوفر للشركة قدرات تحليلية محسنة للبيانات في الوقت الفعلي وكفاءة لتوجيه تدفقات إيراداتها من خلال توفير حلول مخصصة بشكل أكبر. كما تساعد شركات تقديم الخدمات على إدارة عمليات الفوترة والتحصيل للمشتركين المتنامية بكفاءة من خلال منصة واحدة فعالة.
علاوة على ذلك، يساعد الشركات ويزودها بالثقة في طرح عروض مخصصة جديدة وخدمات مدرة للدخل وسياسات فرض رسوم في فترة قصيرة مع تحسين الكفاءة، وكذلك تحقيق الدخل من استثماراتها في البنية التحتية مع تعزيز إدارة العملاء والإيرادات. تعمل شركات تقديم خدمات الاتصالات باستمرار على ترقية أنظمتها القديمة من خلال إضافة منصات تساعد في خدمة قاعدة المشتركين المعززة والانتقال نحو الحلول والخدمات المستندة إلى السحابة مثل SaaS، والتي ستساعدهم على خفض CAPEX مع تحسين OPEX. بالإضافة إلى ذلك، تعمل اتجاهات الإنفاق المتزايدة والمتطلبات على حلول مثل BSS / OSS أيضًا على تسريع نمو سوق الفواتير وإدارة الإيرادات التنافسية في مجال الاتصالات العالمية.
تأثير جائحة كوفيد-19 على سوق الفواتير وإدارة الإيرادات في قطاع الاتصالات
كان لأزمة كوفيد-19 تأثير إيجابي على نمو بعض القطاعات مثل تكنولوجيا المعلومات والاتصالات. وقد نما الطلب على الخدمات الرقمية بشكل خاص بمعدل مرتفع في الأشهر القليلة الماضية. ومع ذلك، من المتوقع أن يؤثر الانخفاض في الأنشطة التجارية مثل الشراكات لزيادة اعتماد حلول الفوترة وإدارة الإيرادات في مختلف البلدان سلبًا على نمو توسع مزودي خدمات الفوترة وإدارة الإيرادات في مجال الاتصالات. وبالتالي، سيكون هناك تأثير مختلط مما سيؤدي إلى انخفاض النمو قليلاً في عامي 2020 و2021.
قم بتخصيص هذا التقرير ليناسب متطلباتك
ستحصل على تخصيص لأي تقرير - مجانًا - بما في ذلك أجزاء من هذا التقرير، أو تحليل على مستوى الدولة، وحزمة بيانات Excel، بالإضافة إلى الاستفادة من العروض والخصومات الرائعة للشركات الناشئة والجامعات
سوق الفواتير وإدارة الإيرادات في قطاع الاتصالات:
- احصل على أهم اتجاهات السوق الرئيسية لهذا التقرير.ستتضمن هذه العينة المجانية تحليلاً للبيانات، بدءًا من اتجاهات السوق وحتى التقديرات والتوقعات.
رؤى السوق - سوق الفواتير وإدارة الإيرادات في قطاع الاتصالات
تزايد التفضيل نحو الحلول والخدمات المستندة إلى السحابة
تواجه شركات الاتصالات ومقدمي خدمات الاتصالات في جميع أنحاء العالم تعقيدات في إدارة الأنظمة وتوسيع البنية الأساسية للشبكة وتلبية احتياجات قاعدة المستهلكين المتزايدة باستمرار. يعد تحقيق كفاءة تشغيلية عالية إلى جانب تحسين إدارة الإيرادات والتحصيل أحد أهم الأولويات والمتطلبات لشركات الاتصالات ومقدمي خدمات الاتصالات. توفر حلول الفوترة الفعّالة المستندة إلى السحابة لمشغلي الاتصالات ومقدمي خدمات الاتصالات سهولة مراقبة استخدام خدمة المشتركين بشكل فعال وفقًا لخطط الخدمة وفرض الرسوم وفقًا لذلك. كما تساعد شركات تقديم خدمات الاتصالات في إدارة مدفوعاتها وحساباتها ومساعدتها في بناء شبكاتها وتخطيطها وتحسينها، مع دعم الشركات في إدارة عدد كبير من المعاملات المتزامنة وطلبات العملاء.
إن إحدى أكبر المزايا التي توفرها نماذج الحلول والخدمات المستندة إلى السحابة مثل SaaS لمشغلي الاتصالات ومقدمي خدمات الاتصالات هي الاستثمار الأولي المنخفض أو تكلفة رأس المال. فهي تساعد الشركات على تقليل الاستثمار في البنية التحتية وجهود التكامل، وتوفر لها تسهيلات مثل نموذج الدفع حسب الاستخدام والذي يساعد الشركات أيضًا على تجربة حلول جديدة بمخاطر منخفضة. كما توفر نماذج الخدمات مثل SaaS لمشغلي الاتصالات ومقدمي خدمات الاتصالات القدرة على نشر ودعم الخدمات الجديدة والحالية بسرعة، وبالتالي مساعدة الشركات على دخول أسواق جديدة بشكل أسرع وبتكلفة اقتصادية أكبر ومرونة أكبر.
رؤى قائمة على المكونات
استنادًا إلى المكون، يتم تقسيم سوق الفواتير وإدارة الإيرادات في مجال الاتصالات إلى حلول وخدمات. احتلت قطاعات الحلول الحصة الأكبر في السوق في عام 2019.
يركز اللاعبون العاملون في سوق الفواتير وإدارة الإيرادات في مجال الاتصالات بشكل أساسي على تطوير المنتجات المتقدمة والفعالة.
- في عام 2020، اختارت شركة TDC، وهي شركة مقرها الدنمارك، شركة Comarch SA لتقديم حلول دعم الأعمال الخاصة بها. وقد عرضت الشركة على شركة TDC إدارة طلبات العملاء ونظام الفوترة المتقاربة وإطار تكامل التطبيقات.
- في عام 2020، تعاونت شركة Telecom Fiji Limited، وهي شركة تقدم خدمات الهاتف، مع شركة Oracle Communications بهدف تحديث مشاركة العملاء وتسريع توصيل المنتجات والخدمات. وستقوم الشركة بنشر نظام الفوترة وإدارة الإيرادات من Oracle كجزء من مجموعة Oracle Digital Experience for Communications، للسماح بتجربة رقمية للعملاء.
تم تقسيم سوق الفواتير وإدارة الإيرادات في قطاع الاتصالات على النحو التالي:
سوق الفواتير وإدارة الإيرادات في قطاع الاتصالات – حسب المكونات
- حل
- إدارة الفواتير
- إدارة الحسابات
- آحرون
- خدمات
- الخدمات المهنية
- الخدمات المُدارة
سوق الفواتير وإدارة الإيرادات في قطاع الاتصالات – حسب النوع
- فواتير الاتصالات
- الفوترة السحابية
- فواتير إنترنت الأشياء
سوق الفواتير وإدارة الإيرادات في قطاع الاتصالات – حسب نوع النشر
- في الموقع
- مبني على السحابة
- هجين
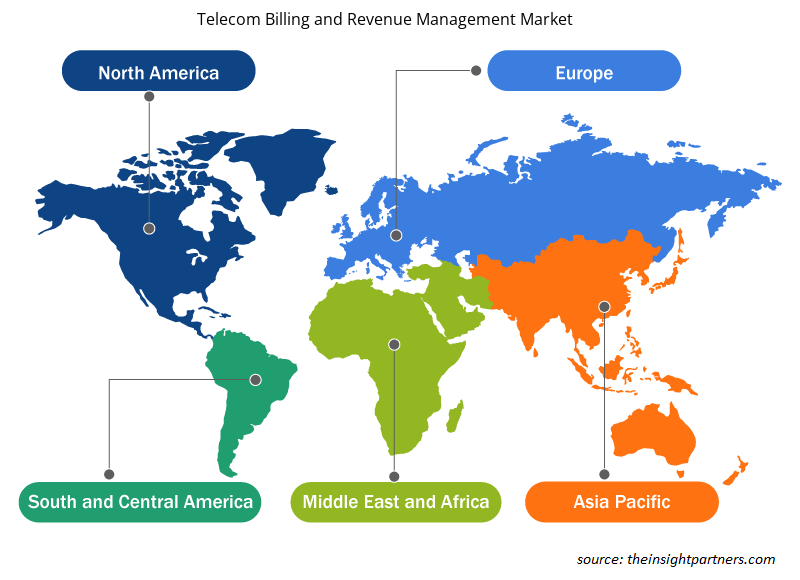
سوق الفواتير وإدارة الإيرادات في قطاع الاتصالات – حسب المنطقة الجغرافية
أمريكا الشمالية
- نحن
- كندا
- المكسيك
أوروبا
- فرنسا
- ألمانيا
- إيطاليا
- إسبانيا
- المملكة المتحدة
- بقية أوروبا
آسيا والمحيط الهادئ (APAC)
- اليابان
- الصين
- أستراليا
- الهند
- بقية منطقة آسيا والمحيط الهادئ
الشرق الأوسط وأفريقيا
- الامارات العربية المتحدة
- دبي
- المملكة العربية السعودية
- قطر
- جنوب أفريقيا
- أثيوبيا
- رواندا
- كينيا
- ساحل العاج
- غانا
- نيجيريا
- مصر
- المغرب
- تونس
- ديك رومى
- باقي منطقة الشرق الأوسط وأفريقيا
أمريكا الجنوبية (SAM)
- البرازيل
- الأرجنتين
- تشيلي
- بيرو
- كولومبيا
- بقية سام
رؤى إقليمية حول سوق إدارة الإيرادات والفواتير في قطاع الاتصالات
لقد قام المحللون في Insight Partners بشرح الاتجاهات والعوامل الإقليمية المؤثرة على سوق الفواتير وإدارة الإيرادات للاتصالات طوال فترة التوقعات بشكل شامل. يناقش هذا القسم أيضًا قطاعات سوق الفواتير وإدارة الإيرادات للاتصالات والجغرافيا في جميع أنحاء أمريكا الشمالية وأوروبا ومنطقة آسيا والمحيط الهادئ والشرق الأوسط وأفريقيا وأمريكا الجنوبية والوسطى.
- احصل على البيانات الإقليمية المحددة لسوق الفواتير وإدارة الإيرادات في قطاع الاتصالات
نطاق تقرير سوق إدارة الإيرادات والفواتير في قطاع الاتصالات
| سمة التقرير | تفاصيل |
|---|---|
| حجم السوق في عام 2020 | 20.36 مليار دولار أمريكي |
| حجم السوق بحلول عام 2027 | 59.08 مليار دولار أمريكي |
| معدل النمو السنوي المركب العالمي (2020 - 2027) | 16.4% |
| البيانات التاريخية | 2018-2019 |
| فترة التنبؤ | 2021-2027 |
| القطاعات المغطاة | حسب النوع
|
| المناطق والدول المغطاة | أمريكا الشمالية
|
| قادة السوق وملفات تعريف الشركات الرئيسية |
|
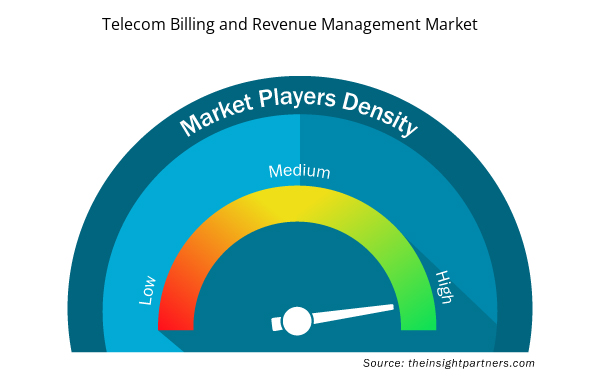
كثافة اللاعبين في السوق: فهم تأثيرها على ديناميكيات الأعمال
يشهد سوق إدارة الإيرادات والفواتير في قطاع الاتصالات نموًا سريعًا، مدفوعًا بالطلب المتزايد من جانب المستخدم النهائي بسبب عوامل مثل تفضيلات المستهلكين المتطورة والتقدم التكنولوجي والوعي المتزايد بفوائد المنتج. ومع ارتفاع الطلب، تعمل الشركات على توسيع عروضها والابتكار لتلبية احتياجات المستهلكين والاستفادة من الاتجاهات الناشئة، مما يؤدي إلى زيادة نمو السوق.
تشير كثافة اللاعبين في السوق إلى توزيع الشركات أو المؤسسات العاملة في سوق أو صناعة معينة. وهي تشير إلى عدد المنافسين (اللاعبين في السوق) الموجودين في مساحة سوق معينة نسبة إلى حجمها أو قيمتها السوقية الإجمالية.
الشركات الرئيسية العاملة في سوق الفواتير وإدارة الإيرادات للاتصالات هي:
- شركة أكسنتشر المحدودة
- شركة الكاتيل-لوسنت السعودية
- شركة أمدوكس
- سيريليون PLC
- شركة سي إس جي سيستمز الدولية
إخلاء المسؤولية : الشركات المذكورة أعلاه ليست مرتبة بأي ترتيب معين.
- احصل على نظرة عامة على أهم اللاعبين الرئيسيين في سوق إدارة الإيرادات والفواتير للاتصالات
سوق الفواتير وإدارة الإيرادات في قطاع الاتصالات – نبذة عن الشركة
- شركة أكسنتشر المحدودة
- شركة الكاتيل-لوسنت السعودية
- شركة أمدوكس
- سيريليون PLC
- شركة سي إس جي سيستمز الدولية
- اريكسون
- شركة ترانسفيرس الدولية المحدودة
- شركة هيوليت باكارد للتطوير المحدودة
- شركة هواوي للتكنولوجيا المحدودة
- شركة NEC
- شركة أوراكل
- ريدكيني، المحدودة
- ساب اس اي
- كسوره
- باناماكس
- اس تي ال تيك
- كومفيفا
- شبكات إنجهاوس
- شركة فيسيرف
- شركة في كير
- مفاسيس
- أجيليتي CIS
- اسكادينيا
- كاسر الشبكة
- التحليل التاريخي (سنتان)، السنة الأساسية، التوقعات (7 سنوات) مع معدل النمو السنوي المركب
- تحليل PEST و SWOT
- حجم السوق والقيمة / الحجم - عالميًا وإقليميًا وقطريًا
- الصناعة والمنافسة
- مجموعة بيانات Excel


Report Coverage
Revenue forecast, Company Analysis, Industry landscape, Growth factors, and Trends

Segment Covered
This text is related
to segments covered.

Regional Scope
North America, Europe, Asia Pacific, Middle East & Africa, South & Central America

Country Scope
This text is related
to country scope.
The List of Companies - Telecom Billing and Revenue Management Market
- Accenture PLC
- Alcatel-Lucent S.A.
- Amdocs, Inc.
- Cerillion PLC
- CSG Systems International, Inc.
- Ericsson
- goTransverse International, Inc.
- Hewlett-Packard Development Company L.P.
- Huawei Technologies Co., Ltd.
- NEC Corporation
- Oracle Corporation
- Redknee, Inc.
- SAP SE
- XURA
- Panamax
- stl.tech
- Comviva
- Enghouse Networks
- Fiserv, Inc.
- Vcare Corporation
- Mphasis
- Agility CIS
- ESKADENIA
- Netcracker
The Insight Partners performs research in 4 major stages: Data Collection & Secondary Research, Primary Research, Data Analysis and Data Triangulation & Final Review.
- Data Collection and Secondary Research:
As a market research and consulting firm operating from a decade, we have published and advised several client across the globe. First step for any study will start with an assessment of currently available data and insights from existing reports. Further, historical and current market information is collected from Investor Presentations, Annual Reports, SEC Filings, etc., and other information related to company’s performance and market positioning are gathered from Paid Databases (Factiva, Hoovers, and Reuters) and various other publications available in public domain.
Several associations trade associates, technical forums, institutes, societies and organization are accessed to gain technical as well as market related insights through their publications such as research papers, blogs and press releases related to the studies are referred to get cues about the market. Further, white papers, journals, magazines, and other news articles published in last 3 years are scrutinized and analyzed to understand the current market trends.
- Primary Research:
The primarily interview analysis comprise of data obtained from industry participants interview and answers to survey questions gathered by in-house primary team.
For primary research, interviews are conducted with industry experts/CEOs/Marketing Managers/VPs/Subject Matter Experts from both demand and supply side to get a 360-degree view of the market. The primary team conducts several interviews based on the complexity of the markets to understand the various market trends and dynamics which makes research more credible and precise.
A typical research interview fulfils the following functions:
- Provides first-hand information on the market size, market trends, growth trends, competitive landscape, and outlook
- Validates and strengthens in-house secondary research findings
- Develops the analysis team’s expertise and market understanding
Primary research involves email interactions and telephone interviews for each market, category, segment, and sub-segment across geographies. The participants who typically take part in such a process include, but are not limited to:
- Industry participants: VPs, business development managers, market intelligence managers and national sales managers
- Outside experts: Valuation experts, research analysts and key opinion leaders specializing in the electronics and semiconductor industry.
Below is the breakup of our primary respondents by company, designation, and region:

Once we receive the confirmation from primary research sources or primary respondents, we finalize the base year market estimation and forecast the data as per the macroeconomic and microeconomic factors assessed during data collection.
- Data Analysis:
Once data is validated through both secondary as well as primary respondents, we finalize the market estimations by hypothesis formulation and factor analysis at regional and country level.
- Macro-Economic Factor Analysis:
We analyse macroeconomic indicators such the gross domestic product (GDP), increase in the demand for goods and services across industries, technological advancement, regional economic growth, governmental policies, the influence of COVID-19, PEST analysis, and other aspects. This analysis aids in setting benchmarks for various nations/regions and approximating market splits. Additionally, the general trend of the aforementioned components aid in determining the market's development possibilities.
- Country Level Data:
Various factors that are especially aligned to the country are taken into account to determine the market size for a certain area and country, including the presence of vendors, such as headquarters and offices, the country's GDP, demand patterns, and industry growth. To comprehend the market dynamics for the nation, a number of growth variables, inhibitors, application areas, and current market trends are researched. The aforementioned elements aid in determining the country's overall market's growth potential.
- Company Profile:
The “Table of Contents” is formulated by listing and analyzing more than 25 - 30 companies operating in the market ecosystem across geographies. However, we profile only 10 companies as a standard practice in our syndicate reports. These 10 companies comprise leading, emerging, and regional players. Nonetheless, our analysis is not restricted to the 10 listed companies, we also analyze other companies present in the market to develop a holistic view and understand the prevailing trends. The “Company Profiles” section in the report covers key facts, business description, products & services, financial information, SWOT analysis, and key developments. The financial information presented is extracted from the annual reports and official documents of the publicly listed companies. Upon collecting the information for the sections of respective companies, we verify them via various primary sources and then compile the data in respective company profiles. The company level information helps us in deriving the base number as well as in forecasting the market size.
- Developing Base Number:
Aggregation of sales statistics (2020-2022) and macro-economic factor, and other secondary and primary research insights are utilized to arrive at base number and related market shares for 2022. The data gaps are identified in this step and relevant market data is analyzed, collected from paid primary interviews or databases. On finalizing the base year market size, forecasts are developed on the basis of macro-economic, industry and market growth factors and company level analysis.
- Data Triangulation and Final Review:
The market findings and base year market size calculations are validated from supply as well as demand side. Demand side validations are based on macro-economic factor analysis and benchmarks for respective regions and countries. In case of supply side validations, revenues of major companies are estimated (in case not available) based on industry benchmark, approximate number of employees, product portfolio, and primary interviews revenues are gathered. Further revenue from target product/service segment is assessed to avoid overshooting of market statistics. In case of heavy deviations between supply and demand side values, all thes steps are repeated to achieve synchronization.
We follow an iterative model, wherein we share our research findings with Subject Matter Experts (SME’s) and Key Opinion Leaders (KOLs) until consensus view of the market is not formulated – this model negates any drastic deviation in the opinions of experts. Only validated and universally acceptable research findings are quoted in our reports.
We have important check points that we use to validate our research findings – which we call – data triangulation, where we validate the information, we generate from secondary sources with primary interviews and then we re-validate with our internal data bases and Subject matter experts. This comprehensive model enables us to deliver high quality, reliable data in shortest possible time.
 احصل على عينة مجانية لهذا التقرير