تقرير سوق الموصلات تحت الماء 2031 حسب القطاعات والجغرافيا والديناميكيات والتطورات الأخيرة والرؤى الإستراتيجية
البيانات التاريخية : 2021-2022 | سنة الأساس : 2023 | فترة التنبؤ : 2024-2031حجم سوق الموصلات تحت الماء وتوقعاتها (2021 - 2031)، والحصة العالمية والإقليمية، والاتجاه، وفرص النمو، وتغطية تقرير تحليل الفرص: حسب النوع (مصبوب بالمطاط، اقتران حثي مملوء بالسوائل موصل تحت الماء، ورأس صلب/سائب)، والاتصال (كهربائي، وألياف بصرية، وهجين)، والتطبيق (العسكري والدفاعي، والنفط والغاز، والاتصالات، وعلم المحيطات، والمركبات عن بعد/المركبات تحت الماء ذاتية القيادة، وغيرها)، والجغرافيا.
- تاريخ التقرير : Mar 2026
- رمز التقرير : TIPRE00006137
- الفئة : الإلكترونيات وأشباه الموصلات
- الحالة : البيانات الصادرة
- تنسيقات التقارير المتاحة :


- عدد الصفحات : 150
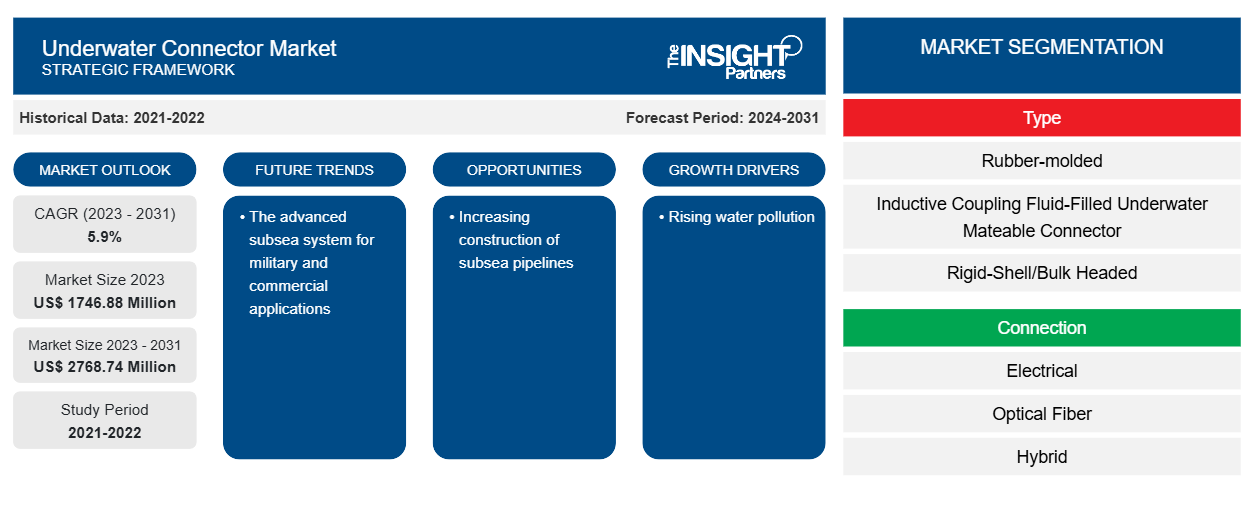
من المتوقع أن يصل حجم سوق الموصلات تحت الماء إلى 2768.74 مليون دولار أمريكي بحلول عام 2031 من 1746.88 مليون دولار أمريكي في عام 2023. ومن المتوقع أن يسجل السوق معدل نمو سنوي مركب بنسبة 5.9٪ خلال الفترة 2023-2031. ومن المرجح أن يظل النظام المتقدم تحت سطح البحر للتطبيقات العسكرية والتجارية اتجاهًا رئيسيًا في السوق.
تحليل سوق الموصلات تحت الماء
مع تزايد الاستثمار الحكومي والخاص في أنشطة البحث والتطوير، تُستخدم الموصلات تحت الماء في التطبيقات المحيطية والبحرية والنفط والغاز والجيوفيزيائية والدفاعية والبحرية التي تديرها المنظمات التجارية والبحثية والدفاعية. لإنتاج موصلات تحت الماء جديدة، تدمج الصناعات تقنيات جديدة وتستخدم مواد خام مختلفة ذات متانة وأداء محسّنين في ظل ظروف تحت الماء. تتطلب العديد من شركات الشبكات والناقلين أنظمة نقل بيانات عالية السرعة، والتي تتطلب استخدام موصل كابل متقدم تحت الماء. يتزايد الطلب على موصلات الكابلات تحت الماء مع شيوع التعدين تحت الماء واستكشاف النفط من خلال دمج التقنيات الجديدة.
نظرة عامة على سوق الموصلات تحت الماء
تم تصميم الموصلات تحت الماء، والمعروفة أيضًا باسم الموصلات تحت الماء (الكهربائية)، أو الموصلات الرطبة، أو الموصلات البحرية، بحيث يمكن توصيلها أو فصلها في البيئات الرطبة وهي قادرة على تحمل البيئات الأكثر تطرفًا، من مياه البحر المسببة للتآكل والضغط إلى الاهتزاز والصدمات. تجد هذه الموصلات استخدامًا واسع النطاق في التطبيقات تحت الماء، مثل الروبوتات، وعمليات النفط والغاز تحت سطح البحر، والبحوث البحرية، وأنظمة الطاقة المتجددة. كما أنها مفيدة في المناطق الرطبة حيث تكون هناك حاجة إلى توصيلات موثوقة. العديد من الموصلات مقاومة للرذاذ إلى حد ما، ولكن عندما يتطلب التطبيق غمر الكابلات أو تعريض نقاط التوصيل لتأثيرات كبيرة، فلن يكون هذا كافيًا. يلزم وجود موصل مقاوم للماء لتوفير أعلى مستوى ممكن من الحماية.
قم بتخصيص هذا التقرير ليناسب متطلباتك
ستحصل على تخصيص لأي تقرير - مجانًا - بما في ذلك أجزاء من هذا التقرير، أو تحليل على مستوى الدولة، وحزمة بيانات Excel، بالإضافة إلى الاستفادة من العروض والخصومات الرائعة للشركات الناشئة والجامعات
سوق الموصلات تحت الماء: رؤى استراتيجية
-
احصل على أهم اتجاهات السوق الرئيسية لهذا التقرير.ستتضمن هذه العينة المجانية تحليلاً للبيانات، بدءًا من اتجاهات السوق وحتى التقديرات والتوقعات.
محركات وفرص سوق الموصلات تحت الماء
ارتفاع تلوث المياه
مع ارتفاع تلوث المياه، يتزايد الطلب على الموصلات تحت الماء. وفقًا لمنظمة الصحة العالمية، يستهلك حوالي 2 مليار شخص في جميع أنحاء العالم مياهًا ملوثة. يستخدم 368 مليون شخص مصادر غير آمنة للمياه. بالإضافة إلى ذلك، فإن 80٪ من النفايات في الماء تأتي من الأرض. تقتل نفايات المحيطات سنويًا ما يقرب من مليون طائر بحري وكائنات بحرية. مع نمو البلاد وتحضرها، أصبحت المسطحات المائية سامة. تشير التقديرات إلى أن حوالي 70٪ من المياه السطحية في الهند غير صالحة للاستهلاك. يدخل ما يقرب من 40 مليون لتر من مياه الصرف الصحي يوميًا إلى الأنهار والمسطحات المائية الأخرى مع معالجة جزء صغير فقط بشكل صحيح. يشير تقرير حديث للبنك الدولي إلى أن التلوث في المنبع يقلل من النمو الاقتصادي في المناطق الواقعة في مجرى النهر، مما يقلل من نمو الناتج المحلي الإجمالي في هذه المناطق بما يصل إلى الثلث. وبالتالي، مع ارتفاع تلوث المياه، يتزايد الطلب على الموصلات تحت الماء.
زيادة بناء خطوط الأنابيب تحت سطح البحر
تُعد خطوط الأنابيب البحرية مكونًا أساسيًا لمشروع استخراج النفط والغاز البحري لنقل الهيدروكربونات. ويتزايد الطلب على خطوط الأنابيب البحرية . على سبيل المثال، في ديسمبر 2022، تم تكليف مجموعة STATS من قبل شركة الإنشاءات البترولية الوطنية (NPCC)، وهي شركة مقاولات النفط والغاز ومقرها الإمارات العربية المتحدة، لتوفير خدمات عزل خطوط الأنابيب والتوصيل الساخن والتوصيل لأكبر مشروع تدخل لخطوط الأنابيب البحرية في العالم. تُستخدم الموصلات تحت الماء على نطاق واسع في هذه الأنابيب. وبالتالي، فإن البناء المتزايد لخطوط الأنابيب البحرية يخلق المزيد من الفرص للسوق.
تقرير تحليل تجزئة سوق الموصلات تحت الماء
إن القطاعات الرئيسية التي ساهمت في اشتقاق تحليل سوق الموصل تحت الماء هي النوع والاتصال والتطبيق.
- بناءً على النوع، يتم تقسيم سوق الموصلات تحت الماء إلى موصلات مطاطية قابلة للربط بالحث ومملوءة بالسوائل وموصلات ذات غلاف صلب/رأس سائب. احتل قطاع الموصلات المطاطية المصبوبة حصة سوقية أكبر في عام 2023.
- من حيث الاتصال، يتم تقسيم السوق إلى كهربائي وألياف بصرية وهجين. احتل القطاع الكهربائي حصة سوقية أكبر في عام 2023.
- بحسب التطبيق، يتم تقسيم السوق إلى العسكرية والدفاعية، والنفط والغاز، والاتصالات، وعلم المحيطات، والمركبات البحرية ذاتية التحكم عن بعد/المركبات البحرية تحت الماء، وغيرها.
- حسب القطاع الرأسي، يتم تقسيم السوق إلى الحكومة والدفاع، والخدمات المصرفية والمالية والتأمين، والتجزئة، وتكنولوجيا المعلومات والاتصالات، والرعاية الصحية، والطاقة والمرافق، والتعليم، وغيرها.
تحليل حصة سوق الموصلات تحت الماء حسب المنطقة الجغرافية
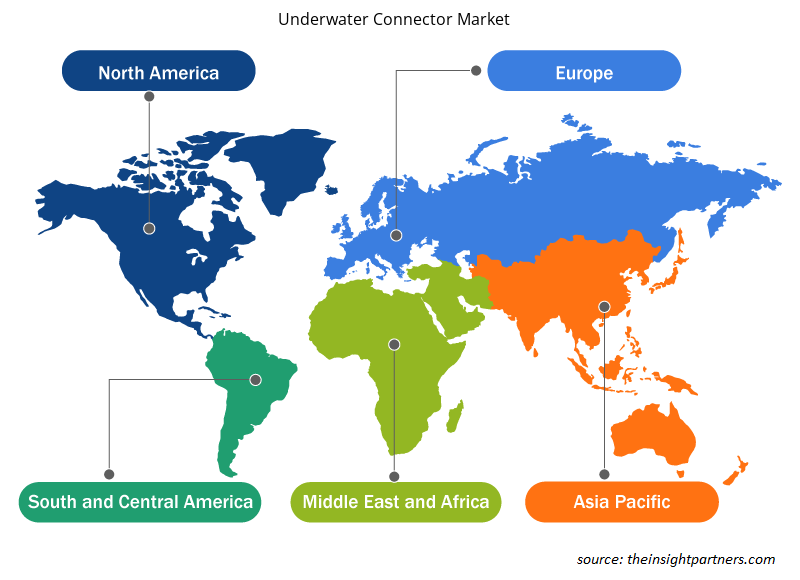
ينقسم النطاق الجغرافي لتقرير سوق الموصل تحت الماء بشكل أساسي إلى خمس مناطق: أمريكا الشمالية، ومنطقة آسيا والمحيط الهادئ، وأوروبا، والشرق الأوسط وأفريقيا، وأمريكا الجنوبية والوسطى.
تساهم الزيادة في إنتاج النفط والغاز في بعض بلدان أوروبا في نمو سوق الموصلات تحت الماء. تعد روسيا أكبر مورد للغاز الطبيعي والبترول إلى الاتحاد الأوروبي؛ ومع ذلك، تؤثر الحروب الروسية والأوكرانية سلبًا على صناعة النفط والغاز، مما قد يؤدي إلى إبطاء نمو سوق الموصلات تحت الماء. علاوة على ذلك، يوفر التحول في نماذج الأعمال، مثل العمل من المنزل، فرصة للمشاركين في سوق الموصلات تحت الماء.
رؤى إقليمية حول سوق الموصلات تحت الماء
لقد قام المحللون في Insight Partners بشرح الاتجاهات والعوامل الإقليمية المؤثرة على سوق الموصلات تحت الماء طوال فترة التنبؤ بشكل شامل. يناقش هذا القسم أيضًا قطاعات سوق الموصلات تحت الماء والجغرافيا في جميع أنحاء أمريكا الشمالية وأوروبا ومنطقة آسيا والمحيط الهادئ والشرق الأوسط وأفريقيا وأمريكا الجنوبية والوسطى.
- احصل على البيانات الإقليمية المحددة لسوق الموصلات تحت الماء
نطاق تقرير سوق الموصلات تحت الماء
| سمة التقرير | تفاصيل |
|---|---|
| حجم السوق في عام 2023 | 1746.88 مليون دولار أمريكي |
| حجم السوق بحلول عام 2031 | 2768.74 مليون دولار أمريكي |
| معدل النمو السنوي المركب العالمي (2023 - 2031) | 5.9% |
| البيانات التاريخية | 2021-2022 |
| فترة التنبؤ | 2024-2031 |
| القطاعات المغطاة |
حسب النوع
|
| المناطق والدول المغطاة |
أمريكا الشمالية
|
| قادة السوق وملفات تعريف الشركات الرئيسية |
|
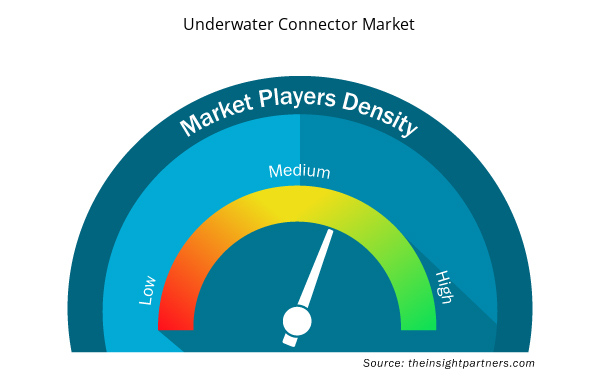
كثافة اللاعبين في سوق الموصلات تحت الماء: فهم تأثيرها على ديناميكيات الأعمال
يشهد سوق الموصلات تحت الماء نموًا سريعًا، مدفوعًا بالطلب المتزايد من المستخدم النهائي بسبب عوامل مثل تفضيلات المستهلك المتطورة والتقدم التكنولوجي والوعي المتزايد بفوائد المنتج. ومع ارتفاع الطلب، تعمل الشركات على توسيع عروضها والابتكار لتلبية احتياجات المستهلكين والاستفادة من الاتجاهات الناشئة، مما يؤدي إلى زيادة نمو السوق.
تشير كثافة اللاعبين في السوق إلى توزيع الشركات أو المؤسسات العاملة في سوق أو صناعة معينة. وهي تشير إلى عدد المنافسين (اللاعبين في السوق) الموجودين في مساحة سوق معينة نسبة إلى حجمها أو قيمتها السوقية الإجمالية.
الشركات الرئيسية العاملة في سوق الموصلات تحت الماء هي:
- برينز أوتوماتيز ذ.م.م
- شركة برينز
- جلينير
- صناعات ايه كيه
- موصلات فيشر SA
- شركة جيسما ستيكفربيندر المحدودة
إخلاء المسؤولية : الشركات المذكورة أعلاه ليست مرتبة بأي ترتيب معين.
- احصل على نظرة عامة على أهم اللاعبين الرئيسيين في سوق الموصلات تحت الماء
أخبار سوق الموصلات تحت الماء والتطورات الأخيرة
يتم تقييم سوق الموصلات تحت الماء من خلال جمع البيانات النوعية والكمية بعد البحث الأولي والثانوي، والتي تتضمن منشورات الشركات المهمة وبيانات الجمعيات وقواعد البيانات. فيما يلي بعض التطورات في سوق الموصلات تحت الماء:
- قدمت شركة MacArtney موصل SubConn® Nano بقطر 12.7 مم، والذي يوفر المساحة والوزن، والذي يعتمد على تصميم SubConn® الموثوق به عالميًا. يوفر موصل Nano الجديد أداءً متعدد الاستخدامات وقويًا، مما يجعله مناسبًا لتطبيقات متعددة والتصميم المدمج بشكل متزايد للأدوات والمعدات والأنظمة تحت الماء. (المصدر: MacArtney، بيان صحفي، مارس 2024)
- أعلنت شركة Connector Subsea Solutions (CSS) عن استحواذها على شركة Norvalves AS. ويكمل هذا الاستحواذ محفظة Subsea Distribution التابعة لشركة CSS بمجموعة Norvalves من الصمامات العلوية والسفلية، إلى جانب القدرات التشغيلية الرئيسية، بما في ذلك التصميم الداخلي والهندسة والتصنيع. (المصدر: PamTen Inc، بيان صحفي، مايو 2022)
تقرير سوق الموصلات تحت الماء والتغطية والنتائج المتوقعة
يوفر تقرير "حجم سوق الموصلات تحت الماء والتوقعات (2021-2031)" تحليلاً مفصلاً للسوق يغطي المجالات التالية:
- حجم سوق الموصلات تحت الماء وتوقعاته على المستويات العالمية والإقليمية والوطنية لجميع قطاعات السوق الرئيسية التي يغطيها النطاق
- اتجاهات سوق الموصلات تحت الماء بالإضافة إلى ديناميكيات السوق مثل المحركات والقيود والفرص الرئيسية
- تحليل مفصل لقوى PEST/Porter الخمس وSWOT
- تحليل سوق الموصلات تحت الماء يغطي اتجاهات السوق الرئيسية والإطار العالمي والإقليمي واللاعبين الرئيسيين واللوائح والتطورات الأخيرة في السوق
- تحليل المشهد الصناعي والمنافسة الذي يغطي تركيز السوق، وتحليل خريطة الحرارة، واللاعبين البارزين، والتطورات الأخيرة في سوق مصابيح LED الخيطية
- ملفات تعريف الشركة التفصيلية

نافين خبيرٌ متمرسٌ في أبحاث السوق والاستشارات، يتمتع بخبرةٍ تزيد عن 9 سنوات في مشاريع مُخصصة ومُشتركة واستشارية. يشغل حاليًا منصب نائب الرئيس المساعد، وقد نجح في إدارة أصحاب المصلحة عبر سلسلة قيمة المشاريع، وألّف أكثر من 100 تقرير بحثي وأكثر من 30 مهمة استشارية. يمتد نطاق عمله ليشمل مشاريع صناعية وحكومية، مساهمًا بشكل كبير في نجاح العملاء واتخاذ القرارات القائمة على البيانات.
نافين حاصلٌ على شهادة في هندسة الإلكترونيات والاتصالات من جامعة فرجينيا التقنية، كارناتاكا، وشهادة ماجستير في إدارة الأعمال في التسويق والعمليات من جامعة مانيبال. وهو عضوٌ نشطٌ في معهد مهندسي الكهرباء والإلكترونيات (IEEE) لمدة 9 سنوات، حيث شارك في مؤتمراتٍ وندواتٍ تقنية، وتطوّع على مستوى الأقسام والمناطق. قبل منصبه الحالي، عمل مستشارًا استراتيجيًا مساعدًا في IndustryARC، ومستشارًا للخوادم الصناعية في شركة هيوليت باكارد (HP Global).
- التحليل التاريخي (سنتان)، سنة الأساس، التوقعات (7 سنوات) مع معدل النمو السنوي المركب
- تحليل PEST و SWOT
- حجم السوق والقيمة / الحجم - عالمي، إقليمي، بلد
- الصناعة والمنافسة
- مجموعة بيانات إكسل
التقارير الحديثة
تقارير ذات صلة
شهادات العملاء
تقرير سوق أنظمة SCADA من Insight Partners شامل، ويقدم رؤى قيّمة حول الاتجاهات الحالية والتوقعات المستقبلية. تميّز الفريق باحترافية عالية وسرعة في الاستجابة ودعم مستمر طوال الوقت. نحن راضون جدًا ونوصي بشدة بخدماتهم.
ران كيديم شريك, شركة ريالي تكنولوجيز المحدودةطلبتُ تقريرًا عن سوق برمجيات محدد، وأعدّه الفريق في غضون أيام قليلة. كانت المعلومات ذات صلة وثيقة وعرضها جيد. ثم طلبتُ بعض التعديلات والإضافات على التقرير. وكان الفريق متجاوبًا للغاية، وحصلتُ على التقرير النهائي في أقل من أسبوع.
جان هيرفيه جين رئيس مجلس الإدارة, فيوتشر أناليتيكاعملنا مع شركة "إنسايت بارتنرز" لإجراء دراسة سوقية وتوقعات مهمة. زودونا برؤى واضحة حول الفرص والمخاطر، مما ساعدنا في صياغة خططنا. كانت أبحاثهم سهلة الاستخدام ومبنية على بيانات دقيقة، مما ساعدنا على اتخاذ قرارات ذكية وواثقة. نوصي بهم بشدة.
بيوش ناجبال نائب الرئيس الأول, شعاع عالي عالميقدّمت شركة Insight Partners أبحاثًا سوقية ثاقبة ومنظمة جيدًا بخبرة واسعة في هذا المجال. تميّز فريقهم بالاحترافية وسرعة الاستجابة طوال الوقت. وسهّل موقعهم الإلكتروني سهل الاستخدام الوصول إلى تقارير القطاع. نوصي بهم بشدة لخدمات بحثية موثوقة وعالية الجودة.
يوكيهيكو أداتشي المدير التنفيذي, ديب بلو، ذ.م.م.هذه أول مرة أشتري فيها تقرير سوق من The Insight Partners. رغم أنني كنت مترددًا في البداية، إلا أنني زرت موقعهم الإلكتروني وشعرت براحة أكبر للمخاطرة وشراء تقرير السوق. أنا راضٍ تمامًا عن جودة التقرير وخدمة العملاء. كانت لديّ عدة أسئلة وتعليقات حول التقرير الأولي، ولكن بعد بضع محادثات عبر البريد الإلكتروني مع محللهم، أعتقد أن لديّ تقريرًا يمكنني استخدامه كمدخل لعملية التخطيط الاستراتيجي لدينا. شكرًا جزيلاً لكم على تخصيص وقتكم الإضافي وجعل هذه التجربة إيجابية. سأوصي بخدماتكم للآخرين بالتأكيد، وستكونون أول من ألجأ إليه عندما نحتاج إلى المزيد من بيانات السوق.
جون سوزوكي الرئيس والرئيس التنفيذي وعضو مجلس الإدارة, بي كيه تكنولوجيزأود أن أقدّر دعمكم واحترافيتكم في الاستجابة لطلبي للحصول على معلومات بشأن سوق التشخيص المخبري للأمراض المعدية في نيجيريا. كما أُقدّر صبركم وتوجيهكم، واستعدادكم لتقديم خصم، مما مكّننا في النهاية من إتمام الصفقة. أتطلع إلى التعامل مع "ذا إنسايت بارتنرز" مستقبلًا، كل ذلك بفضل الانطباع الذي تركتموه لديّ نتيجةً لهذا اللقاء الأول.
الدكتور تشيجيوك أونيا المدير الإداري, شركة باينكريست للرعاية الصحية المحدودةسبب الشراء
- اتخاذ قرارات مدروسة
- فهم ديناميكيات السوق
- تحليل المنافسة
- رؤى العملاء
- توقعات السوق
- تخفيف المخاطر
- التخطيط الاستراتيجي
- مبررات الاستثمار
- تحديد الأسواق الناشئة
- تحسين استراتيجيات التسويق
- تعزيز الكفاءة التشغيلية
- مواكبة التوجهات التنظيمية


 احصل على عينة مجانية ل - سوق الموصلات تحت الماء