استراتيجيات سوق أجهزة الاستشعار القابلة للارتداء، وأفضل اللاعبين، وفرص النمو، والتحليل والتنبؤ بحلول عام 2031
البيانات التاريخية : 2021-2022 | سنة الأساس : 2023 | فترة التنبؤ : 2024-2031حجم سوق أجهزة الاستشعار القابلة للارتداء وتوقعاته (2021-2031)، والحصة العالمية والإقليمية، والاتجاهات، وفرص النمو. يغطي التقرير: حسب نوع المستشعر (مقياس التسارع، الجيروسكوب، مستشعرات الحركة، مستشعرات الصور، مستشعرات الضغط والقوة، مستشعرات اللمس، مستشعرات الموضع، وغيرها)، والتطبيق (المعصم الذكي، النظارات الذكية، ملابس الجسم الذكية، الأحذية الذكية، وغيرها)، والقطاع الرأسي (الإلكترونيات الاستهلاكية، الرعاية الصحية، والقطاعات الصناعية والتجارية)، والجغرافيا.
- تاريخ التقرير : Mar 2026
- رمز التقرير : TIPRE00002908
- الفئة : الإلكترونيات وأشباه الموصلات
- الحالة : البيانات الصادرة
- تنسيقات التقارير المتاحة :


- عدد الصفحات : 150
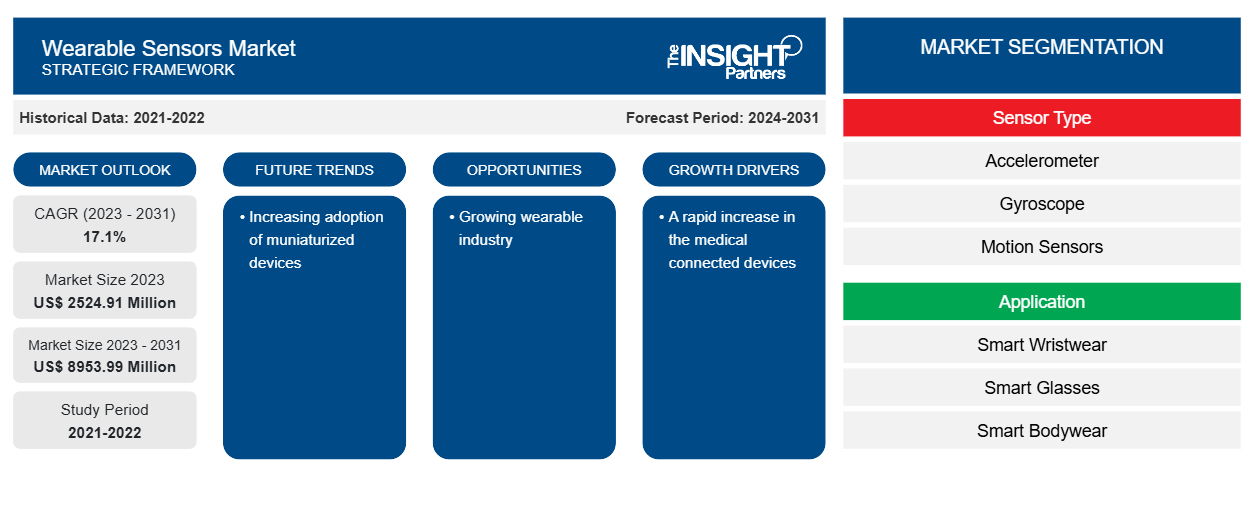
من المتوقع أن يصل حجم سوق أجهزة الاستشعار القابلة للارتداء إلى 8953.99 مليون دولار أمريكي بحلول عام 2031 من 2524.91 مليون دولار أمريكي في عام 2023. ومن المتوقع أن يسجل السوق معدل نمو سنوي مركب بنسبة 17.1٪ خلال الفترة 2023-2031. ومن المرجح أن يظل التبني المتزايد للأجهزة المصغرة اتجاهًا رئيسيًا في السوق.
تحليل سوق أجهزة الاستشعار القابلة للارتداء
إن الارتفاع السريع في استخدام الأجهزة المتصلة والهواتف الذكية والحاجة المتزايدة إلى أجهزة استشعار منخفضة الطاقة وأخف وزناً وأصغر حجماً ذات أداء متطور هي العوامل التي أسست اتجاه التصغير. لقد عززت التطورات في تقنيات التصنيع الدقيق والنانوتكنولوجي تقدم عملية التصغير، وبالتالي ترسيخ ظهور الأقمشة الذكية وجعل أجهزة الاستشعار الذكية فعالة من حيث التكلفة. في المستقبل، أظهرت مختبرات Abbott نظام Libre 3، وهو نظام مراقبة الجلوكوز ، في يناير 2022. وبالتالي، فإن الطلب المتزايد على الأجهزة القابلة للارتداء يحرك سوق أجهزة الاستشعار القابلة للارتداء العالمية.
نظرة عامة على سوق أجهزة الاستشعار القابلة للارتداء
أجهزة الاستشعار القابلة للارتداء هي أجهزة استشعار متصلة مباشرة بجلد الإنسان أو ملابسه لجمع الإشارات البيولوجية بغرض الرعاية الصحية الشخصية . يتم ترسيب أغشية رقيقة مرنة من MNPs على الركائز المناسبة للتحكم في درجة الحرارة والضغط كإشارات صحية. مع إدخال تقنية إنترنت الأشياء (IoT)، يتم توصيل جميع أنواع الأشياء بالإنترنت. وكجزء من هذا الاتجاه، يتم إحراز تقدم في إنشاء آليات لجمع البيانات من الأجهزة القابلة للارتداء واستخدام الذكاء الاصطناعي (AI) لتحليل هذه البيانات. الأجهزة القابلة للارتداء مثل النظارات والساعات وأساور المعصم متوفرة بالفعل. ومع ذلك، تتضمن التطورات الأخيرة عناصر يمكن ارتداؤها كل يوم، مثل القمصان والأجهزة المرنة شديدة الحساسية ومتعددة الوظائف وخفيفة الوزن المصنوعة باستخدام أغشية رقيقة وإيلاستومرات.
قم بتخصيص هذا التقرير ليناسب متطلباتك
ستحصل على تخصيص لأي تقرير - مجانًا - بما في ذلك أجزاء من هذا التقرير، أو تحليل على مستوى الدولة، وحزمة بيانات Excel، بالإضافة إلى الاستفادة من العروض والخصومات الرائعة للشركات الناشئة والجامعات
سوق أجهزة الاستشعار القابلة للارتداء: رؤى استراتيجية
-
احصل على أهم اتجاهات السوق الرئيسية لهذا التقرير.ستتضمن هذه العينة المجانية تحليلاً للبيانات، بدءًا من اتجاهات السوق وحتى التقديرات والتوقعات.
محركات وفرص سوق أجهزة الاستشعار القابلة للارتداء
زيادة سريعة في الأجهزة الطبية المتصلة
الرعاية الصحية الرقمية هي مفهوم واسع النطاق يشمل مفاهيم مرتبطة بين الرعاية الصحية والتكنولوجيا. الأجهزة الطبية المتصلة هي عامل رئيسي عندما يتم مراقبة المريض عن بعد. تعمل هذه الأجهزة حقًا على تحويل صناعة الرعاية الصحية من خلال ربط المرضى ومقدمي الرعاية الصحية بالمعلومات الطبية بسلاسة. على مدى عقد من الزمان أو نحو ذلك، شهد التقدم التكنولوجي بداية أجهزة الرعاية الصحية الرقمية التي تمكن المرضى ومقدمي الرعاية من تقليص فجوة الاتصال. تراقب تطبيقات الهواتف الذكية مثل BP المتصل مستويات الأكسجين وتتبع وتوليد بيانات مهمة. تم تجهيز معظم الأجهزة المتصلة بقدرات متفاوتة، مثل المراقبة في الوقت الفعلي والتصوير عالي الدقة . يساهم هذا في تحسين صحة المريض. باستخدام تكنولوجيا الصحة الرقمية، يمكن للمرضى تلقي الرعاية من أي منطقة من العالم. تُستخدم أجهزة الاستشعار القابلة للارتداء على نطاق واسع في مثل هذه الأجهزة، مما يعزز نمو سوق أجهزة الاستشعار القابلة للارتداء.
صناعة الأجهزة القابلة للارتداء المتنامية
لقد عززت الأجهزة المحمولة الذكية وإنترنت الأشياء تطوير الأجهزة القابلة للارتداء لأنها توفر العديد من الفوائد للمستخدمين وتخلق فرصًا جديدة في السوق. من الأجهزة القابلة للارتداء للمستهلكين التي تدعم نمط حياة أكثر صحة إلى الأجهزة القابلة للارتداء الطبية التي تساعد في التحكم في العلامات الحيوية للمريض، تساعد مكونات الاستشعار في إحياء هذه التقنيات القابلة للارتداء، مما يوفر للمستخدمين الإنتاجية والشعور بالأمان والحوافز الصحية. مع استمرار نمو صناعة الأجهزة القابلة للارتداء، أصبحت الحاجة إلى تقنيات استشعار أكثر إحكاما ودقة وموثوقية ضرورية للوظائف المناسبة طويلة الأجل في الأجهزة القابلة للارتداء.
تقرير تحليل تجزئة سوق أجهزة الاستشعار القابلة للارتداء
إن القطاعات الرئيسية التي ساهمت في اشتقاق تحليل سوق أجهزة الاستشعار القابلة للارتداء هي نوع المستشعر والتطبيق والعمودي.
- بناءً على نوع المستشعر، ينقسم سوق أجهزة الاستشعار القابلة للارتداء إلى مقاييس التسارع، وأجهزة قياس الزوايا، وأجهزة استشعار الحركة، وأجهزة استشعار الصور، وأجهزة استشعار الضغط والقوة، وأجهزة استشعار اللمس، وأجهزة استشعار الموضع، وغيرها. احتلت شريحة الأجهزة المخصصة حصة سوقية أكبر في عام 2023.
- حسب التطبيق، يتم تقسيم السوق إلى ملابس المعصم الذكية، والنظارات الذكية، وملابس الجسم الذكية، والأحذية الذكية، وغيرها.
- حسب القطاع الرأسي، يتم تقسيم السوق إلى إلكترونيات استهلاكية، ورعاية صحية، وصناعية ومؤسسية.
تحليل حصة سوق أجهزة الاستشعار القابلة للارتداء حسب المنطقة الجغرافية
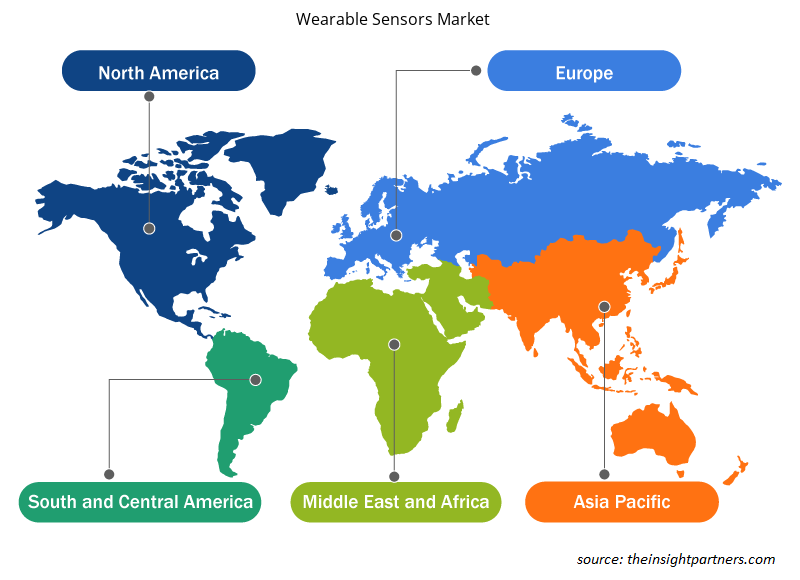
ينقسم النطاق الجغرافي لتقرير سوق أجهزة الاستشعار القابلة للارتداء بشكل أساسي إلى خمس مناطق: أمريكا الشمالية، ومنطقة آسيا والمحيط الهادئ، وأوروبا، والشرق الأوسط وأفريقيا، وأمريكا الجنوبية والوسطى.
تهيمن أمريكا الشمالية على سوق أجهزة الاستشعار القابلة للارتداء. ووفقًا لجمعية GSM، فقد كان من المتوقع أن يبلغ معدل انتشار الهواتف الذكية في أمريكا الشمالية حوالي 81٪ في عام 2021. وذكرت الجمعية أيضًا أن حوالي 329 مليون شخص قد اشتركوا في خدمات الهاتف المحمول. ويستمر الهاتف المحمول في الإضافة إلى الاقتصاد، حيث تولد خدمات الهاتف المحمول والتقنيات 4.2٪ من الناتج المحلي الإجمالي في عام 2021، في أمريكا الشمالية. ويمكن أن يُعزى معدل الانتشار المرتفع هذا إلى عوامل مختلفة، بما في ذلك انتشار الوصول إلى الإنترنت والبنية التحتية للاتصالات المتقدمة ومستوى المعيشة المرتفع. وبالتالي، يتزايد الطلب على أجهزة الاستشعار القابلة للارتداء في المنطقة.
رؤى إقليمية حول سوق أجهزة الاستشعار القابلة للارتداء
لقد قام المحللون في Insight Partners بشرح الاتجاهات والعوامل الإقليمية المؤثرة على سوق أجهزة الاستشعار القابلة للارتداء طوال فترة التوقعات بشكل شامل. يناقش هذا القسم أيضًا قطاعات سوق أجهزة الاستشعار القابلة للارتداء والجغرافيا في جميع أنحاء أمريكا الشمالية وأوروبا ومنطقة آسيا والمحيط الهادئ والشرق الأوسط وأفريقيا وأمريكا الجنوبية والوسطى.
- احصل على البيانات الإقليمية المحددة لسوق أجهزة الاستشعار القابلة للارتداء
نطاق تقرير سوق أجهزة الاستشعار القابلة للارتداء
| سمة التقرير | تفاصيل |
|---|---|
| حجم السوق في عام 2023 | 2524.91 مليون دولار أمريكي |
| حجم السوق بحلول عام 2031 | 8953.99 مليون دولار أمريكي |
| معدل النمو السنوي المركب العالمي (2023 - 2031) | 17.1% |
| البيانات التاريخية | 2021-2022 |
| فترة التنبؤ | 2024-2031 |
| القطاعات المغطاة |
حسب نوع المستشعر
|
| المناطق والدول المغطاة |
أمريكا الشمالية
|
| قادة السوق وملفات تعريف الشركات الرئيسية |
|
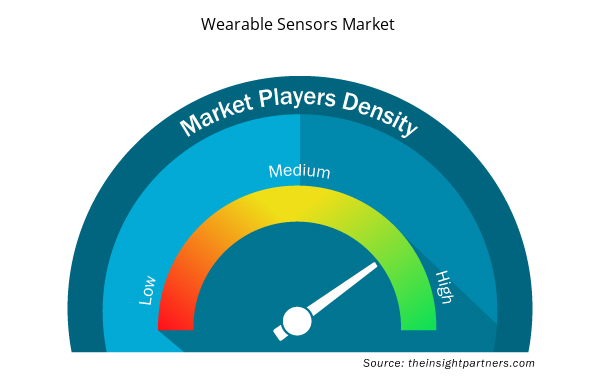
كثافة اللاعبين في سوق أجهزة الاستشعار القابلة للارتداء: فهم تأثيرها على ديناميكيات الأعمال
يشهد سوق أجهزة الاستشعار القابلة للارتداء نموًا سريعًا، مدفوعًا بالطلب المتزايد من المستخدم النهائي بسبب عوامل مثل تفضيلات المستهلكين المتطورة والتقدم التكنولوجي والوعي المتزايد بفوائد المنتج. ومع ارتفاع الطلب، تعمل الشركات على توسيع عروضها والابتكار لتلبية احتياجات المستهلكين والاستفادة من الاتجاهات الناشئة، مما يؤدي إلى زيادة نمو السوق.
تشير كثافة اللاعبين في السوق إلى توزيع الشركات أو المؤسسات العاملة في سوق أو صناعة معينة. وهي تشير إلى عدد المنافسين (اللاعبين في السوق) الموجودين في مساحة سوق معينة نسبة إلى حجمها أو قيمتها السوقية الإجمالية.
الشركات الرئيسية العاملة في سوق أجهزة الاستشعار القابلة للارتداء هي:
- شركة تكساس إنسترومنتس
- شركة NXP لأشباه الموصلات
- شركة انالوج ديفايسز
- شركة إس تي ميكروإلكترونيكس
- شركة إنفينيون للتكنولوجيا
- شركة سينسيريون ايه جي
إخلاء المسؤولية : الشركات المذكورة أعلاه ليست مرتبة بأي ترتيب معين.
- احصل على نظرة عامة على أهم اللاعبين الرئيسيين في سوق أجهزة الاستشعار القابلة للارتداء
أخبار سوق أجهزة الاستشعار القابلة للارتداء والتطورات الأخيرة
يتم تقييم سوق أجهزة الاستشعار القابلة للارتداء من خلال جمع البيانات النوعية والكمية بعد البحث الأولي والثانوي، والتي تتضمن منشورات الشركات المهمة وبيانات الجمعيات وقواعد البيانات. فيما يلي بعض التطورات في سوق أجهزة الاستشعار القابلة للارتداء:
- أعلنت شركة سيجنفاي عن تركيب إضاءة LED في نفق أحمد حمدي 2 الذي تم افتتاحه مؤخرًا. تستخدم سيجنفاي أحدث أنظمة الإضاءة المطابقة للمواصفات العالمية لتمكين التحكم عن بعد في الإضاءة مع توفير ما يصل إلى 70٪ من الطاقة. (المصدر: سيجنفاي، بيان صحفي، أكتوبر 2021)
- وقعت مجموعة تونجسرام اتفاقية في ديسمبر/كانون الأول لتركيب إضاءة "نفق تريسبونتس" في إسبانيا. ويمثل هذا المشروع سادس عقد لإضاءة الأنفاق تحصل عليه الشركة التي يقع مقرها في بودابست في إسبانيا في عام 2020، وهو إنجاز كبير في ضوء الصعوبات الاقتصادية الناجمة عن جائحة فيروس كورونا. (المصدر: مجموعة تونجسرام، بيان صحفي، سبتمبر/أيلول 2022)
تغطية تقرير سوق أجهزة الاستشعار القابلة للارتداء والمنتجات النهائية
يوفر تقرير "حجم سوق أجهزة الاستشعار القابلة للارتداء والتوقعات (2021-2031)" تحليلاً مفصلاً للسوق يغطي المجالات التالية:
- حجم سوق أجهزة الاستشعار القابلة للارتداء وتوقعاته على المستويات العالمية والإقليمية والوطنية لجميع قطاعات السوق الرئيسية التي يغطيها النطاق
- اتجاهات سوق أجهزة الاستشعار القابلة للارتداء بالإضافة إلى ديناميكيات السوق مثل السائقين، والضوابط، والفرص الرئيسية
- تحليل مفصل لقوى PEST/Porter الخمس وSWOT
- تحليل سوق أجهزة الاستشعار القابلة للارتداء الذي يغطي اتجاهات السوق الرئيسية والإطار العالمي والإقليمي واللاعبين الرئيسيين واللوائح والتطورات الأخيرة في السوق
- تحليل المشهد الصناعي والمنافسة الذي يغطي تركيز السوق، وتحليل خريطة الحرارة، واللاعبين البارزين، والتطورات الأخيرة في سوق أجهزة الاستشعار القابلة للارتداء
- ملفات تعريف الشركة التفصيلية

نافين خبيرٌ متمرسٌ في أبحاث السوق والاستشارات، يتمتع بخبرةٍ تزيد عن 9 سنوات في مشاريع مُخصصة ومُشتركة واستشارية. يشغل حاليًا منصب نائب الرئيس المساعد، وقد نجح في إدارة أصحاب المصلحة عبر سلسلة قيمة المشاريع، وألّف أكثر من 100 تقرير بحثي وأكثر من 30 مهمة استشارية. يمتد نطاق عمله ليشمل مشاريع صناعية وحكومية، مساهمًا بشكل كبير في نجاح العملاء واتخاذ القرارات القائمة على البيانات.
نافين حاصلٌ على شهادة في هندسة الإلكترونيات والاتصالات من جامعة فرجينيا التقنية، كارناتاكا، وشهادة ماجستير في إدارة الأعمال في التسويق والعمليات من جامعة مانيبال. وهو عضوٌ نشطٌ في معهد مهندسي الكهرباء والإلكترونيات (IEEE) لمدة 9 سنوات، حيث شارك في مؤتمراتٍ وندواتٍ تقنية، وتطوّع على مستوى الأقسام والمناطق. قبل منصبه الحالي، عمل مستشارًا استراتيجيًا مساعدًا في IndustryARC، ومستشارًا للخوادم الصناعية في شركة هيوليت باكارد (HP Global).
- التحليل التاريخي (سنتان)، سنة الأساس، التوقعات (7 سنوات) مع معدل النمو السنوي المركب
- تحليل PEST و SWOT
- حجم السوق والقيمة / الحجم - عالمي، إقليمي، بلد
- الصناعة والمنافسة
- مجموعة بيانات إكسل
التقارير الحديثة
تقارير ذات صلة
شهادات العملاء
تقرير سوق أنظمة SCADA من Insight Partners شامل، ويقدم رؤى قيّمة حول الاتجاهات الحالية والتوقعات المستقبلية. تميّز الفريق باحترافية عالية وسرعة في الاستجابة ودعم مستمر طوال الوقت. نحن راضون جدًا ونوصي بشدة بخدماتهم.
ران كيديم شريك, شركة ريالي تكنولوجيز المحدودةطلبتُ تقريرًا عن سوق برمجيات محدد، وأعدّه الفريق في غضون أيام قليلة. كانت المعلومات ذات صلة وثيقة وعرضها جيد. ثم طلبتُ بعض التعديلات والإضافات على التقرير. وكان الفريق متجاوبًا للغاية، وحصلتُ على التقرير النهائي في أقل من أسبوع.
جان هيرفيه جين رئيس مجلس الإدارة, فيوتشر أناليتيكاعملنا مع شركة "إنسايت بارتنرز" لإجراء دراسة سوقية وتوقعات مهمة. زودونا برؤى واضحة حول الفرص والمخاطر، مما ساعدنا في صياغة خططنا. كانت أبحاثهم سهلة الاستخدام ومبنية على بيانات دقيقة، مما ساعدنا على اتخاذ قرارات ذكية وواثقة. نوصي بهم بشدة.
بيوش ناجبال نائب الرئيس الأول, شعاع عالي عالميقدّمت شركة Insight Partners أبحاثًا سوقية ثاقبة ومنظمة جيدًا بخبرة واسعة في هذا المجال. تميّز فريقهم بالاحترافية وسرعة الاستجابة طوال الوقت. وسهّل موقعهم الإلكتروني سهل الاستخدام الوصول إلى تقارير القطاع. نوصي بهم بشدة لخدمات بحثية موثوقة وعالية الجودة.
يوكيهيكو أداتشي المدير التنفيذي, ديب بلو، ذ.م.م.هذه أول مرة أشتري فيها تقرير سوق من The Insight Partners. رغم أنني كنت مترددًا في البداية، إلا أنني زرت موقعهم الإلكتروني وشعرت براحة أكبر للمخاطرة وشراء تقرير السوق. أنا راضٍ تمامًا عن جودة التقرير وخدمة العملاء. كانت لديّ عدة أسئلة وتعليقات حول التقرير الأولي، ولكن بعد بضع محادثات عبر البريد الإلكتروني مع محللهم، أعتقد أن لديّ تقريرًا يمكنني استخدامه كمدخل لعملية التخطيط الاستراتيجي لدينا. شكرًا جزيلاً لكم على تخصيص وقتكم الإضافي وجعل هذه التجربة إيجابية. سأوصي بخدماتكم للآخرين بالتأكيد، وستكونون أول من ألجأ إليه عندما نحتاج إلى المزيد من بيانات السوق.
جون سوزوكي الرئيس والرئيس التنفيذي وعضو مجلس الإدارة, بي كيه تكنولوجيزأود أن أقدّر دعمكم واحترافيتكم في الاستجابة لطلبي للحصول على معلومات بشأن سوق التشخيص المخبري للأمراض المعدية في نيجيريا. كما أُقدّر صبركم وتوجيهكم، واستعدادكم لتقديم خصم، مما مكّننا في النهاية من إتمام الصفقة. أتطلع إلى التعامل مع "ذا إنسايت بارتنرز" مستقبلًا، كل ذلك بفضل الانطباع الذي تركتموه لديّ نتيجةً لهذا اللقاء الأول.
الدكتور تشيجيوك أونيا المدير الإداري, شركة باينكريست للرعاية الصحية المحدودةسبب الشراء
- اتخاذ قرارات مدروسة
- فهم ديناميكيات السوق
- تحليل المنافسة
- رؤى العملاء
- توقعات السوق
- تخفيف المخاطر
- التخطيط الاستراتيجي
- مبررات الاستثمار
- تحديد الأسواق الناشئة
- تحسين استراتيجيات التسويق
- تعزيز الكفاءة التشغيلية
- مواكبة التوجهات التنظيمية


 احصل على عينة مجانية ل - سوق أجهزة الاستشعار القابلة للارتداء