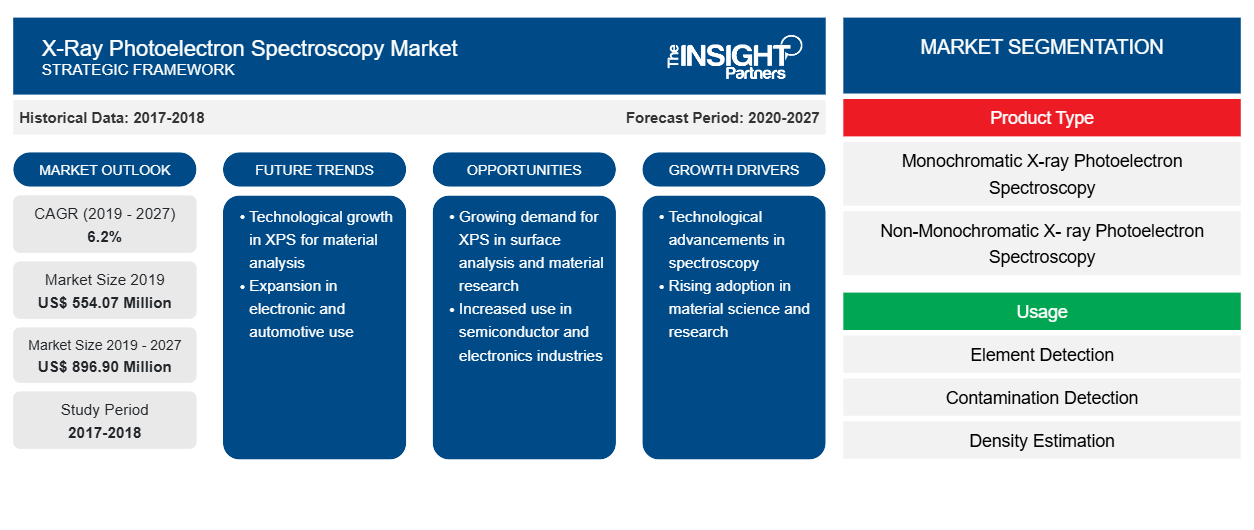
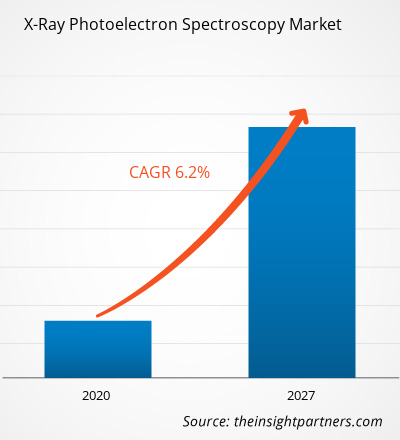
بلغت قيمة سوق مطيافية الفوتون الإلكتروني بالأشعة السينية 554.07 مليون دولار أمريكي في عام 2019 ومن المتوقع أن تنمو بمعدل نمو سنوي مركب قدره 6.2٪ من عام 2020 إلى عام 2027 لتصل إلى 896.90 مليون دولار أمريكي بحلول عام 2027.
إن مطيافية الأشعة السينية الضوئية الإلكترونية (XPS) هي تقنية طيفية كمية تستخدم لقياس التركيب العنصري والصيغة التجريبية والحالة الكيميائية والحالة الإلكترونية للعناصر الموجودة داخل عينة معينة. إن سوق مطيافية الأشعة السينية الضوئية الإلكترونية العالمية مدفوع بعوامل مثل الطلب المتزايد على المواد عالية الأداء وزيادة التمويل من قبل الهيئات الخاصة في البحث والتطوير، ولكن من المتوقع أن يؤدي نقص المهنيين المهرة إلى كبح نمو السوق خلال فترة التنبؤ. ومع ذلك، من المرجح أن توفر فرص التطوير في البلدان الناشئة فرص نمو كبيرة لتحسين حصة السوق للاعبين في الصناعة في المستقبل القريب.
رؤى السوق
تزايد الطلب على المواد عالية الأداء
إن تقنية مطيافية الأشعة السينية الضوئية الإلكترونية (XPS) هي تقنية تستخدم لتحليل كيمياء سطح المادة. وتُعرف تقنية XPS أيضًا باسم مطيافية الإلكترون للتحليل الكيميائي (ESCA)، وهي طريقة راسخة للتمييز الكيميائي لأسطح المواد. ويركز الموردون والمصنعون للمنسوجات التقنية والتجارية على تطوير XPS كأداة مثالية لدعم تحسين وتطوير أنواع طلاء السطح أو المعالجة التي يطلبها المستهلكون. تُستخدم شبكات البوليمر، مثل البوليستر والبولي بروبيلين، لإصلاح الفتق الجراحي وعيوب الأنسجة الرخوة الأخرى.
قم بتخصيص هذا التقرير ليناسب متطلباتك
ستحصل على تخصيص لأي تقرير - مجانًا - بما في ذلك أجزاء من هذا التقرير، أو تحليل على مستوى الدولة، وحزمة بيانات Excel، بالإضافة إلى الاستفادة من العروض والخصومات الرائعة للشركات الناشئة والجامعات
سوق مطيافية الأشعة السينية الضوئية الإلكترونية:
- احصل على أهم اتجاهات السوق الرئيسية لهذا التقرير.ستتضمن هذه العينة المجانية تحليلاً للبيانات، بدءًا من اتجاهات السوق وحتى التقديرات والتوقعات.
على الرغم من استخدام مواد شبكية في الجراحة، إلا أن غرسها قد يرتبط بمعدلات إصابة شديدة. ومن أجل تقليل معدلات الإصابة بهذه الشبكات، يجب تحسين خصائص سطحها. كما يمكن حل العديد من المشاكل المرتبطة بالمواد الحديثة من خلال فهم التفاعلات الكيميائية والفيزيائية التي تحدث عند واجهات طبقات المادة أو سطحها. سيؤثر السطح على عوامل مثل النشاط التحفيزي ومعدلات التآكل وقابلية البلل وخصائص الالتصاق وإمكانية التلامس وآليات الفشل. وبالتالي، فإن الطلب المتزايد على المواد عالية الأداء يزيد بشكل متناسب من سوق مطيافية الأشعة السينية الضوئية الإلكترونية في فترة التنبؤ.
رؤى حول نوع المنتج
تشمل قطاعات أنواع المنتجات في سوق مطيافية الأشعة السينية الضوئية الإلكترونية مطيافية الأشعة السينية الضوئية أحادية اللون ومطيافية الأشعة السينية الضوئية غير أحادية اللون. استحوذ قطاع مطيافية الأشعة السينية الضوئية أحادية اللون على أكبر حصة في سوق مطيافية الأشعة السينية الضوئية العالمية. يحتوي مطيافية الأشعة السينية الضوئية أحادية اللون على مصدر أشعة سينية أحادي اللون من الألومنيوم يمكنه تحليل مجموعة واسعة من العينات. عند استخدام أحادي اللون، تكون المسافة بين مصدر الأشعة السينية والعينة أكبر من استخدام مصدر غير أحادي اللون، وبالتالي يكون هناك خطر أقل لتلف العينة. لذلك، يوفر مطيافية الأشعة السينية الضوئية أحادية اللون العديد من المزايا مقارنة بمطيافية الأشعة السينية الضوئية غير أحادية اللون.
رؤى الاستخدام
تشمل قطاعات استخدام سوق مطيافية الأشعة السينية الضوئية الإلكترونية الكشف عن العناصر وتقدير الكثافة والكشف عن التلوث وتحديد الصيغة التجريبية وغيرها. شهد سوق الكشف عن العناصر أعلى حصة في عام 2019 ومن المتوقع أن يُظهر نموًا ملحوظًا خلال فترة التنبؤ بسبب التطبيقات المختلفة في مجالات مختلفة.
من حيث حصة السوق، تحتل عمليات اكتشاف التلوث المرتبة الثانية في قطاع الاستخدام. يمكن اكتشاف الملوثات العضوية وغير العضوية باستخدام XPS. يمكن إجراء تحليل سطحي للمعادن المركبة والزجاج والغازات والسوائل الممتصة بقوة باستخدام تطبيق XPS.
رؤى التطبيق
تشمل شريحة التطبيقات في هذه الدراسة الرعاية الصحية والفضاء والسيارات وغيرها. تشمل تطبيقات سوق الرعاية الصحية تحليل الخلايا/البكتيريا/الأنسجة، وتوصيف المواد الكيميائية، وتثبيت الأجسام المضادة، ودراسة البروتينات والببتيدات. في سوق الإلكترونيات، يتم تطبيق XPS لتحليل التركيب وتوصيفه. يتم استخدام XPS لإجراء تحليل للأغشية السطحية في سوق الفضاء والسيارات والتعبئة والتغليف.
استحوذ قطاع الرعاية الصحية على أكبر حصة سوقية في قطاع التطبيقات ومن المتوقع أن يهيمن على السوق خلال فترة التوقعات. وترجع الحصة الكبيرة إلى اللوائح الصارمة للحد من أخطاء الأدوية والمستوى المسموح به من الملوثات في الغرسات الطبية.
تتبنى الشركات عادة استراتيجية الدمج والاستحواذ لتوسيع نطاق وجودها في جميع أنحاء العالم وتلبية الطلب المتزايد. وتعتمد الشركات في السوق هذه الاستراتيجية بشكل شائع من أجل تعزيز محفظة منتجاتها.
يتبنى اللاعبون العاملون في سوق مطيافية الأشعة السينية الضوئية الإلكترونية استراتيجية التوسع والاستثمار في البحث والتطوير لتوسيع قاعدة العملاء في جميع أنحاء العالم، مما يسمح أيضًا للاعبين بالحفاظ على اسم علامتهم التجارية عالميًا.
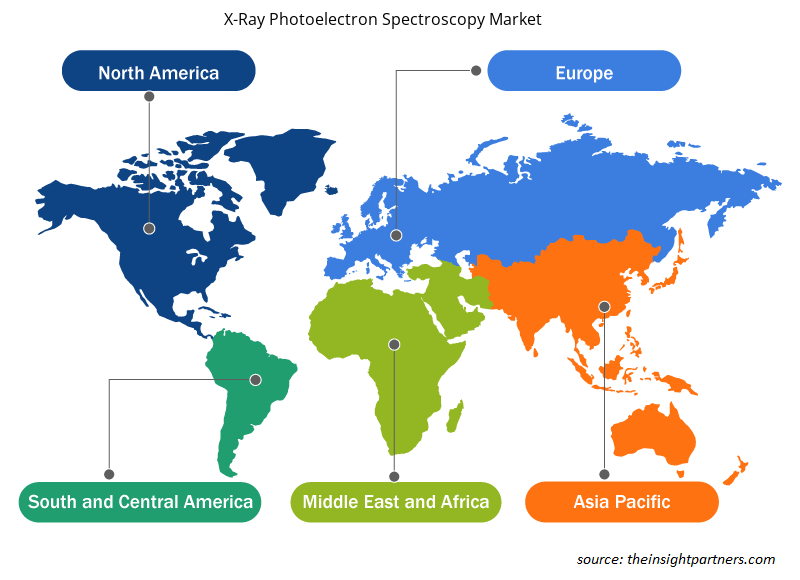
رؤى إقليمية حول سوق مطيافية الأشعة السينية الضوئية الإلكترونية
لقد قام المحللون في Insight Partners بشرح الاتجاهات والعوامل الإقليمية المؤثرة على سوق مطيافية الأشعة السينية الضوئية الإلكترونية طوال فترة التوقعات بشكل شامل. يناقش هذا القسم أيضًا قطاعات سوق مطيافية الأشعة السينية الضوئية الإلكترونية والجغرافيا في جميع أنحاء أمريكا الشمالية وأوروبا ومنطقة آسيا والمحيط الهادئ والشرق الأوسط وأفريقيا وأمريكا الجنوبية والوسطى.
- احصل على البيانات الإقليمية المحددة لسوق مطيافية الأشعة السينية الضوئية الإلكترونية
نطاق تقرير سوق مطيافية الأشعة السينية للفوتونات الإلكترونية
| سمة التقرير | تفاصيل |
|---|---|
| حجم السوق في عام 2019 | 554.07 مليون دولار أمريكي |
| حجم السوق بحلول عام 2027 | 896.90 مليون دولار أمريكي |
| معدل النمو السنوي المركب العالمي (2019 - 2027) | 6.2% |
| البيانات التاريخية | 2017-2018 |
| فترة التنبؤ | 2020-2027 |
| القطاعات المغطاة | حسب نوع المنتج
|
| المناطق والدول المغطاة | أمريكا الشمالية
|
| قادة السوق وملفات تعريف الشركات الرئيسية |
|
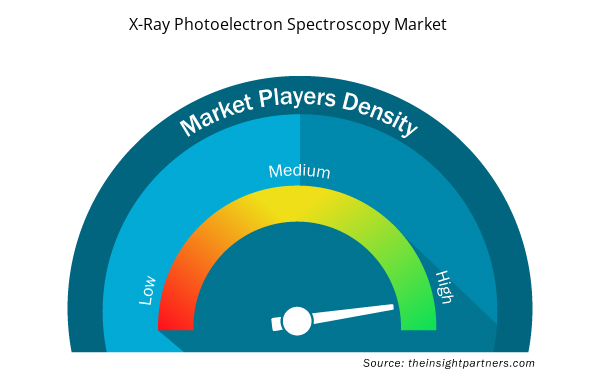
كثافة اللاعبين في سوق مطيافية الأشعة السينية للفوتون الإلكتروني: فهم تأثيرها على ديناميكيات الأعمال
يشهد سوق مطيافية الأشعة السينية الضوئية الإلكترونية نموًا سريعًا، مدفوعًا بالطلب المتزايد من المستخدم النهائي بسبب عوامل مثل تفضيلات المستهلك المتطورة والتقدم التكنولوجي والوعي المتزايد بفوائد المنتج. ومع ارتفاع الطلب، تعمل الشركات على توسيع عروضها والابتكار لتلبية احتياجات المستهلكين والاستفادة من الاتجاهات الناشئة، مما يؤدي إلى زيادة نمو السوق.
تشير كثافة اللاعبين في السوق إلى توزيع الشركات أو المؤسسات العاملة في سوق أو صناعة معينة. وهي تشير إلى عدد المنافسين (اللاعبين في السوق) الموجودين في مساحة سوق معينة نسبة إلى حجمها أو قيمتها السوقية الإجمالية.
الشركات الرئيسية العاملة في سوق مطيافية الأشعة السينية الضوئية الإلكترونية هي:
- شركة شيمادزو
- شركة الالكترونيات الفيزيائية
- شركة ثيرمو فيشر العلمية
- شركة اليابان للمختبرات البصرية للإلكترونات المحدودة
- شركة ريفيرا
إخلاء المسؤولية : الشركات المذكورة أعلاه ليست مرتبة بأي ترتيب معين.
- احصل على نظرة عامة على أهم اللاعبين الرئيسيين في سوق مطيافية الأشعة السينية للفوتون الإلكتروني
السوق العالمية لتقنية مطيافية الأشعة السينية الضوئية الإلكترونية – حسب نوع المنتج
- مطيافية الأشعة السينية أحادية اللون للفوتونات الإلكترونية
- مطيافية الأشعة السينية غير أحادية اللون للفوتونات الإلكترونية
السوق العالمية لتقنية مطيافية الأشعة السينية الضوئية الإلكترونية – حسب الاستخدام
- كشف العنصر
- كشف التلوث
- تحديد الصيغة التجريبية
- تقدير الكثافة
- آحرون
السوق العالمية لتقنية مطيافية الأشعة السينية الضوئية الإلكترونية – حسب التطبيق
- الرعاية الصحية
- الفضاء الجوي
- السيارات
- آحرون
سوق مطيافية الأشعة السينية الضوئية الإلكترونية – حسب الجغرافيا
أمريكا الشمالية
- نحن
- كندا
- المكسيك
أوروبا
- فرنسا
- ألمانيا
- إيطاليا
- المملكة المتحدة
- روسيا
- بقية أوروبا
آسيا والمحيط الهادئ
- الصين
- الهند
- كوريا الجنوبية
- اليابان
- أستراليا
- بقية آسيا والمحيط الهادئ
الشرق الأوسط وأفريقيا
- جنوب أفريقيا
- المملكة العربية السعودية
- الامارات العربية المتحدة
- بقية الشرق الأوسط وأفريقيا
أمريكا الجنوبية
- البرازيل
- الأرجنتين
- بقية أمريكا الجنوبية
نبذة عن الشركة
- شركة شيمادزو
- الالكترونيات الفيزيائية، المحدودة
- شركة ثيرمو فيشر العلمية
- شركة مختبرات البصريات الإلكترونية اليابانية المحدودة
- شركة ريفيرا
- شركة SPECS GmbH
- بريفاك
- علوم أوميكرون
- أدوات ستايب
- شركة OCI Vacuum Microengineering Inc.
- التحليل التاريخي (سنتان)، السنة الأساسية، التوقعات (7 سنوات) مع معدل النمو السنوي المركب
- تحليل PEST و SWOT
- حجم السوق والقيمة / الحجم - عالميًا وإقليميًا وقطريًا
- الصناعة والمنافسة
- مجموعة بيانات Excel


- Clinical Trial Supplies Market
- Glycomics Market
- Integrated Platform Management System Market
- Environmental Consulting Service Market
- Biopharmaceutical Contract Manufacturing Market
- Social Employee Recognition System Market
- Constipation Treatment Market
- Blood Collection Devices Market
- Fish Protein Hydrolysate Market
- Hot Melt Adhesives Market

Report Coverage
Revenue forecast, Company Analysis, Industry landscape, Growth factors, and Trends

Segment Covered
This text is related
to segments covered.

Regional Scope
North America, Europe, Asia Pacific, Middle East & Africa, South & Central America

Country Scope
This text is related
to country scope.
الأسئلة الشائعة
The XPS analytical service costs around US $100 for 3 elements, US $120 for 4 elements, US $140 for 5 elements and US $160 for 6 elements. However, starting from approximately $100 per sample, professional XPS characterization services may be different in different regions.
X-ray photoelectron spectroscopy (XPS) is a quantitative spectroscopic technique that is used to measure the elemental composition, empirical formula, chemical state and electronic state of the elements that exist within a given sample.
Driving factors such as growing demand for high performance materials across the globe and increasing funding by private bodies in R&D are expected to boost the market growth over the years. Moreover, development opportunities in emerging countries is likely to have a positive impact on the growth of the market in the coming years.
The List of Companies - X Ray Photoelectron Spectroscopy Market
- Shimadzu Corporation
- Physical Electronics Inc
- Thermo Fisher Scientific Inc
- Japan Electrons Optic Laboratory Company Limited
- Revera Incorporated
- Specs GMBH
- Prevac
- Scienta Omicron
- Staib Instruments
- OCI Vacuum Microengineering Inc.
The Insight Partners performs research in 4 major stages: Data Collection & Secondary Research, Primary Research, Data Analysis and Data Triangulation & Final Review.
- Data Collection and Secondary Research:
As a market research and consulting firm operating from a decade, we have published and advised several client across the globe. First step for any study will start with an assessment of currently available data and insights from existing reports. Further, historical and current market information is collected from Investor Presentations, Annual Reports, SEC Filings, etc., and other information related to company’s performance and market positioning are gathered from Paid Databases (Factiva, Hoovers, and Reuters) and various other publications available in public domain.
Several associations trade associates, technical forums, institutes, societies and organization are accessed to gain technical as well as market related insights through their publications such as research papers, blogs and press releases related to the studies are referred to get cues about the market. Further, white papers, journals, magazines, and other news articles published in last 3 years are scrutinized and analyzed to understand the current market trends.
- Primary Research:
The primarily interview analysis comprise of data obtained from industry participants interview and answers to survey questions gathered by in-house primary team.
For primary research, interviews are conducted with industry experts/CEOs/Marketing Managers/VPs/Subject Matter Experts from both demand and supply side to get a 360-degree view of the market. The primary team conducts several interviews based on the complexity of the markets to understand the various market trends and dynamics which makes research more credible and precise.
A typical research interview fulfils the following functions:
- Provides first-hand information on the market size, market trends, growth trends, competitive landscape, and outlook
- Validates and strengthens in-house secondary research findings
- Develops the analysis team’s expertise and market understanding
Primary research involves email interactions and telephone interviews for each market, category, segment, and sub-segment across geographies. The participants who typically take part in such a process include, but are not limited to:
- Industry participants: VPs, business development managers, market intelligence managers and national sales managers
- Outside experts: Valuation experts, research analysts and key opinion leaders specializing in the electronics and semiconductor industry.
Below is the breakup of our primary respondents by company, designation, and region:

Once we receive the confirmation from primary research sources or primary respondents, we finalize the base year market estimation and forecast the data as per the macroeconomic and microeconomic factors assessed during data collection.
- Data Analysis:
Once data is validated through both secondary as well as primary respondents, we finalize the market estimations by hypothesis formulation and factor analysis at regional and country level.
- Macro-Economic Factor Analysis:
We analyse macroeconomic indicators such the gross domestic product (GDP), increase in the demand for goods and services across industries, technological advancement, regional economic growth, governmental policies, the influence of COVID-19, PEST analysis, and other aspects. This analysis aids in setting benchmarks for various nations/regions and approximating market splits. Additionally, the general trend of the aforementioned components aid in determining the market's development possibilities.
- Country Level Data:
Various factors that are especially aligned to the country are taken into account to determine the market size for a certain area and country, including the presence of vendors, such as headquarters and offices, the country's GDP, demand patterns, and industry growth. To comprehend the market dynamics for the nation, a number of growth variables, inhibitors, application areas, and current market trends are researched. The aforementioned elements aid in determining the country's overall market's growth potential.
- Company Profile:
The “Table of Contents” is formulated by listing and analyzing more than 25 - 30 companies operating in the market ecosystem across geographies. However, we profile only 10 companies as a standard practice in our syndicate reports. These 10 companies comprise leading, emerging, and regional players. Nonetheless, our analysis is not restricted to the 10 listed companies, we also analyze other companies present in the market to develop a holistic view and understand the prevailing trends. The “Company Profiles” section in the report covers key facts, business description, products & services, financial information, SWOT analysis, and key developments. The financial information presented is extracted from the annual reports and official documents of the publicly listed companies. Upon collecting the information for the sections of respective companies, we verify them via various primary sources and then compile the data in respective company profiles. The company level information helps us in deriving the base number as well as in forecasting the market size.
- Developing Base Number:
Aggregation of sales statistics (2020-2022) and macro-economic factor, and other secondary and primary research insights are utilized to arrive at base number and related market shares for 2022. The data gaps are identified in this step and relevant market data is analyzed, collected from paid primary interviews or databases. On finalizing the base year market size, forecasts are developed on the basis of macro-economic, industry and market growth factors and company level analysis.
- Data Triangulation and Final Review:
The market findings and base year market size calculations are validated from supply as well as demand side. Demand side validations are based on macro-economic factor analysis and benchmarks for respective regions and countries. In case of supply side validations, revenues of major companies are estimated (in case not available) based on industry benchmark, approximate number of employees, product portfolio, and primary interviews revenues are gathered. Further revenue from target product/service segment is assessed to avoid overshooting of market statistics. In case of heavy deviations between supply and demand side values, all thes steps are repeated to achieve synchronization.
We follow an iterative model, wherein we share our research findings with Subject Matter Experts (SME’s) and Key Opinion Leaders (KOLs) until consensus view of the market is not formulated – this model negates any drastic deviation in the opinions of experts. Only validated and universally acceptable research findings are quoted in our reports.
We have important check points that we use to validate our research findings – which we call – data triangulation, where we validate the information, we generate from secondary sources with primary interviews and then we re-validate with our internal data bases and Subject matter experts. This comprehensive model enables us to deliver high quality, reliable data in shortest possible time.
 احصل على عينة مجانية لهذا التقرير