Busway-Markt – Erkenntnisse durch globale und regionale Analyse – Prognose bis 2031
Historische Daten : 2021-2022 | Basisjahr : 2023 | Prognosezeitraum : 2024-2031Marktgröße und -prognose für Stromschienen (2021–2031), Bericht über globale und regionale Anteile, Trends und Wachstumschancenanalysen: Nach Typen (Air Splicing Busway (BMC), Intensive Insulation Plug Busway (CMC), High Strength Enclosed Busway (CFW) und andere) und Anwendung (Gewerbegebäude, Wohngebäude, industrielle Infrastruktur und andere) und Geografie
- Status : Veröffentlichte Daten
- Berichtscode : TIPTE100000372
- Kategorie : Elektronik und Halbleiter
- Anzahl der Seiten : 150
- Verfügbare Berichtsformate :


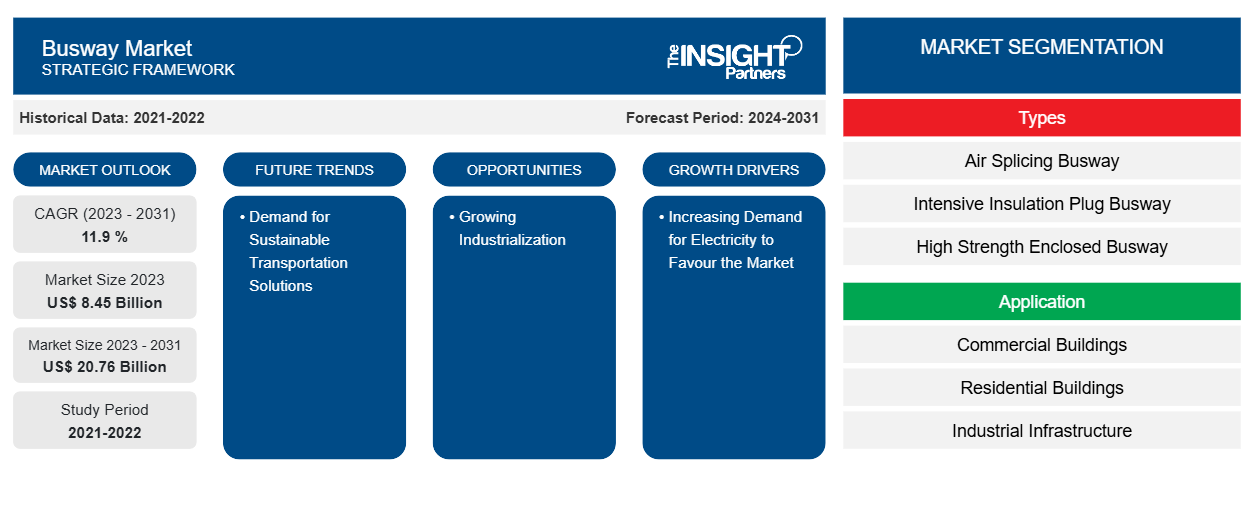
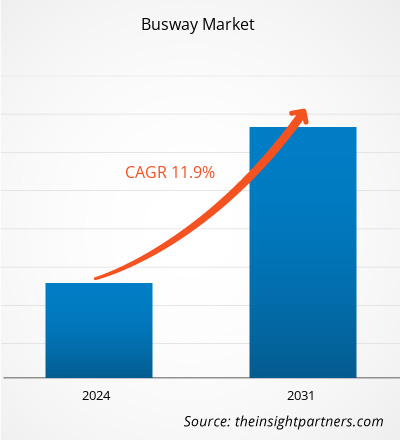
Der Markt für Schienenverteiler soll von 8,45 Milliarden US-Dollar im Jahr 2023 auf 20,76 Milliarden US-Dollar im Jahr 2031 anwachsen. Der Markt wird voraussichtlich zwischen 2023 und 2031 eine durchschnittliche jährliche Wachstumsrate von 11,9 % verzeichnen. Die steigende Nachfrage nach Elektrizität und die zunehmende Industrialisierung werden voraussichtlich weiterhin die wichtigsten Trends auf dem Schienenverteilermarkt bleiben.
Busway-Marktanalyse
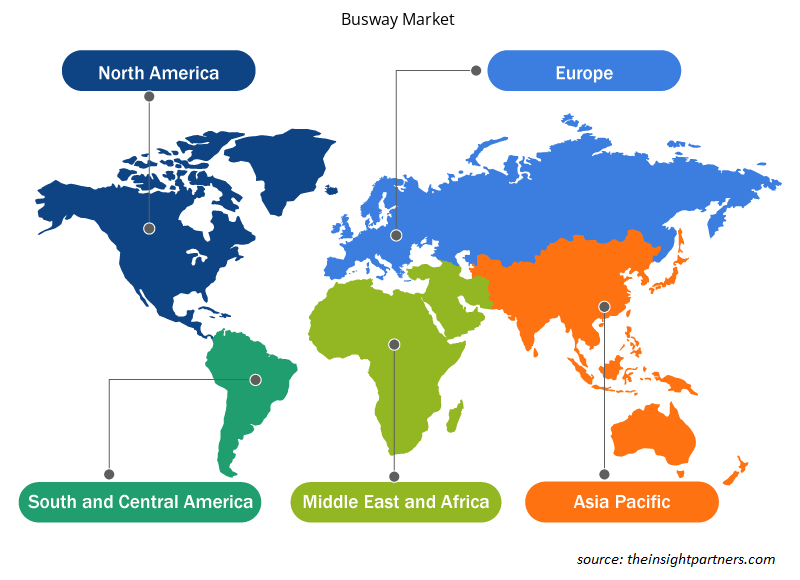
In den verschiedenen Regionen dieser Branche sind unterschiedliche Wachstumstrends zu beobachten. Die entwickelten Märkte Nordamerikas (NA) und Europas (ELI) machen einen erheblichen Teil des weltweiten Marktanteils aus; Entwicklungsländer in Regionen wie Asien-Pazifik (APAC), dem Nahen Osten und Afrika (ME), Afrika und Südamerika (SAM) verzeichnen jedoch aufgrund verschiedener Faktoren wie der Notwendigkeit der Elektrifizierung und des Wachstums neuer Industrien und Infrastrukturen ein rasantes Wachstum. Aufgrund des Ausbaus der Stromnetze und der Entwicklung erneuerbarer Energieanlagen weltweit wird die Nutzung von Stromschienen in den kommenden Jahren voraussichtlich rasant zunehmen.
Übersicht zum Busway-Markt
Die National Electrical Manufacturers Association (NEMA) definiert einen Schienenverteiler als vorgefertigtes elektrisches Verteilungssystem, das aus geraden Leitungen, Armaturen, Geräten und Zubehör besteht, die alle in einem Schutzgehäuse untergebracht sind. Schienenverteiler transportieren Strom und verbinden ihn mit elektrischen Geräten wie Transformatoren, Schalttafeln und Schaltanlagen . In gewerblichen und industriellen Anwendungen ist ein Schienenverteiler ein hervorragender Ersatz für Kabel und Leitungen, da er einfacher zu ersetzen, weniger teuer zu installieren und weniger Konfigurationsaufwand erfordert – insbesondere in Szenarien, in denen die Lastpositionen wahrscheinlich variieren.
Passen Sie diesen Bericht Ihren Anforderungen an
Sie erhalten kostenlose Anpassungen an jedem Bericht, einschließlich Teilen dieses Berichts oder einer Analyse auf Länderebene, eines Excel-Datenpakets sowie tolle Angebote und Rabatte für Start-ups und Universitäten.
Busway-Markt: Strategische Einblicke
-
Holen Sie sich die wichtigsten Markttrends aus diesem Bericht.Dieses KOSTENLOSE Beispiel umfasst eine Datenanalyse von Markttrends bis hin zu Schätzungen und Prognosen.
Treiber und Chancen auf dem Busway-Markt
Steigende Nachfrage nach Elektrizität begünstigt den Markt.
Der Stromverbrauch hat in den letzten Jahrzehnten zugenommen und ist heute für moderne Volkswirtschaften unverzichtbar. Aufgrund des steigenden verfügbaren Einkommens wird erwartet, dass dieser Bedarf in den kommenden Jahren weiter steigen wird. Der gestiegene Stromverbrauch hat zu einem Anstieg des Stromverbrauchs in Endverbraucherindustrien und Automobilen geführt. Es gibt zwei unterschiedliche geografische Muster für den Stromverbrauch. Gewinne bei der Energieeffizienz gleichen das zukünftige Wachstum aus, das mit der zunehmenden Elektrifizierung und Digitalisierung in fortgeschrittenen Volkswirtschaften einhergeht.
Zunehmende Industrialisierung
Die zunehmende Industrialisierung führt zur Entwicklung neuer Fabriken und Fertigungsanlagen, die eine robuste elektrische Infrastruktur für Antriebsmaschinen und -geräte benötigen, wodurch eine Nachfrage nach Stromschienensystemen zur effizienten Stromverteilung entsteht.busway systems to efficiently distribute electricity.
Segmentierungsanalyse des Busway-Marktberichts Market Report Segmentation Analysis
Wichtige Segmente, die zur Ableitung der Busway-Marktanalyse beigetragen haben, sind Typen und Anwendungen.busway market analysis are types and applications.
- Basierend auf den Typen ist der Schienenverteilermarkt in luftgekoppelte Schienenverteiler (BMC), Schienenverteiler mit intensiver Isolierung (CMC), hochfeste geschlossene Schienenverteiler (CFW) und andere unterteilt.busway market is divided into air splicing busways (BMC), intensive insulation plugs busways (CMC), high-strength enclosed busways (CFW), and others).
- Nach Anwendung ist der Markt in Gewerbegebäude, Wohngebäude, industrielle Infrastruktur und Sonstiges segmentiert.
Busway-Marktanteilsanalyse nach Geografie Market Share Analysis by Geography
Der geografische Umfang des Berichts zum Busway-Markt ist hauptsächlich in fünf Regionen unterteilt: Nordamerika, Asien-Pazifik, Europa, Naher Osten und Afrika sowie Südamerika/Süd- und Mittelamerika. Nordamerika hat den Busway-Markt dominiert. Trends zur Einführung hochtechnologischer Technologien in verschiedenen Branchen in der nordamerikanischen Region haben das Wachstum des Busway-Marktes vorangetrieben. Darüber hinaus zwingt eine starke Betonung von Forschung und Entwicklung in den entwickelten Volkswirtschaften der USA und Kanadas die nordamerikanischen Akteure dazu, technologisch fortschrittliche Lösungen auf den Markt zu bringen. Darüber hinaus gibt es in den USA viele Busway-Marktakteure, die sich zunehmend auf die Entwicklung innovativer Lösungen konzentrieren. All diese Faktoren tragen zum Wachstum des Busway-Marktes in der Region bei.busway market report is mainly divided into five regions: North America, Asia Pacific, Europe, Middle East & Africa, and South America/South & Central America. North America has dominated the busway market. High technology adoption trends in various industries in the North American region have fuelled the growth of the busway market. Moreover, a strong emphasis on research and development in the developed economies of the US and Canada is forcing the North American players to bring technologically advanced solutions into the market. In addition, the US has many busway market players who have been increasingly focusing on developing innovative solutions. All these factors contribute to the region's growth of the busway market.
Regionale Einblicke in den Busway-Markt Market Regional Insights
Die regionalen Trends und Faktoren, die den Busway-Markt im Prognosezeitraum beeinflussen, wurden von den Analysten von Insight Partners ausführlich erläutert. In diesem Abschnitt werden auch Busway-Marktsegmente und -Geografie in Nordamerika, Europa, im asiatisch-pazifischen Raum, im Nahen Osten und Afrika sowie in Süd- und Mittelamerika erörtert.Busway Market throughout the forecast period have been thoroughly explained by the analysts at Insight Partners. This section also discusses Busway Market segments and geography across North America, Europe, Asia Pacific, Middle East and Africa, and South and Central America.
- Holen Sie sich regionale Daten zum SchienenverteilermarktBusway Market
Umfang des Busway-Marktberichts
| Berichtsattribut | Details |
|---|---|
| Marktgröße im Jahr 2023 | 8,45 Milliarden US-Dollar |
| Marktgröße bis 2031 | 20,76 Milliarden US-Dollar |
| Globale CAGR (2023 - 2031) | 11,9 % |
| Historische Daten | 2021-2022 |
| Prognosezeitraum | 2024–2031 |
| Abgedeckte Segmente |
Nach Typ
|
| Abgedeckte Regionen und Länder |
Nordamerika
|
| Marktführer und wichtige Unternehmensprofile |
|
Dichte der Marktteilnehmer für Busbahnen: Die Auswirkungen auf die Geschäftsdynamik verstehen
Der Markt für Schienenverteiler wächst rasant, angetrieben durch die steigende Nachfrage der Endnutzer aufgrund von Faktoren wie sich entwickelnden Verbraucherpräferenzen, technologischen Fortschritten und einem größeren Bewusstsein für die Vorteile des Produkts. Mit steigender Nachfrage erweitern Unternehmen ihr Angebot, entwickeln Innovationen, um die Bedürfnisse der Verbraucher zu erfüllen, und nutzen neue Trends, was das Marktwachstum weiter ankurbelt.
Die Marktteilnehmerdichte bezieht sich auf die Verteilung der Firmen oder Unternehmen, die in einem bestimmten Markt oder einer bestimmten Branche tätig sind. Sie gibt an, wie viele Wettbewerber (Marktteilnehmer) in einem bestimmten Marktraum im Verhältnis zu seiner Größe oder seinem gesamten Marktwert präsent sind.
Die wichtigsten auf dem Schienenverteilermarkt tätigen Unternehmen sind:
- Schneider Electric
- Siemens
- Eaton
- LS Kabel und Systeme
- Netzstecker Busduct Sdn. Bhd.
- ABB
Haftungsausschluss : Die oben aufgeführten Unternehmen sind nicht in einer bestimmten Reihenfolge aufgeführt.
- Überblick über die wichtigsten Akteure auf dem Busway-Markt
Neuigkeiten und aktuelle Entwicklungen zum Schienenverteilermarkt
Der Busway-Markt wird durch die Erhebung qualitativer und quantitativer Daten nach Primär- und Sekundärforschung bewertet, die wichtige Unternehmensveröffentlichungen, Verbandsdaten und Datenbanken umfasst. Im Folgenden finden Sie eine Liste der Entwicklungen auf dem Markt:
- Im Juni 2021 gab das Energiemanagementunternehmen Eaton bekannt, dass es die Übernahme eines 50-prozentigen Anteils am Schienenverteilergeschäft von Jiangsu YiNeng Electric abgeschlossen habe. Das Unternehmen stellt Schienenverteilerprodukte in China her und vermarktet sie und erzielte im Jahr 2020 einen Umsatz von 60 Millionen US-Dollar.
(Quelle: Eaton, Pressemitteilung, 2021)
Abdeckung und Ergebnisse des Marktberichts zu Schienenverteilern
Der Bericht „Marktgröße und Prognose für Busway-Systeme (2021–2031)“ bietet eine detaillierte Analyse des Marktes, die die folgenden Bereiche abdeckt:
- Marktgröße und Prognose auf globaler, regionaler und Länderebene für alle wichtigen Marktsegmente, die im Rahmen des Projekts abgedeckt sind
- Marktdynamik wie Treiber, Beschränkungen und wichtige Chancen
- Wichtige Zukunftstrends
- Detaillierte PEST/Porters Five Forces- und SWOT-Analyse
- Globale und regionale Marktanalyse mit wichtigen Markttrends, wichtigen Akteuren, Vorschriften und aktuellen Marktentwicklungen
- Branchenlandschaft und Wettbewerbsanalyse, einschließlich Marktkonzentration, Heatmap-Analyse, prominenten Akteuren und aktuellen Entwicklungen
- Detaillierte Firmenprofile

Naveen ist ein erfahrener Marktforschungs- und Beratungsexperte mit über 9 Jahren Erfahrung in kundenspezifischen, syndizierten und Beratungsprojekten. In seiner aktuellen Funktion als Associate Vice President hat er erfolgreich Stakeholder entlang der gesamten Projektwertschöpfungskette gemanagt und ist Autor von über 100 Forschungsberichten und über 30 Beratungsaufträgen. Seine Arbeit erstreckt sich auf Industrie- und Regierungsprojekte und trägt maßgeblich zum Kundenerfolg und zur datengesteuerten Entscheidungsfindung bei.
Naveen hat einen Ingenieursabschluss in Elektronik und Kommunikation von der VTU, Karnataka, und einen MBA in Marketing und Operations von der Manipal University. Er ist seit 9 Jahren aktives IEEE-Mitglied und nimmt an Konferenzen und technischen Symposien teil und engagiert sich ehrenamtlich auf Sektions- und regionaler Ebene. Vor seiner aktuellen Position arbeitete er als Associate Strategic Consultant bei IndustryARC und als Industrial Server Consultant bei Hewlett Packard (HP Global).
- Historische Analyse (2 Jahre), Basisjahr, Prognose (7 Jahre) mit CAGR
- PEST- und SWOT-Analyse
- Marktgröße Wert/Volumen – Global, Regional, Land
- Branchen- und Wettbewerbslandschaft
- Excel-Datensatz
Erfahrungsberichte
Der SCADA-Systemmarktbericht von Insight Partners ist umfassend und bietet wertvolle Einblicke in aktuelle Trends und Zukunftsprognosen. Das Team war durchweg hochprofessionell, reaktionsschnell und hilfsbereit. Wir sind sehr zufrieden und können die Dienstleistungen wärmstens empfehlen.
RAN KEDEM Partner, Reali Technologies LTDsIch habe einen Bericht über einen sehr spezifischen Softwaremarkt angefordert, und das Team hat ihn innerhalb weniger Tage erstellt. Die Informationen waren sehr relevant und gut präsentiert. Anschließend habe ich einige Änderungen und Ergänzungen zum Bericht angefordert. Das Team reagierte erneut sehr schnell, und ich erhielt den Abschlussbericht in weniger als einer Woche.
JEAN-HERVE JENN Vorsitzende, Future AnalyticaWir haben mit The Insight Partners für eine wichtige Marktstudie und Prognose zusammengearbeitet. Sie gaben uns klare Einblicke in Chancen und Risiken, die uns bei der Gestaltung unserer Pläne halfen. Ihre Recherchen waren benutzerfreundlich und basierten auf soliden Daten. Sie halfen uns, kluge und sichere Entscheidungen zu treffen. Wir können sie wärmstens empfehlen.
PIYUSH NAGPAL Sr. Vizepräsident, Fernlicht GlobalDie Insight Partners lieferten aufschlussreiche, gut strukturierte Marktforschung mit fundierter Fachkompetenz. Ihr Team war durchweg professionell und reaktionsschnell. Die benutzerfreundliche Website ermöglichte den Zugriff auf Branchenberichte. Wir empfehlen sie wärmstens für zuverlässige und hochwertige Forschungsdienstleistungen.
YUKIHIKO ADACHI Geschäftsführer, Deep Blue, LLC.Dies ist das erste Mal, dass ich einen Marktbericht von The Insight Partners erworben habe. Obwohl ich zunächst unsicher war, besuchte ich die Website und fühlte mich dann sicherer, das Risiko einzugehen und einen Marktbericht zu kaufen. Ich bin mit der Qualität des Berichts und dem Kundenservice rundum zufrieden. Ich hatte einige Fragen und Anmerkungen zum ersten Bericht, aber nach einigen E-Mail-Gesprächen mit dem Analysten bin ich überzeugt, dass ich einen Bericht habe, den ich als Input für unseren strategischen Planungsprozess verwenden kann. Vielen Dank, dass Sie sich die Zeit genommen und dies zu einer positiven Erfahrung gemacht haben. Ich werde Ihren Service auf jeden Fall weiterempfehlen und Sie werden meine erste Anlaufstelle sein, wenn wir weitere Marktdaten benötigen.
JOHN SUZUKI Präsident und Chief Executive Officer, Vorstandsmitglied, BK TechnologiesIch möchte mich für Ihre Unterstützung und die Professionalität bedanken, die Sie bei der Bearbeitung meiner Informationsanfrage zum IVD-Markt für Infektionskrankheiten in Nigeria gezeigt haben. Ich schätze Ihre Geduld, Ihre Beratung und die Tatsache, dass Sie bereit waren, einen Rabatt anzubieten, der uns schließlich den Abschluss eines Geschäfts ermöglichte. Ich freue mich darauf, The Insight Partners in Zukunft wieder zu beauftragen, dank des Eindrucks, den Sie bei dieser ersten Begegnung bei mir hinterlassen haben.
DR. CHIJIOKE ONYIA GESCHÄFTSFÜHRERIN, PineCrest Healthcare Ltd.Grund zum Kauf
- Fundierte Entscheidungsfindung
- Marktdynamik verstehen
- Wettbewerbsanalyse
- Kundeneinblicke
- Marktprognosen
- Risikominimierung
- Strategische Planung
- Investitionsbegründung
- Identifizierung neuer Märkte
- Verbesserung von Marketingstrategien
- Steigerung der Betriebseffizienz
- Anpassung an regulatorische Trends


Exklusive Berichtsrabatte freischalten
Jetzt anfragen


 Kostenlose Probe anfordern für - Busway-Markt