Marktgröße, Trends, Anteile und Prognose für IR-Spektroskopie – 2030
Historische Daten : 2021-2022 | Basisjahr : 2023 | Prognosezeitraum : 2024-2031Marktgröße und Prognose für IR-Spektroskopie (2021 – 2031), Bericht über globale und regionale Anteile, Trends und Wachstumschancenanalysen: Nach Technologie (Nahinfrarot, Mittelinfrarot und Ferninfrarot), Produkttyp (Tischspektroskope, Mikrospektroskope, tragbare Spektroskope und gekoppelte Spektroskope) und Endbenutzer (Gesundheitswesen, Chemie, Öl und Gas, Lebensmittel und Getränke und andere Endbenutzer) und Geografie.
- Status : Veröffentlichte Daten
- Berichtscode : TIPRE00017506
- Kategorie : Elektronik und Halbleiter
- Anzahl der Seiten : 150
- Verfügbare Berichtsformate :


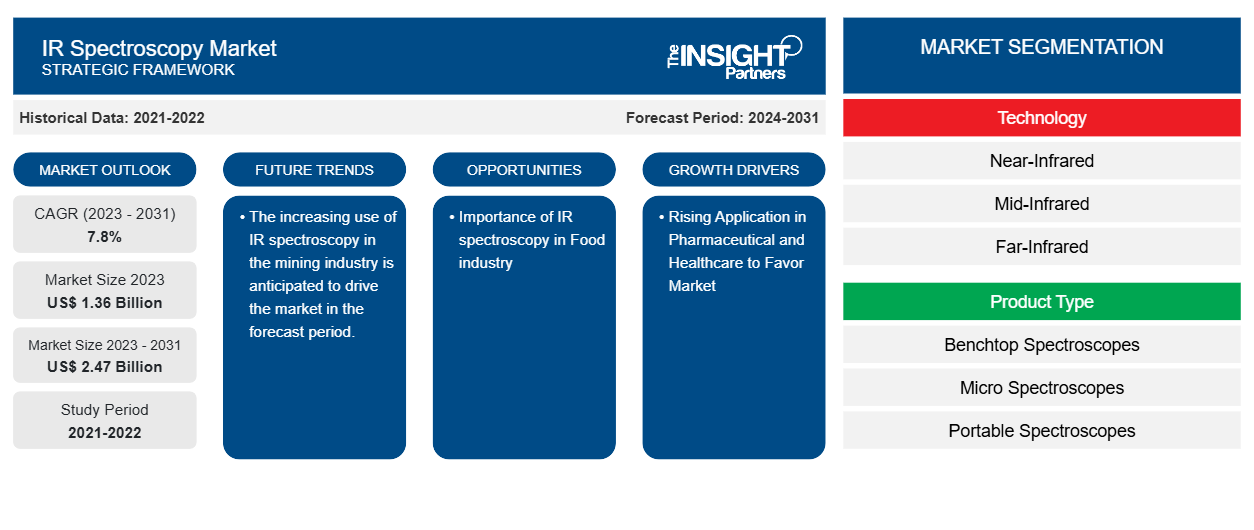
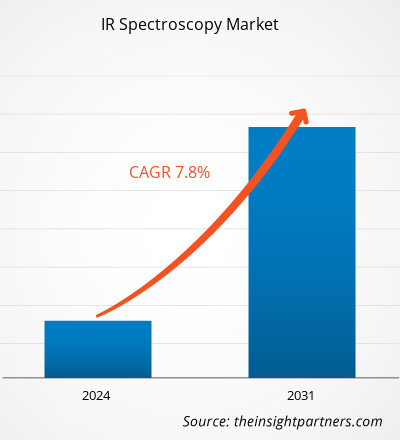
Der Markt für IR-Spektroskopie soll von 1,36 Milliarden US-Dollar im Jahr 2023 auf 2,47 Milliarden US-Dollar im Jahr 2031 anwachsen. Der Markt wird zwischen 2023 und 2031 voraussichtlich eine durchschnittliche jährliche Wachstumsrate von 7,8 % verzeichnen. Zunehmende Anwendungen in der Pharma- und Gesundheitsbranche sowie das aufkommende Wachstum in der Lebensmittelindustrie dürften weiterhin wichtige Trends und Treiber des Marktes bleiben.CAGR of 7.8% during 2023–2031. Increasing applications in the pharmaceutical and healthcare industries and emerging growth in the food industry are likely to remain key trends and drivers in the market.
IR-Spektroskopie Marktanalyse
Die Nachfrage auf dem IR-Spektroskopiemarkt wird voraussichtlich mit der steigenden Zahl von medizinischen Einrichtungen und klinischen Forschungszentren weltweit wachsen. Auch die zunehmende Anwendung in der Pharma- und Gesundheitsbranche und der wachsende Fokus auf IR-Spektroskopie in Schwellenländern sind ein Grund. Darüber hinaus wird erwartet, dass der Markt mit dem Wachstum in der Lebensmittelindustrie wächst.centres across the world. Also, the rising application in the pharmaceutical and healthcare industry and growing focus of IR spectroscopy in emerging economies. Moreover, the market is anticipated to grow with the rise in the food industry.
Marktübersicht für IR-Spektroskopie
Infrarotspektroskopie (IR-Spektroskopie) ist die Spektroskopie, die sich mit dem Infrarotbereich des elektromagnetischen Spektrums befasst, also mit Licht mit einer längeren Wellenlänge und niedrigeren Frequenz als sichtbares Licht. Sie umfasst eine Reihe von Techniken, die größtenteils auf Absorptionsspektroskopie basieren. Wie alle spektroskopischen Techniken kann sie zur Identifizierung und Untersuchung von Chemikalien verwendet werden.
Passen Sie diesen Bericht Ihren Anforderungen an
Sie erhalten kostenlos individuelle Anpassungen an jedem Bericht, einschließlich Teilen dieses Berichts oder einer Analyse auf Länderebene, eines Excel-Datenpakets sowie tolle Angebote und Rabatte für Start-ups und Universitäten.
IR-Spektroskopie-Markt: Strategische Einblicke
-
Holen Sie sich die wichtigsten Markttrends aus diesem Bericht.Dieses KOSTENLOSE Beispiel umfasst eine Datenanalyse von Markttrends bis hin zu Schätzungen und Prognosen.
Treiber und Chancen auf dem IR-Spektroskopie-Markt
Steigende Anwendung in der Pharmazie und im Gesundheitswesen begünstigt den Markt
Die alternde Bevölkerung dieser Welt leidet derzeit unter verschiedenen psychiatrischen und neurologischen Beeinträchtigungen . Darüber hinaus sind die Gehirnfunktionen dieser Patienten stark beeinträchtigt, was ihre Unabhängigkeit im täglichen Leben einschränkt. In diesen Fällen ist die IR-Spektroskopie sehr wichtig. Darüber hinaus wird die Nahinfrarotspektroskopie bei der Synthese und Reinigung von APIs (pharmazeutischen Wirkstoffen) und biopharmazeutischen Fermentationen eingesetzt. Die Technologie ist ideal, da sie für die Analyse komplexer Gemische entwickelt wurde.biopharmaceutical fermentations. The technology is ideal because it has been designed to analyze complex mixtures.
Bedeutung der IR-Spektroskopie in der Lebensmittelindustrie.
In den letzten Jahren hat sich die Methode der Infrarotspektroskopie zur Lebensmittelanalyse deutlich weiterentwickelt. Mithilfe der Infrarotspektroskopie kann eine Qualitätsanalyse mehrerer Lebensmittelgruppen wie Fleisch, Obst, Fisch, Gemüse, Milchprodukte, Eier und Getreide durchgeführt werden. Da sich die Technik der Infrarotspektroskopie in ihrer Anwendung in der Lebensmittelanalyse weiterentwickelt hat, ist sie schließlich zu einem zuverlässigen und leistungsstarken Werkzeug geworden. Die Methode bietet verschiedene Vorteile, die sie zum geeigneten Analysewerkzeug für viele Lebensmittelgruppen und Lebensmittelunternehmen machen.
Segmentierungsanalyse des IR-Spektroskopie-Marktberichts
Wichtige Segmente, die zur Ableitung der Marktanalyse zur IR-Spektroskopie beigetragen haben, sind Technologie, Produkttyp und Endbenutzer.
- Basierend auf der Technologie ist der IR-Spektroskopiemarkt in Nahinfrarot, Mittelinfrarot und Ferninfrarot unterteilt. Es wird erwartet, dass das Nahinfrarotsegment im Prognosezeitraum einen erheblichen Marktanteil halten wird.
- Basierend auf dem Produkttyp ist der IR-Spektroskopiemarkt in Tischspektroskope , Mikrospektroskope, tragbare Spektroskope und gekoppelte Spektroskope unterteilt. Das Segment der Tischspektroskope dürfte im Prognosezeitraum einen erheblichen Marktanteil halten.
- Nach Endverbraucher ist der Markt in Gesundheitswesen, Chemikalien, Öl und Gas, Lebensmittel und Getränke sowie andere Endverbraucher segmentiert. Es wird erwartet, dass das Gesundheitssegment im Prognosezeitraum einen erheblichen Marktanteil halten wird.
IR-Spektroskopie Marktanteilsanalyse nach Geografie
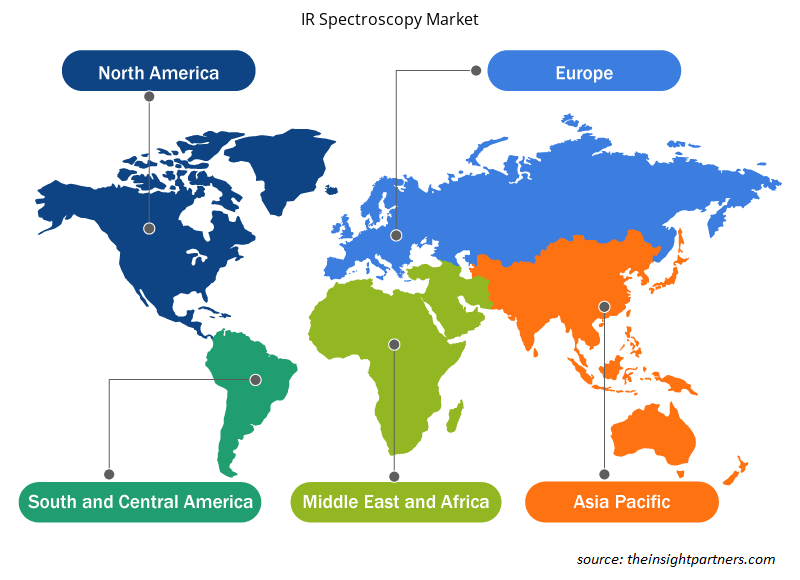
Der geografische Umfang des Marktberichts zur IR-Spektroskopie ist hauptsächlich in fünf Regionen unterteilt: Nordamerika, Asien-Pazifik, Europa, Naher Osten und Afrika sowie Süd- und Mittelamerika.
Nordamerika dominiert den Markt. Der Markt für IR-Spektroskopie wächst in Nordamerika aufgrund der starken Nachfragesteigerung nach IR-Spektroskopie in verschiedenen Branchen wie Gesundheitswesen, Pharmazie, Chemie sowie Lebensmittel und Getränke. Darüber hinaus macht die starke Betonung von Forschung und Entwicklung die Region technologisch fortschrittlich. Darüber hinaus gibt es in Nordamerika eine große Anzahl von Herstellern von IR-Spektroskopie. Aufgrund der oben genannten Parameter wächst der Markt für IR-Spektroskopie in Nordamerika.
Regionale Einblicke in den IR-Spektroskopie-Markt
Die regionalen Trends und Faktoren, die den IR-Spektroskopie-Markt im Prognosezeitraum beeinflussen, wurden von den Analysten von Insight Partners ausführlich erläutert. In diesem Abschnitt werden auch IR-Spektroskopie-Marktsegmente und -Geografie in Nordamerika, Europa, Asien-Pazifik, dem Nahen Osten und Afrika sowie Süd- und Mittelamerika erörtert.
- Erhalten Sie regionale Daten zum IR-Spektroskopie-Markt
Umfang des Marktberichts zur IR-Spektroskopie
| Berichtsattribut | Details |
|---|---|
| Marktgröße im Jahr 2023 | 1,36 Milliarden US-Dollar |
| Marktgröße bis 2031 | 2,47 Milliarden US-Dollar |
| Globale CAGR (2023 - 2031) | 7,8 % |
| Historische Daten | 2021-2022 |
| Prognosezeitraum | 2024–2031 |
| Abgedeckte Segmente |
Nach Technologie
|
| Abgedeckte Regionen und Länder |
Nordamerika
|
| Marktführer und wichtige Unternehmensprofile |
|
Marktteilnehmerdichte: Der Einfluss auf die Geschäftsdynamik
Der Markt für IR-Spektroskopie wächst rasant, angetrieben durch die steigende Nachfrage der Endnutzer aufgrund von Faktoren wie sich entwickelnden Verbraucherpräferenzen, technologischen Fortschritten und einem größeren Bewusstsein für die Vorteile des Produkts. Mit steigender Nachfrage erweitern Unternehmen ihr Angebot, entwickeln Innovationen, um die Bedürfnisse der Verbraucher zu erfüllen, und nutzen neue Trends, was das Marktwachstum weiter ankurbelt.
Die Marktteilnehmerdichte bezieht sich auf die Verteilung von Firmen oder Unternehmen, die in einem bestimmten Markt oder einer bestimmten Branche tätig sind. Sie gibt an, wie viele Wettbewerber (Marktteilnehmer) in einem bestimmten Marktraum im Verhältnis zu seiner Größe oder seinem gesamten Marktwert präsent sind.
Die wichtigsten auf dem IR-Spektroskopie-Markt tätigen Unternehmen sind:
- Agilent-Technologien
- Einschl.
- Bruker Corporation
- Hitachi
- GmbH.
- HORIBA LTD
Haftungsausschluss : Die oben aufgeführten Unternehmen sind nicht in einer bestimmten Reihenfolge aufgeführt.
- Überblick über die wichtigsten Akteure auf dem IR-Spektroskopie-Markt
IR-Spektroskopie-Marktnachrichten und aktuelle Entwicklungen
Der Markt für IR-Spektroskopie wird durch die Erhebung qualitativer und quantitativer Daten aus Primär- und Sekundärforschung bewertet, die wichtige Unternehmensveröffentlichungen, Verbandsdaten und Datenbanken umfasst. Nachfolgend sind einige der Entwicklungen auf dem Markt für IR-Spektroskopie aufgeführt:
- Wiley, einer der weltweit größten Verlage und weltweit führend in Forschung und Lehre, gab die Veröffentlichung der neuen Wiley Database of Predicted IR Spectra bekannt. Die Datenbank kombiniert über 60 Jahre Erfahrung in der Infrarotspektroskopie (IR) und der Kuratierung von Spektraldaten mit den aktuellsten Techniken des maschinellen Lernens, um die Anzahl der für die Spektralanalyse verfügbaren IR-Spektraldaten deutlich zu erweitern. (Quelle: Wiley, Unternehmenswebsite, November 2023)
- Edinburgh Instruments gab die Veröffentlichung seines neuen FTIR-Tischspektrometers IR5 bekannt, das an seinem weltweiten Hauptsitz in Schottland entwickelt und hergestellt wird. Das IR5 ist das erste Fourier-Transform-Infrarot-Spektrometer (FTIR) der Marke Edinburgh Instruments, die für ihre Expertise in der Instrumentierung für Raman-, Fluoreszenz- und UV-Vis-Absorptionsspektroskopie bekannt ist. (Quelle: Edinburgh Instruments, Unternehmenswebsite, März 2023)
Marktbericht zur IR-Spektroskopie – Umfang und Ergebnisse
Der Bericht „Marktgröße und Prognose für IR-Spektroskopie (2021–2031)“ bietet eine detaillierte Analyse des Marktes, die die folgenden Bereiche abdeckt:
- Marktgröße und Prognose für IR-Spektroskopie auf globaler, regionaler und Länderebene für alle abgedeckten wichtigen Marktsegmente.
- Markttrends im Bereich IR-Spektroskopie sowie Marktdynamik wie treibende Faktoren, Einschränkungen und wichtige Chancen.
- Detaillierte PEST/Porters Five Forces- und SWOT-Analyse.
- Marktanalyse zur IR-Spektroskopie, die wichtige Markttrends, globale und regionale Rahmenbedingungen, wichtige Akteure, Vorschriften und aktuelle Marktentwicklungen abdeckt.
- Branchenlandschaft und Wettbewerbsanalyse, einschließlich Marktkonzentration, Heatmap-Analyse, prominenten Akteuren und aktuellen Entwicklungen für den IR-Spektroskopiemarkt.
- Detaillierte Firmenprofile.

Naveen ist ein erfahrener Marktforschungs- und Beratungsexperte mit über 9 Jahren Erfahrung in kundenspezifischen, syndizierten und Beratungsprojekten. In seiner aktuellen Funktion als Associate Vice President hat er erfolgreich Stakeholder entlang der gesamten Projektwertschöpfungskette gemanagt und ist Autor von über 100 Forschungsberichten und über 30 Beratungsaufträgen. Seine Arbeit erstreckt sich auf Industrie- und Regierungsprojekte und trägt maßgeblich zum Kundenerfolg und zur datengesteuerten Entscheidungsfindung bei.
Naveen hat einen Ingenieursabschluss in Elektronik und Kommunikation von der VTU, Karnataka, und einen MBA in Marketing und Operations von der Manipal University. Er ist seit 9 Jahren aktives IEEE-Mitglied und nimmt an Konferenzen und technischen Symposien teil und engagiert sich ehrenamtlich auf Sektions- und regionaler Ebene. Vor seiner aktuellen Position arbeitete er als Associate Strategic Consultant bei IndustryARC und als Industrial Server Consultant bei Hewlett Packard (HP Global).
- Historische Analyse (2 Jahre), Basisjahr, Prognose (7 Jahre) mit CAGR
- PEST- und SWOT-Analyse
- Marktgröße Wert/Volumen – Global, Regional, Land
- Branchen- und Wettbewerbslandschaft
- Excel-Datensatz
Aktuelle Berichte
Erfahrungsberichte
Der SCADA-Systemmarktbericht von Insight Partners ist umfassend und bietet wertvolle Einblicke in aktuelle Trends und Zukunftsprognosen. Das Team war durchweg hochprofessionell, reaktionsschnell und hilfsbereit. Wir sind sehr zufrieden und können die Dienstleistungen wärmstens empfehlen.
RAN KEDEM Partner, Reali Technologies LTDsIch habe einen Bericht über einen sehr spezifischen Softwaremarkt angefordert, und das Team hat ihn innerhalb weniger Tage erstellt. Die Informationen waren sehr relevant und gut präsentiert. Anschließend habe ich einige Änderungen und Ergänzungen zum Bericht angefordert. Das Team reagierte erneut sehr schnell, und ich erhielt den Abschlussbericht in weniger als einer Woche.
JEAN-HERVE JENN Vorsitzende, Future AnalyticaWir haben mit The Insight Partners für eine wichtige Marktstudie und Prognose zusammengearbeitet. Sie gaben uns klare Einblicke in Chancen und Risiken, die uns bei der Gestaltung unserer Pläne halfen. Ihre Recherchen waren benutzerfreundlich und basierten auf soliden Daten. Sie halfen uns, kluge und sichere Entscheidungen zu treffen. Wir können sie wärmstens empfehlen.
PIYUSH NAGPAL Sr. Vizepräsident, Fernlicht GlobalDie Insight Partners lieferten aufschlussreiche, gut strukturierte Marktforschung mit fundierter Fachkompetenz. Ihr Team war durchweg professionell und reaktionsschnell. Die benutzerfreundliche Website ermöglichte den Zugriff auf Branchenberichte. Wir empfehlen sie wärmstens für zuverlässige und hochwertige Forschungsdienstleistungen.
YUKIHIKO ADACHI Geschäftsführer, Deep Blue, LLC.Dies ist das erste Mal, dass ich einen Marktbericht von The Insight Partners erworben habe. Obwohl ich zunächst unsicher war, besuchte ich die Website und fühlte mich dann sicherer, das Risiko einzugehen und einen Marktbericht zu kaufen. Ich bin mit der Qualität des Berichts und dem Kundenservice rundum zufrieden. Ich hatte einige Fragen und Anmerkungen zum ersten Bericht, aber nach einigen E-Mail-Gesprächen mit dem Analysten bin ich überzeugt, dass ich einen Bericht habe, den ich als Input für unseren strategischen Planungsprozess verwenden kann. Vielen Dank, dass Sie sich die Zeit genommen und dies zu einer positiven Erfahrung gemacht haben. Ich werde Ihren Service auf jeden Fall weiterempfehlen und Sie werden meine erste Anlaufstelle sein, wenn wir weitere Marktdaten benötigen.
JOHN SUZUKI Präsident und Chief Executive Officer, Vorstandsmitglied, BK TechnologiesIch möchte mich für Ihre Unterstützung und die Professionalität bedanken, die Sie bei der Bearbeitung meiner Informationsanfrage zum IVD-Markt für Infektionskrankheiten in Nigeria gezeigt haben. Ich schätze Ihre Geduld, Ihre Beratung und die Tatsache, dass Sie bereit waren, einen Rabatt anzubieten, der uns schließlich den Abschluss eines Geschäfts ermöglichte. Ich freue mich darauf, The Insight Partners in Zukunft wieder zu beauftragen, dank des Eindrucks, den Sie bei dieser ersten Begegnung bei mir hinterlassen haben.
DR. CHIJIOKE ONYIA GESCHÄFTSFÜHRERIN, PineCrest Healthcare Ltd.Grund zum Kauf
- Fundierte Entscheidungsfindung
- Marktdynamik verstehen
- Wettbewerbsanalyse
- Kundeneinblicke
- Marktprognosen
- Risikominimierung
- Strategische Planung
- Investitionsbegründung
- Identifizierung neuer Märkte
- Verbesserung von Marketingstrategien
- Steigerung der Betriebseffizienz
- Anpassung an regulatorische Trends


 Kostenlose Probe anfordern für - Markt für IR-Spektroskopie