
Marktbericht für Laborwaagen und -waagen 2028 nach Segmenten, Geografie, Dynamik, jüngsten Entwicklungen und strategischen Erkenntnissen
Marktprognose für Laborwaagen und -waagen bis 2028 – Auswirkungen von COVID-19 und globale Analyse nach Typ (Laborwaagen und Laborwaagen); Endbenutzer (Prüflabore für pharmazeutische/biotechnologische Produkte, Labore für kosmetische Produkte, akademische Institute, Forschungslabore) und Geografie
- Status : Veröffentlicht
- Berichtscode : TIPRE00004402
- Kategorie : Biowissenschaften
- Anzahl der Seiten : 188
- Verfügbare Berichtsformate :


- Datum der letzten Aktualisierung : June 13, 2024

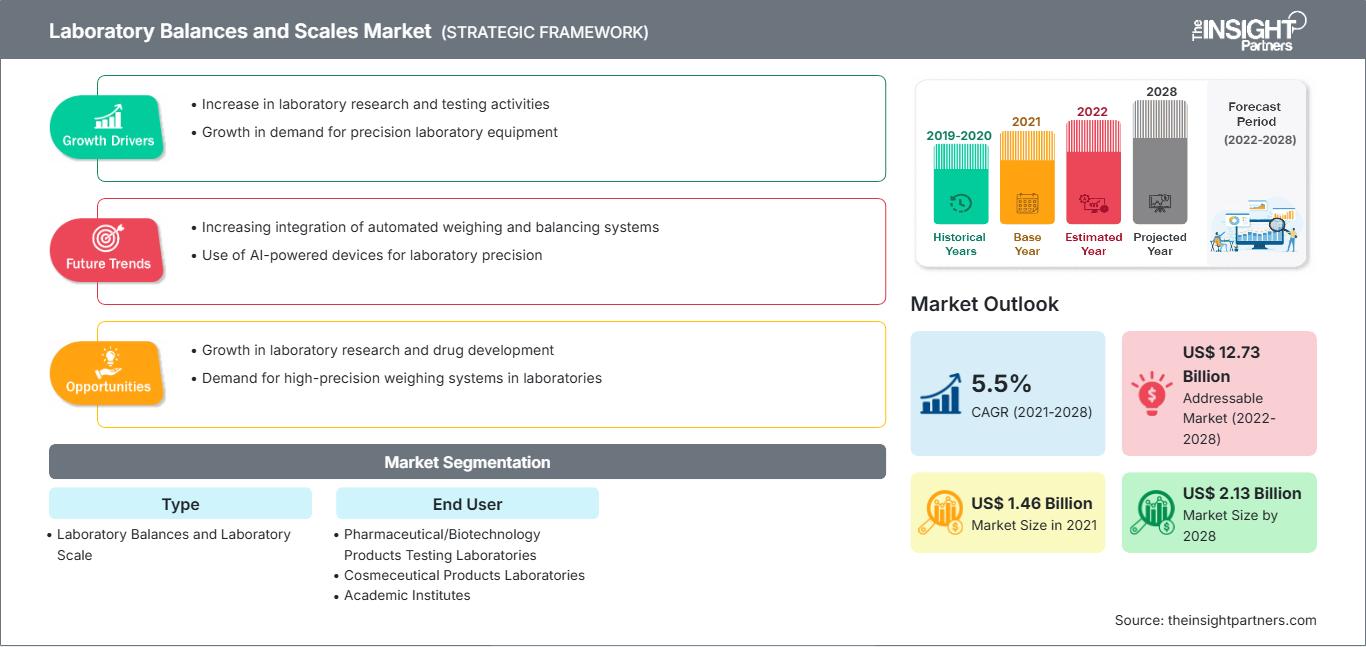
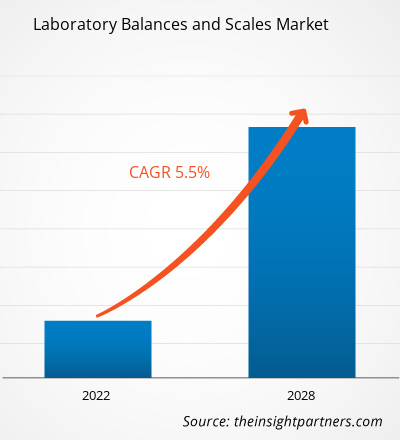
Der Markt für Laborwaagen wird voraussichtlich von 1.463,53 Millionen US-Dollar im Jahr 2021 auf 2.131,14 Millionen US-Dollar im Jahr 2028 anwachsen. Das Marktwachstum wird von 2021 bis 2028 auf durchschnittlich 5,5 % pro Jahr geschätzt.
Der Markt für Laborwaagen umfasst Typ, Endverbraucher und Region. Er ist regional in Nordamerika, Europa, Asien-Pazifik, Naher Osten und Afrika sowie Süd- und Mittelamerika unterteilt. Der Bericht bietet Einblicke und eine detaillierte Analyse des Marktes für Laborwaagen und -waagen und legt dabei den Schwerpunkt auf verschiedene Parameter wie Markttrends, technologische Fortschritte, Marktdynamik und eine Wettbewerbsanalyse führender Marktteilnehmer weltweit. Er enthält außerdem eine Analyse der Auswirkungen von COVID-19 auf alle Regionen.
Passen Sie diesen Bericht Ihren Anforderungen an
Sie erhalten kostenlos Anpassungen an jedem Bericht, einschließlich Teilen dieses Berichts oder einer Analyse auf Länderebene, eines Excel-Datenpakets sowie tolle Angebote und Rabatte für Start-ups und Universitäten.
Markt für Laborwaagen: Strategische Einblicke
-
Holen Sie sich die wichtigsten Markttrends aus diesem Bericht.Dieses KOSTENLOSE Beispiel umfasst Datenanalysen, die von Markttrends bis hin zu Schätzungen und Prognosen reichen.
Die Gesundheitsinfrastruktur erlebt weltweit ein starkes Wachstum der Anzahl klinischer Studien und Forschungspipelines. Klinische Studien sind ein entscheidender und wichtiger Schritt, um die Sicherheit und Wirksamkeit einer medizinischen Strategie, Behandlung oder eines Geräts für die kommerzielle Nutzung zu bewerten. Diese Studien helfen auch, die besten medizinischen Ansätze für ein bestimmtes Therapiegebiet zu verstehen und zu bestimmen. Klinische Studien werden in erster Linie durchgeführt, um Daten zur Sicherheit und Wirksamkeit der Entwicklung neuer Medikamente und Geräte zu sammeln. Vor der Zulassung von Arzneimittelmolekülen oder Medizinprodukten durch die Aufsichtsbehörden werden eine Reihe klinischer Studien durchgeführt.
Anzahl der registrierten Studien für klinische Studien|
Erste Veröffentlichung im Jahr |
Studien zu Jahresbeginn |
Studien im Jahresverlauf |
Studien am Ende Jahr |
|
2015 |
181.304 |
24.130 |
205.434 |
|
2016 |
205.434 |
27.809 |
233.243 |
|
2017 |
233.243 |
29.198 |
262.441 |
|
2018 |
262.441 |
17.836 |
280.277 |
|
2019 |
293.275 |
32.519 |
325.794 |
|
2020 |
325.794 |
36.740 |
362.534 |
Quelle: Clinical Trials.gov und The Insight Partners Analysis
Die steigende Zahl klinischer Studien beschleunigt die Nachfrage nach Laborinstrumenten und -geräten, was letztendlich den Markt für Laborwaagen im Prognosezeitraum ankurbeln wird.
Typbasierte Einblicke
Der Markt für Laborwaagen ist nach Typ in Laborwaagen und Laborwaagen unterteilt. Das Segment Laborwaagen ist weiter unterteilt in Analysenwaagen, Toplader-/Präzisionswaagen, Mikro- und Ultramikrowaagen, Feuchtewaagen, tragbare Waagen und sonstige Waagen. Das Segment Laborwaagen ist außerdem weiter unterteilt in Tischwaagen, Zählwaagen, Kompaktwaagen und sonstige Waagen. Das Segment Laborwaagen hatte 2021 den größten Marktanteil und wird im Prognosezeitraum voraussichtlich die höchste durchschnittliche jährliche Wachstumsrate (CAGR) von 5,8 % verzeichnen.
Laborwaagen
Regionale Einblicke in den Markt für LaborwaagenDie Analysten von The Insight Partners haben die regionalen Trends und Faktoren, die den Markt für Laborwaagen im Prognosezeitraum beeinflussen, ausführlich erläutert. In diesem Abschnitt werden auch die Marktsegmente und die geografische Lage in Nordamerika, Europa, dem asiatisch-pazifischen Raum, dem Nahen Osten und Afrika sowie Süd- und Mittelamerika erörtert.
Umfang des Marktberichts zu Laborwaagen
| Berichtsattribut | Einzelheiten |
|---|---|
| Marktgröße in 2021 | US$ 1.46 Billion |
| Marktgröße nach 2028 | US$ 2.13 Billion |
| Globale CAGR (2021 - 2028) | 5.5% |
| Historische Daten | 2019-2020 |
| Prognosezeitraum | 2022-2028 |
| Abgedeckte Segmente |
By Typ
|
| Abgedeckte Regionen und Länder |
Nordamerika
|
| Marktführer und wichtige Unternehmensprofile |
|
Dichte der Marktteilnehmer für Laborwaagen und -waagen: Verständnis ihrer Auswirkungen auf die Geschäftsdynamik
Der Markt für Laborwaagen wächst rasant. Die steigende Nachfrage der Endverbraucher ist auf Faktoren wie veränderte Verbraucherpräferenzen, technologische Fortschritte und ein stärkeres Bewusstsein für die Produktvorteile zurückzuführen. Mit der steigenden Nachfrage erweitern Unternehmen ihr Angebot, entwickeln Innovationen, um den Bedürfnissen der Verbraucher gerecht zu werden, und nutzen neue Trends, was das Marktwachstum weiter ankurbelt.
- Holen Sie sich die Markt für Laborwaagen Übersicht der wichtigsten Akteure
Der Markt für Laborwaagen und -waagen wird laut Indikation von Prüflaboren für pharmazeutische und biotechnologische Produkte, Laboren für kosmetische Produkte, akademischen Instituten und Forschungslaboren genutzt. Die Prüflabore für pharmazeutische und biotechnologische Produkte hatten 2020 den größten Marktanteil, und für dasselbe Segment wird im Prognosezeitraum die höchste durchschnittliche jährliche Wachstumsrate (CAGR) von 6,7 % erwartet.
Unternehmen setzen häufig auf anorganische Strategien wie Partnerschaften sowie Fusionen und Übernahmen, um der sich ändernden Kundennachfrage gerecht zu werden und ihren Markennamen weltweit zu behaupten. Marktteilnehmer, die auf dem Markt für Laborwaagen und -waagen tätig sind, verfolgen auch organische Strategien wie Produkteinführungen und -erweiterungen, um ihre Präsenz und ihr Produktportfolio weltweit zu erweitern und die wachsende Nachfrage zu befriedigen.
Nach Typ
- Laborwaagen
- Analysewaagen
- Toplader-/Präzisionswaagen
- Mikro- und Ultramikrowaagen
- Feuchtigkeitswaagen
- Tragbare Waagen
- Sonstige Waagen
- Laborwaagen
- Tischwaagen
- Zählwaagen
- Kompaktwaagen
- Sonstige Waagen
Nach Endbenutzer
- Prüflabore für pharmazeutische und biotechnologische Produkte
- Labore für kosmetische Produkte
- Akademische Institute
- Forschungslabore
Nach Geografie
- Nordamerika
- USA
- Kanada
- Mexiko
- Europa
- Frankreich
- Deutschland
- Italien
- Großbritannien
- Spanien
- Restliches Europa
- Asien-Pazifik (APAC)
- China
- Indien
- Südkorea
- Japan
- Australien
- Restliches APAC
- Naher Osten & Afrika (MEA)
- Südafrika
- Saudi-Arabien
- VAE
- Rest von MEA
- Süd- und Mittelamerika (SCAM)
- Brasilien
- Argentinien
- Rest von SCAM
Firmenprofile
- METTLER TOLEDO
- Sartorius AG
- PCE Instruments
- OHAUS
- Adam Equipment Ltd
- GRAM PRECISION
- RADWAG Balances and Scales
- Scientech Inc.
- BONSO Electronics International Inc.
- A&D Company, Limited

Mrinal ist eine erfahrene Research-Analystin mit über 8 Jahren Erfahrung in der Marktanalyse und Beratung im Bereich Life Sciences. Mit ihrer strategischen Denkweise und ihrem unerschütterlichen Streben nach Exzellenz hat sie sich umfassende Expertise in den Bereichen Pharmaprognosen, Marktchancenbewertung und Entwicklung von Branchen-Benchmarks angeeignet. Ihre Arbeit konzentriert sich darauf, umsetzbare Erkenntnisse zu liefern, die Kunden fundierte strategische Entscheidungen ermöglichen. Mrinals Kernkompetenz liegt in der Übersetzung komplexer quantitativer Datensätze in aussagekräftige Geschäftsinformationen. Ihr analytischer Scharfsinn ist entscheidend für die Entwicklung von Go-to-Market-Strategien (GTM) und die Erschließung von Wachstumschancen in der Pharma- und Medizinproduktebranche. Als vertrauenswürdige Beraterin konzentriert sie sich konsequent auf die Optimierung von Arbeitsabläufen und die Etablierung von Best Practices, um so Innovation und Betriebseffizienz für ihre Kunden zu fördern.
- Umfassende Analyse der Marktgröße und Prognosen
- Detaillierte Segmentierungsanalyse
- Tiefgehende Bewertung der Marktdynamik
- Einblicke auf regionaler und nationaler Ebene
- Wettbewerbslandschaft und Unternehmens-Benchmarking
- Strategische Business Intelligence
Erfahrungsberichte
Der SCADA-Systemmarktbericht von Insight Partners ist umfassend und bietet wertvolle Einblicke in aktuelle Trends und Zukunftsprognosen. Das Team war durchweg hochprofessionell, reaktionsschnell und hilfsbereit. Wir sind sehr zufrieden und können die Dienstleistungen wärmstens empfehlen.
RAN KEDEM Partner, Reali Technologies LTDsIch habe einen Bericht über einen sehr spezifischen Softwaremarkt angefordert, und das Team hat ihn innerhalb weniger Tage erstellt. Die Informationen waren sehr relevant und gut präsentiert. Anschließend habe ich einige Änderungen und Ergänzungen zum Bericht angefordert. Das Team reagierte erneut sehr schnell, und ich erhielt den Abschlussbericht in weniger als einer Woche.
JEAN-HERVE JENN Vorsitzende, Future AnalyticaWir haben mit The Insight Partners für eine wichtige Marktstudie und Prognose zusammengearbeitet. Sie gaben uns klare Einblicke in Chancen und Risiken, die uns bei der Gestaltung unserer Pläne halfen. Ihre Recherchen waren benutzerfreundlich und basierten auf soliden Daten. Sie halfen uns, kluge und sichere Entscheidungen zu treffen. Wir können sie wärmstens empfehlen.
PIYUSH NAGPAL Sr. Vizepräsident, Fernlicht GlobalDie Insight Partners lieferten aufschlussreiche, gut strukturierte Marktforschung mit fundierter Fachkompetenz. Ihr Team war durchweg professionell und reaktionsschnell. Die benutzerfreundliche Website ermöglichte den Zugriff auf Branchenberichte. Wir empfehlen sie wärmstens für zuverlässige und hochwertige Forschungsdienstleistungen.
YUKIHIKO ADACHI Geschäftsführer, Deep Blue, LLC.Dies ist das erste Mal, dass ich einen Marktbericht von The Insight Partners erworben habe. Obwohl ich zunächst unsicher war, besuchte ich die Website und fühlte mich dann sicherer, das Risiko einzugehen und einen Marktbericht zu kaufen. Ich bin mit der Qualität des Berichts und dem Kundenservice rundum zufrieden. Ich hatte einige Fragen und Anmerkungen zum ersten Bericht, aber nach einigen E-Mail-Gesprächen mit dem Analysten bin ich überzeugt, dass ich einen Bericht habe, den ich als Input für unseren strategischen Planungsprozess verwenden kann. Vielen Dank, dass Sie sich die Zeit genommen und dies zu einer positiven Erfahrung gemacht haben. Ich werde Ihren Service auf jeden Fall weiterempfehlen und Sie werden meine erste Anlaufstelle sein, wenn wir weitere Marktdaten benötigen.
JOHN SUZUKI Präsident und Chief Executive Officer, Vorstandsmitglied, BK TechnologiesIch möchte mich für Ihre Unterstützung und die Professionalität bedanken, die Sie bei der Bearbeitung meiner Informationsanfrage zum IVD-Markt für Infektionskrankheiten in Nigeria gezeigt haben. Ich schätze Ihre Geduld, Ihre Beratung und die Tatsache, dass Sie bereit waren, einen Rabatt anzubieten, der uns schließlich den Abschluss eines Geschäfts ermöglichte. Ich freue mich darauf, The Insight Partners in Zukunft wieder zu beauftragen, dank des Eindrucks, den Sie bei dieser ersten Begegnung bei mir hinterlassen haben.
DR. CHIJIOKE ONYIA GESCHÄFTSFÜHRERIN, PineCrest Healthcare Ltd.Grund zum Kauf
- Fundierte Entscheidungsfindung
- Marktdynamik verstehen
- Wettbewerbsanalyse
- Kundeneinblicke
- Marktprognosen
- Risikominimierung
- Strategische Planung
- Investitionsbegründung
- Identifizierung neuer Märkte
- Verbesserung von Marketingstrategien
- Steigerung der Betriebseffizienz
- Anpassung an regulatorische Trends


