
Marktstrategien für Probe Cards, Top-Player, Wachstumschancen, Analyse und Prognose bis 2028
Marktprognose für Prüfkarten bis 2028 – Auswirkungen von COVID-19 und globale Analyse nach Typ (Advanced Probe Card und Standard Probe Card), Technologie (MEMS, Cantilever und vertikal) und Anwendung (Foundry und Logik, DRAM, Flash und andere Anwendungen)
- Status : Veröffentlicht
- Berichtscode : TIPRE00009898
- Kategorie : Elektronik und Halbleiter
- Anzahl der Seiten : 133
- Verfügbare Berichtsformate :


- Datum der letzten Aktualisierung : June 18, 2024

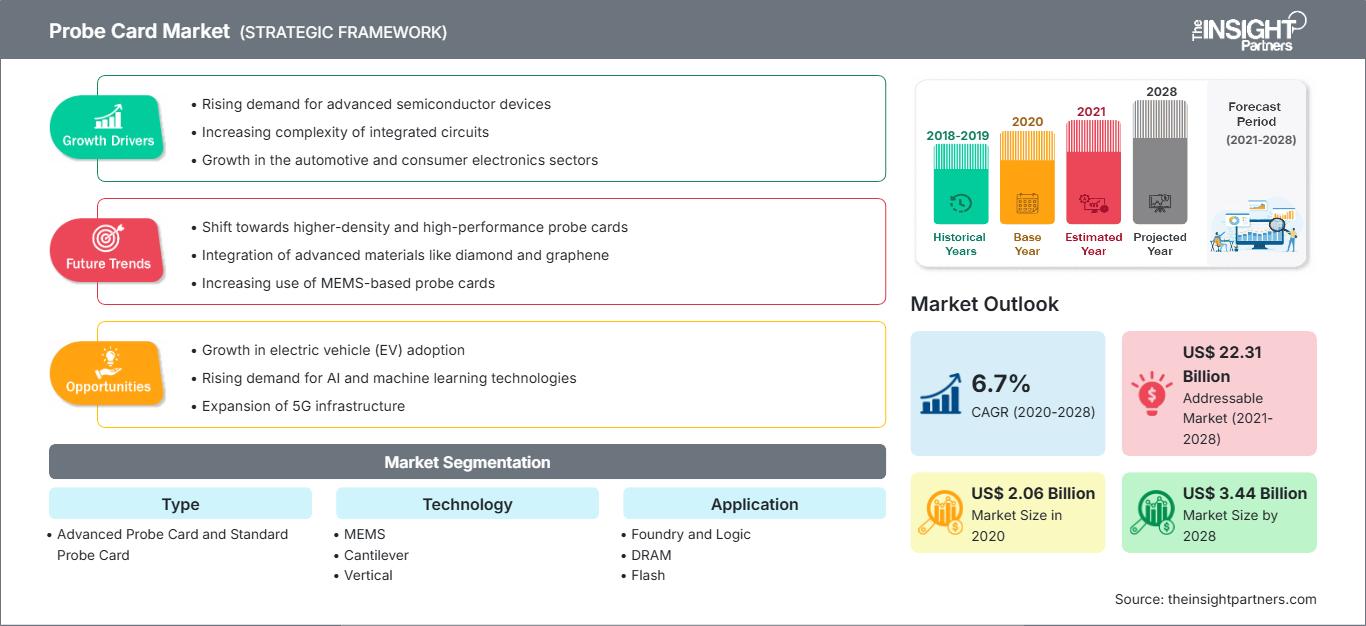
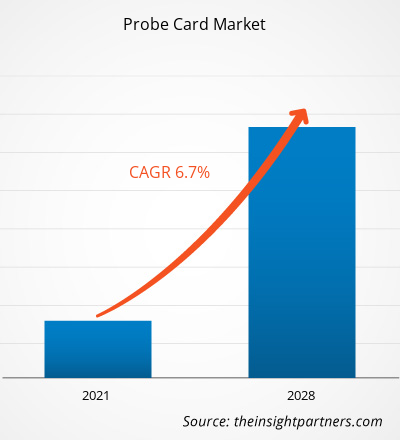
Der Markt für Probe Cards soll von 2.059,80 Millionen US-Dollar im Jahr 2020 auf 3.436,80 Millionen US-Dollar im Jahr 2028 anwachsen; für den Zeitraum 2021–2028 wird ein gesundes Marktwachstum von 6,7 % CAGR erwartet.
Eine Probe Card ist eine Schnittstelle, die das Testen eines Halbleiter-Wafers ermöglicht. Im ersten Schritt der Halbleiterherstellung wird dieses Verfahren verwendet, um die Qualität integrierter Schaltkreise oder die latente semantische Indizierung zu beurteilen. In den meisten Fällen wird die Probe Card mechanisch an einen Prober angedockt und elektrisch mit einem Tester verbunden. Der Hauptzweck einer Probe Card besteht darin, eine elektrische Verbindung zwischen dem Testgerät und den Schaltkreisen auf dem Wafer herzustellen, um das Testen der Schaltkreise zu ermöglichen. Leiterplatten (PCB) und verschiedene Arten von Kontaktelementen sind die grundlegenden Komponenten von Probe Cards. Eine Prüfkarte berücksichtigt eine Vielzahl von Elementen, von denen einige recht häufig vorkommen und andere einen sehr spezifischen Einsatzzweck haben.
Das Geschäft mit Unterhaltungselektronik hat sich aufgrund der zunehmenden Nutzung von Mobiltelefonen, Desktops, Digitalkameras, Tablets, Laptops, Festplatten und Fernsehern sowie der kontinuierlichen Forschung und Einführung neuer Technologien weiterentwickelt. Die Einführung intelligenter Geräte und des Internets der Dinge sowie die zunehmende Akzeptanz von Tablets und die sprunghaft ansteigende Nachfrage nach Geräten mit riesigen Bildschirmen tragen allesamt zum Wachstum des Prüfmarktes bei. Die Nachfrage nach Halbleitern wurde durch Veränderungen der Chipgrößentrends und eine zunehmende Vorliebe für kreative Architektur in verschiedenen elektronischen Produkten angeheizt. Die zunehmende Größe der IC-Chip-Fertigung führte zu einem Boom bei der Nachfrage nach Elektroniktests, was den Bedarf an Prüfkarten in die Höhe treibt. Die Einbindung moderner Technologien wie KI und IoT in die Ausrüstung zur Halbleiterproduktion wird deren Akzeptanz in den Fertigungsanlagen beschleunigen. Darüber hinaus tragen der gestiegene Bedarf an siliziumbasierten Sensoren für IoT-Geräte, die wachsende Präsenz der Chipindustrie in Schwellenländern sowie die zunehmende Anzahl von Rechenzentren und Servern zur Leistungssteigerung der Halbleiterindustrie bei, was wiederum zur Nachfrage nach Prüfkarten beiträgt.
Der weltweite Lockdown zur Minimierung der Virusübertragung hat die Lieferketten und das Produktionsvolumen mehrerer Hersteller, insbesondere kleiner und mittlerer Unternehmen, erheblich beeinträchtigt. Die Halbleiterindustrie erlitt einen erheblichen Rückschlag, da die Nachfrage nach elektronischen Komponenten seitens der Industrie und der Endverbraucher zurückging. Das Umsatzmodell für Mikroelektronik brach ein, da während des Lockdowns keine Massenproduktion stattfand. Nach dem Lockdown konnte die Halbleiterindustrie Marktanteile zurückgewinnen, da die Produktionsanlagen unter Einhaltung der Abstandsregeln wieder ihren Betrieb aufnahmen. Darüber hinaus trugen Homeoffice- und Fernüberwachungsstrategien dazu bei, den Absatz fortschrittlicher Elektronikprodukte für eine bessere Konnektivität zu steigern. Die Bedeutung der IT- und Telekommunikationsbranche für die Kommunikation wurde hervorgehoben, was der Branche die Weiterentwicklung mit neuen Technologien wie IoT-Konnektivität und Hochgeschwindigkeits-WLAN-kompatibler Gehäusetechnologie ermöglichte.
Passen Sie diesen Bericht Ihren Anforderungen an
Sie erhalten kostenlos Anpassungen an jedem Bericht, einschließlich Teilen dieses Berichts oder einer Analyse auf Länderebene, eines Excel-Datenpakets sowie tolle Angebote und Rabatte für Start-ups und Universitäten.
Probe Card Markt: Strategische Einblicke
-
Holen Sie sich die wichtigsten Markttrends aus diesem Bericht.Dieses KOSTENLOSE Beispiel umfasst Datenanalysen, die von Markttrends bis hin zu Schätzungen und Prognosen reichen.
Laut dem Marktbericht für Probe Cards wird erwartet, dass der asiatisch-pazifische Raum den größten Anteil am globalen Markt für Probe Cards halten wird. Der asiatisch-pazifische Raum umfasst die größten und dynamischsten Volkswirtschaften wie China, Indien, Japan, Australien und Südkorea. Taiwan, China und Japan sind die führenden Halbleiterhersteller im asiatisch-pazifischen Raum. Das steigende verfügbare Einkommen in Entwicklungsländern wie Indien und China führt zu einer großen Kundenbasis für Hightech-Unterhaltungselektronik wie Smart Wearables, Smartphones und Elektrofahrzeuge. Dieser Faktor wird voraussichtlich den Markt für Probe Cards in der Region ankurbeln. China ist ein führendes Produktionszentrum für Produkte auf Basis der IC-Gehäusetechnologie, während Taiwan, Südkorea und Japan ebenfalls erheblich zum regionalen Marktwachstum beitragen. Viele Länder im asiatisch-pazifischen Raum zeichnen sich durch die Massenproduktion von elektronischen Geräten aus, die für Unterhaltungselektronik, Automobilkomponenten, Telekommunikationsgeräte und andere Industriemaschinen benötigt werden. Die steigende Zahl von Elektronikfertigungsunternehmen in Indien und China, bedingt durch die große Verfügbarkeit qualifizierter Arbeitskräfte, treibt das Wachstum des Prüfkartenmarktes voran.
Marktsegmente für Prüfkarten
Basierend auf der Marktanalyse für Prüfkarten wird der Markt nach Typ, Technologie, Anwendung und Geografie segmentiert. Basierend auf dem Typ wird der Prüfkartenmarkt in erweiterte Prüfkarten und Standard-Prüfkarten segmentiert. Auf Basis der Technologie wird der Prüfkartenmarkt in MEMS, Cantilever und vertikal segmentiert. Und basierend auf der Anwendung wird der Prüfkartenmarkt in Gießerei und Logik, DRAM, Flash und Sonstige segmentiert. Die geografische Analyse wird basierend auf Regionen wie Nordamerika, Europa, Asien-Pazifik (APAC) und Rest der Welt (RoW) durchgeführt.
Einige der wichtigsten Akteure auf dem Prüfkartenmarkt sind FEINMETALL GmbH; FormFactor; Fujitsu; GGB Industries; Japan Electronic Materials Corporation; Korea Instrument Co., Ltd.; Micronics Japan Co., Ltd.; MPI Corporation; SV Probe; und Technoprobe SpA
Markteinblicke nach Prüfkartentypen
Der globale Prüfkartenmarkt ist nach Typen unterteilt in erweiterte Prüfkarten und Standard-Prüfkarten. Prüfkarten sind Schnittstellen oder Platinen für Wafertests an Halbleiterwafern. Es gibt im Wesentlichen drei Arten von Tests, die mit Prüfkarten durchgeführt werden: Gleichstromtest, Wechselstromtest und Funktionstest.
Prüfkartenmarkt
Markt für Prüfkarten
Die Analysten von The Insight Partners haben die regionalen Trends und Faktoren, die den Markt für Probe Cards im Prognosezeitraum beeinflussen, ausführlich erläutert. In diesem Abschnitt werden auch die Marktsegmente und die geografische Lage in Nordamerika, Europa, dem asiatisch-pazifischen Raum, dem Nahen Osten und Afrika sowie Süd- und Mittelamerika erörtert.Umfang des Marktberichts zu Prüfkarten
| Berichtsattribut | Einzelheiten |
|---|---|
| Marktgröße in 2020 | US$ 2.06 Billion |
| Marktgröße nach 2028 | US$ 3.44 Billion |
| Globale CAGR (2020 - 2028) | 6.7% |
| Historische Daten | 2018-2019 |
| Prognosezeitraum | 2021-2028 |
| Abgedeckte Segmente |
By Typ
|
| Abgedeckte Regionen und Länder |
Nordamerika
|
| Marktführer und wichtige Unternehmensprofile |
|
Dichte der Marktteilnehmer für Probekarten: Verständnis ihrer Auswirkungen auf die Geschäftsdynamik
Der Markt für Prüfkarten wächst rasant. Dies wird durch die steigende Endverbrauchernachfrage aufgrund veränderter Verbraucherpräferenzen, technologischer Fortschritte und eines stärkeren Bewusstseins für die Produktvorteile vorangetrieben. Mit der steigenden Nachfrage erweitern Unternehmen ihr Angebot, entwickeln Innovationen, um den Bedürfnissen der Verbraucher gerecht zu werden, und nutzen neue Trends, was das Marktwachstum weiter ankurbelt.
- Holen Sie sich die Probe Card Markt Übersicht der wichtigsten Akteure
Die im Marktbericht für Probe Cards vorgestellten Akteure konzentrieren sich hauptsächlich auf die Entwicklung fortschrittlicher und effizienter Produkte. Unternehmen im Markt für Probe Cards setzen verschiedene Strategien um, um mit den technologischen Fortschritten im Markt Schritt zu halten.
- Im Jahr 2020 kündigte FormFactor die Cryogenic Probe Family für neue Computeranwendungen an.
- Im Jahr 2020 übernahm Technoprobe Microfabrica.

Naveen ist ein erfahrener Marktforschungs- und Beratungsexperte mit über 9 Jahren Erfahrung in kundenspezifischen, syndizierten und Beratungsprojekten. In seiner aktuellen Funktion als Associate Vice President hat er erfolgreich Stakeholder entlang der gesamten Projektwertschöpfungskette gemanagt und ist Autor von über 100 Forschungsberichten und über 30 Beratungsaufträgen. Seine Arbeit erstreckt sich auf Industrie- und Regierungsprojekte und trägt maßgeblich zum Kundenerfolg und zur datengesteuerten Entscheidungsfindung bei.
Naveen hat einen Ingenieursabschluss in Elektronik und Kommunikation von der VTU, Karnataka, und einen MBA in Marketing und Operations von der Manipal University. Er ist seit 9 Jahren aktives IEEE-Mitglied und nimmt an Konferenzen und technischen Symposien teil und engagiert sich ehrenamtlich auf Sektions- und regionaler Ebene. Vor seiner aktuellen Position arbeitete er als Associate Strategic Consultant bei IndustryARC und als Industrial Server Consultant bei Hewlett Packard (HP Global).
- Umfassende Analyse der Marktgröße und Prognosen
- Detaillierte Segmentierungsanalyse
- Tiefgehende Bewertung der Marktdynamik
- Einblicke auf regionaler und nationaler Ebene
- Wettbewerbslandschaft und Unternehmens-Benchmarking
- Strategische Business Intelligence
Erfahrungsberichte
Der SCADA-Systemmarktbericht von Insight Partners ist umfassend und bietet wertvolle Einblicke in aktuelle Trends und Zukunftsprognosen. Das Team war durchweg hochprofessionell, reaktionsschnell und hilfsbereit. Wir sind sehr zufrieden und können die Dienstleistungen wärmstens empfehlen.
RAN KEDEM Partner, Reali Technologies LTDsIch habe einen Bericht über einen sehr spezifischen Softwaremarkt angefordert, und das Team hat ihn innerhalb weniger Tage erstellt. Die Informationen waren sehr relevant und gut präsentiert. Anschließend habe ich einige Änderungen und Ergänzungen zum Bericht angefordert. Das Team reagierte erneut sehr schnell, und ich erhielt den Abschlussbericht in weniger als einer Woche.
JEAN-HERVE JENN Vorsitzende, Future AnalyticaWir haben mit The Insight Partners für eine wichtige Marktstudie und Prognose zusammengearbeitet. Sie gaben uns klare Einblicke in Chancen und Risiken, die uns bei der Gestaltung unserer Pläne halfen. Ihre Recherchen waren benutzerfreundlich und basierten auf soliden Daten. Sie halfen uns, kluge und sichere Entscheidungen zu treffen. Wir können sie wärmstens empfehlen.
PIYUSH NAGPAL Sr. Vizepräsident, Fernlicht GlobalDie Insight Partners lieferten aufschlussreiche, gut strukturierte Marktforschung mit fundierter Fachkompetenz. Ihr Team war durchweg professionell und reaktionsschnell. Die benutzerfreundliche Website ermöglichte den Zugriff auf Branchenberichte. Wir empfehlen sie wärmstens für zuverlässige und hochwertige Forschungsdienstleistungen.
YUKIHIKO ADACHI Geschäftsführer, Deep Blue, LLC.Dies ist das erste Mal, dass ich einen Marktbericht von The Insight Partners erworben habe. Obwohl ich zunächst unsicher war, besuchte ich die Website und fühlte mich dann sicherer, das Risiko einzugehen und einen Marktbericht zu kaufen. Ich bin mit der Qualität des Berichts und dem Kundenservice rundum zufrieden. Ich hatte einige Fragen und Anmerkungen zum ersten Bericht, aber nach einigen E-Mail-Gesprächen mit dem Analysten bin ich überzeugt, dass ich einen Bericht habe, den ich als Input für unseren strategischen Planungsprozess verwenden kann. Vielen Dank, dass Sie sich die Zeit genommen und dies zu einer positiven Erfahrung gemacht haben. Ich werde Ihren Service auf jeden Fall weiterempfehlen und Sie werden meine erste Anlaufstelle sein, wenn wir weitere Marktdaten benötigen.
JOHN SUZUKI Präsident und Chief Executive Officer, Vorstandsmitglied, BK TechnologiesIch möchte mich für Ihre Unterstützung und die Professionalität bedanken, die Sie bei der Bearbeitung meiner Informationsanfrage zum IVD-Markt für Infektionskrankheiten in Nigeria gezeigt haben. Ich schätze Ihre Geduld, Ihre Beratung und die Tatsache, dass Sie bereit waren, einen Rabatt anzubieten, der uns schließlich den Abschluss eines Geschäfts ermöglichte. Ich freue mich darauf, The Insight Partners in Zukunft wieder zu beauftragen, dank des Eindrucks, den Sie bei dieser ersten Begegnung bei mir hinterlassen haben.
DR. CHIJIOKE ONYIA GESCHÄFTSFÜHRERIN, PineCrest Healthcare Ltd.Grund zum Kauf
- Fundierte Entscheidungsfindung
- Marktdynamik verstehen
- Wettbewerbsanalyse
- Kundeneinblicke
- Marktprognosen
- Risikominimierung
- Strategische Planung
- Investitionsbegründung
- Identifizierung neuer Märkte
- Verbesserung von Marketingstrategien
- Steigerung der Betriebseffizienz
- Anpassung an regulatorische Trends


