
Markt für Bodenfeuchtesensoren – Erkenntnisse durch globale und regionale Analyse – Prognose bis 2031
Marktgröße und Prognose für Bodenfeuchtesensoren (2021 – 2031), Bericht über globale und regionale Anteile, Trends und Wachstumschancenanalysen: Nach Typ (volumetrischer Bodenfeuchtesensor und Bodenwasserpotenzialsensor) und vertikaler Endbenutzer (Sportrasen, Landwirtschaft, Landschafts- und Bodenpflege, Forstwirtschaft und andere) und Geografie
- Status : Veröffentlichte Daten
- Berichtscode : TIPTE100000366
- Kategorie : Elektronik und Halbleiter
- Anzahl der Seiten : 150
- Verfügbare Berichtsformate :


- Datum der letzten Aktualisierung : February 15, 2025

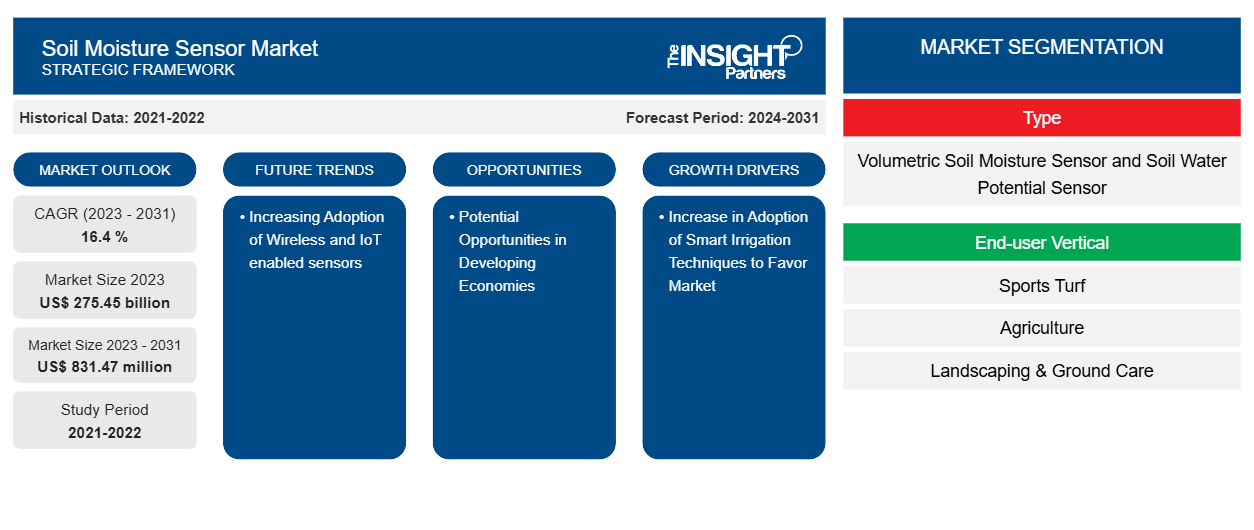
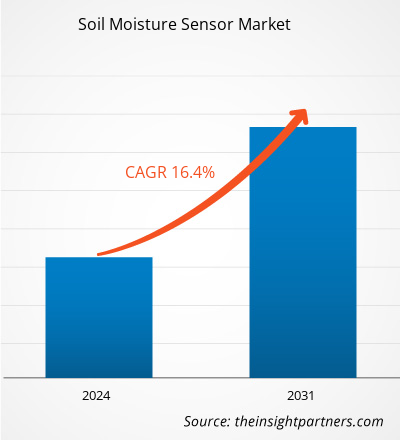
Der Markt für Bodenfeuchtesensoren soll von 275,45 Milliarden US-Dollar im Jahr 2023 auf 831,47 Millionen US-Dollar im Jahr 2031 anwachsen. Der Markt soll zwischen 2023 und 2031 eine durchschnittliche jährliche Wachstumsrate (CAGR) von 16,4 % verzeichnen. Der Markt für Bodenfeuchtesensoren wird stark von Faktoren wie Bevölkerungswachstum, Mangel an Ackerland, steigenden Lebensmittelpreisen und Fortschritten in der Agrartechnologie beeinflusst.
Marktanalyse für Bodenfeuchtesensoren
Landwirte wissen, wie wichtig es ist, Ressourcen nachhaltig zu bewirtschaften. Sowohl die Umwelt als auch die Landwirtschaft hängen stark von der Qualität des Bodens ab . Durch die Bestimmung des Feuchtigkeitsgehalts des Bodens in der Landwirtschaft kann die Durchführbarkeit und Rentabilität der Pflanzenproduktion beurteilt werden. Daher besteht weltweit ein wachsender Bedarf an Bodenfeuchtesensoren. Bodenfeuchtesensoren werden häufig für landwirtschaftliche Ertragsprognosen, Bioremediation, Deponiemanagement, Abwasserrückgewinnung, Bewässerungskontrolle und Dürrefrühwarnsysteme eingesetzt.
Marktübersicht für Bodenfeuchtesensoren
Der Wassergehalt des Bodens wird mithilfe von Bodenfeuchtigkeitssensoren gemessen. Der Bodenfeuchtigkeitsgehalt kann mithilfe verschiedener Labor- und Feldtechniken gemessen werden, einschließlich Fernerkundung, wobei die Verwendung von Bodenfeuchtigkeitssensoren die effizienteste und schnellste Methode ist. Wasserbehörden stehen seit langem vor der Herausforderung, durch die Umsetzung von Programmen zur Wassernutzungseffizienz konsistente und messbare Wassereinsparungen zu erzielen. Programme zur Rettung von Landschaften konzentrierten sich traditionell auf die Vermittlung von Bewässerungsplanung, Wartung von Bewässerungssystemen und Auswahl von Pflanzen, die für die lokale Umgebung geeignet sind. Obwohl diese Initiativen zu Einsparungen geführt haben, besteht bei der Effizienz der Landschaftsbewässerung noch viel Raum für Verbesserungen.
Passen Sie diesen Bericht Ihren Anforderungen an
Sie erhalten kostenlose Anpassungen an jedem Bericht, einschließlich Teilen dieses Berichts oder einer Analyse auf Länderebene, eines Excel-Datenpakets sowie tolle Angebote und Rabatte für Start-ups und Universitäten.
Markt für Bodenfeuchtesensoren: Strategische Einblicke
-
Holen Sie sich die wichtigsten Markttrends aus diesem Bericht.Dieses KOSTENLOSE Beispiel umfasst eine Datenanalyse von Markttrends bis hin zu Schätzungen und Prognosen.
Markttreiber und Chancen für Bodenfeuchtesensoren
Zunehmende Nutzung intelligenter Bewässerungstechniken begünstigt den Markt
Eines der größten Probleme, mit denen Länder auf der ganzen Welt derzeit konfrontiert sind, ist Wassermangel. Schätzungsweise 60 % der Süßwasserreserven der Erde werden von der Landwirtschaft verbraucht, die der Hauptverbraucher von Wasser für die landwirtschaftliche Bewässerung ist. Daher ist ein System erforderlich, um die in der Landwirtschaft verwendete Wassermenge effektiv zu kontrollieren. Hier sind intelligente Bewässerungssysteme von entscheidender Bedeutung, da sie effektivere Bewässerungsstrategien anwenden, die sowohl den Wasserverbrauch senken als auch den landwirtschaftlichen Ertrag steigern . Bodenfeuchtesensoren sind nützlich, um herauszufinden, wann, wo und wie viel Wasser eine Ernte zu einem bestimmten Zeitpunkt benötigt. Diese Informationen helfen den Landwirten, mehr Ernte zu erzielen. Die Installation dieser Sensoren ist einfach und.
Potentielle Chancen in Entwicklungsländern.
Die Lebensmittelsicherheit ist wichtig, insbesondere in Entwicklungsländern, in denen die Umweltzerstörung eine große Gefahr darstellt. Die Landwirtschaft ist eine der Haupteinnahmequellen in Entwicklungsländern wie China, Indien und Brasilien. Um die Nachfrage nach Nahrungsmitteln mit der schnell wachsenden Bevölkerung in Einklang zu bringen, müssen diese Länder das verfügbare Land effektiv nutzen. Es wird erwartet, dass der Bedarf an Bodenfeuchtigkeitssensoren in diesen Entwicklungsländern steigen wird, da der Bodenfeuchtigkeitsgehalt für die Bestimmung der Ernteerträge wichtig ist.
Segmentierungsanalyse des Marktberichts für Bodenfeuchtesensoren
Wichtige Segmente, die zur Ableitung der Marktanalyse für Bodenfeuchtesensoren beigetragen haben, sind Typen und Endbenutzer.
- Basierend auf dem Typ ist der Markt für Bodenfeuchtesensoren in volumetrische Bodenfeuchtesensoren und Bodenwasserpotenzialsensoren unterteilt.
- Nach Endbenutzerbranche ist der Markt in die Bereiche Sportrasen, Landwirtschaft, Landschafts- und Bodenpflege, Forstwirtschaft und Sonstiges segmentiert.
Bodenfeuchtesensor Marktanteilsanalyse nach Geografie
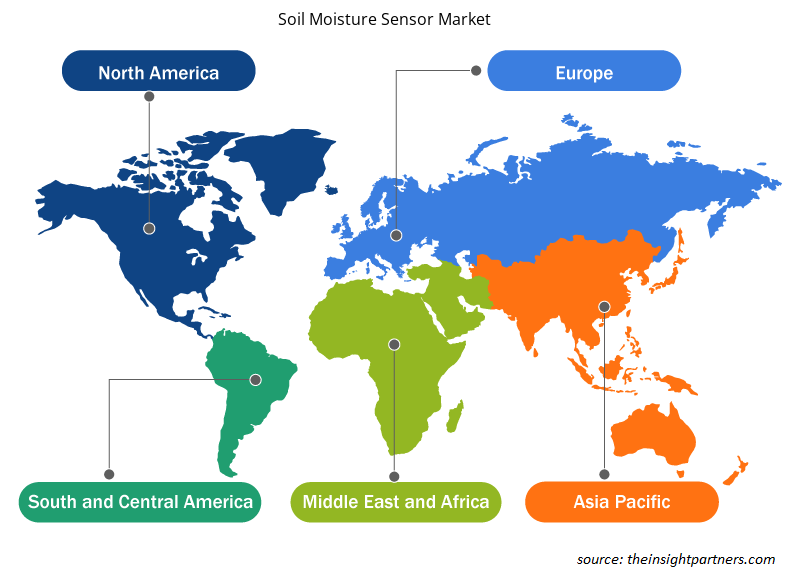
Der geografische Umfang des Marktberichts für Bodenfeuchtesensoren ist hauptsächlich in fünf Regionen unterteilt: Nordamerika, Asien-Pazifik, Europa, Naher Osten und Afrika sowie Südamerika/Süd- und Mittelamerika. Nordamerika hat den Markt für Bodenfeuchtesensoren dominiert. Hochtechnologische Trends in verschiedenen Branchen in der nordamerikanischen Region haben das Wachstum des Marktes für Bodenfeuchtesensoren vorangetrieben. Faktoren wie die zunehmende Einführung digitaler Tools und hohe Technologieausgaben von Regierungsbehörden werden voraussichtlich das Wachstum des nordamerikanischen Marktes für Bodenfeuchtesensoren vorantreiben. Darüber hinaus zwingt eine starke Betonung von Forschung und Entwicklung in den entwickelten Volkswirtschaften der USA und Kanadas die nordamerikanischen Akteure dazu, technologisch fortschrittliche Lösungen auf den Markt zu bringen. Darüber hinaus gibt es in den USA eine große Anzahl von Akteuren auf dem Markt für Bodenfeuchtesensoren, die sich zunehmend auf die Entwicklung innovativer Lösungen konzentrieren. All diese Faktoren tragen zum Wachstum des Marktes für Bodenfeuchtesensoren in der Region bei.
Regionale Einblicke in den Markt für Bodenfeuchtesensoren
Die regionalen Trends und Faktoren, die den Markt für Bodenfeuchtesensoren im Prognosezeitraum beeinflussen, wurden von den Analysten von Insight Partners ausführlich erläutert. In diesem Abschnitt werden auch die Marktsegmente und die Geografie von Bodenfeuchtesensoren in Nordamerika, Europa, im asiatisch-pazifischen Raum, im Nahen Osten und Afrika sowie in Süd- und Mittelamerika erörtert.
- Erhalten Sie regionale Daten zum Markt für Bodenfeuchtesensoren
Umfang des Marktberichts zu Bodenfeuchtesensoren
| Berichtsattribut | Details |
|---|---|
| Marktgröße im Jahr 2023 | 275,45 Milliarden US-Dollar |
| Marktgröße bis 2031 | 831,47 Millionen US-Dollar |
| Globale CAGR (2023 - 2031) | 16,4 % |
| Historische Daten | 2021-2022 |
| Prognosezeitraum | 2024–2031 |
| Abgedeckte Segmente |
Nach Typ
|
| Abgedeckte Regionen und Länder |
Nordamerika
|
| Marktführer und wichtige Unternehmensprofile |
|
Marktteilnehmerdichte: Der Einfluss auf die Geschäftsdynamik
Der Markt für Bodenfeuchtesensoren wächst rasant, angetrieben durch die steigende Nachfrage der Endnutzer aufgrund von Faktoren wie sich entwickelnden Verbraucherpräferenzen, technologischen Fortschritten und einem größeren Bewusstsein für die Vorteile des Produkts. Mit steigender Nachfrage erweitern Unternehmen ihr Angebot, entwickeln Innovationen, um die Bedürfnisse der Verbraucher zu erfüllen, und nutzen neue Trends, was das Marktwachstum weiter ankurbelt.
Die Marktteilnehmerdichte bezieht sich auf die Verteilung von Firmen oder Unternehmen, die in einem bestimmten Markt oder einer bestimmten Branche tätig sind. Sie gibt an, wie viele Wettbewerber (Marktteilnehmer) in einem bestimmten Marktraum im Verhältnis zu seiner Größe oder seinem gesamten Marktwert präsent sind.
Die wichtigsten auf dem Markt für Bodenfeuchtesensoren tätigen Unternehmen sind:
- Sentek Technologies
- Irrometer Company, Inc.
- Delta-T Devices Ltd
- Stevens Wasserüberwachungssysteme Inc.
- Die Toro Company
- Acclima, Inc.
Haftungsausschluss : Die oben aufgeführten Unternehmen sind nicht in einer bestimmten Reihenfolge aufgeführt.
- Überblick über die wichtigsten Akteure auf dem Markt für Bodenfeuchtesensoren
Neuigkeiten und aktuelle Entwicklungen zum Markt für Bodenfeuchtesensoren
Der Markt für Bodenfeuchtesensoren wird durch die Erfassung qualitativer und quantitativer Daten nach Primär- und Sekundärforschung bewertet, die wichtige Unternehmensveröffentlichungen, Verbandsdaten und Datenbanken umfasst. Im Folgenden finden Sie eine Liste der Entwicklungen auf dem Markt:
- Im Januar 2023 gab CropX Technologies, einer der weltweit führenden Anbieter digitaler Lösungen für das agronomische Farmmanagement, die Übernahme von Tule Technologies bekannt, einem Präzisionsbewässerungsunternehmen mit Sitz in Kalifornien. Diese Übernahme bringt neue Datenerfassungstechnologien in das CropX Agronomic Farm Management System und erweitert seinen Markt für tropfbewässerte Spezialkulturen in Kalifornien.
(Quelle: CropX Technologies, Pressemitteilung, 2023)
- Im Oktober 2022 brachte Sensoterra eine neue Generation von Einzeltiefensensoren mit neuem Antennendesign auf den Markt. Der neu eingeführte Sensor hat die LoRaWAN-Signalstärke um den Faktor 2 bis 4 verbessert und bietet eine bessere Haltbarkeit sowie eine höhere Genauigkeit.
(Quelle: Sensoterra, Pressemitteilung, 2022)
Marktbericht zu Bodenfeuchtesensoren – Umfang und Ergebnisse
Der Bericht „Marktgröße und Prognose für Bodenfeuchtesensoren (2021–2031)“ bietet eine detaillierte Analyse des Marktes, die die folgenden Bereiche abdeckt:
- Marktgröße und Prognose auf globaler, regionaler und Länderebene für alle wichtigen Marktsegmente, die im Rahmen des Projekts abgedeckt sind
- Marktdynamik wie Treiber, Beschränkungen und wichtige Chancen
- Wichtige Zukunftstrends
- Detaillierte PEST/Porters Five Forces- und SWOT-Analyse
- Globale und regionale Marktanalyse mit wichtigen Markttrends, wichtigen Akteuren, Vorschriften und aktuellen Marktentwicklungen
- Branchenlandschaft und Wettbewerbsanalyse, einschließlich Marktkonzentration, Heatmap-Analyse, prominenten Akteuren und aktuellen Entwicklungen
- Detaillierte Firmenprofile

Naveen ist ein erfahrener Marktforschungs- und Beratungsexperte mit über 9 Jahren Erfahrung in kundenspezifischen, syndizierten und Beratungsprojekten. In seiner aktuellen Funktion als Associate Vice President hat er erfolgreich Stakeholder entlang der gesamten Projektwertschöpfungskette gemanagt und ist Autor von über 100 Forschungsberichten und über 30 Beratungsaufträgen. Seine Arbeit erstreckt sich auf Industrie- und Regierungsprojekte und trägt maßgeblich zum Kundenerfolg und zur datengesteuerten Entscheidungsfindung bei.
Naveen hat einen Ingenieursabschluss in Elektronik und Kommunikation von der VTU, Karnataka, und einen MBA in Marketing und Operations von der Manipal University. Er ist seit 9 Jahren aktives IEEE-Mitglied und nimmt an Konferenzen und technischen Symposien teil und engagiert sich ehrenamtlich auf Sektions- und regionaler Ebene. Vor seiner aktuellen Position arbeitete er als Associate Strategic Consultant bei IndustryARC und als Industrial Server Consultant bei Hewlett Packard (HP Global).
- Umfassende Analyse der Marktgröße und Prognosen
- Detaillierte Segmentierungsanalyse
- Tiefgehende Bewertung der Marktdynamik
- Einblicke auf regionaler und nationaler Ebene
- Wettbewerbslandschaft und Unternehmens-Benchmarking
- Strategische Business Intelligence
Erfahrungsberichte
Der SCADA-Systemmarktbericht von Insight Partners ist umfassend und bietet wertvolle Einblicke in aktuelle Trends und Zukunftsprognosen. Das Team war durchweg hochprofessionell, reaktionsschnell und hilfsbereit. Wir sind sehr zufrieden und können die Dienstleistungen wärmstens empfehlen.
RAN KEDEM Partner, Reali Technologies LTDsIch habe einen Bericht über einen sehr spezifischen Softwaremarkt angefordert, und das Team hat ihn innerhalb weniger Tage erstellt. Die Informationen waren sehr relevant und gut präsentiert. Anschließend habe ich einige Änderungen und Ergänzungen zum Bericht angefordert. Das Team reagierte erneut sehr schnell, und ich erhielt den Abschlussbericht in weniger als einer Woche.
JEAN-HERVE JENN Vorsitzende, Future AnalyticaWir haben mit The Insight Partners für eine wichtige Marktstudie und Prognose zusammengearbeitet. Sie gaben uns klare Einblicke in Chancen und Risiken, die uns bei der Gestaltung unserer Pläne halfen. Ihre Recherchen waren benutzerfreundlich und basierten auf soliden Daten. Sie halfen uns, kluge und sichere Entscheidungen zu treffen. Wir können sie wärmstens empfehlen.
PIYUSH NAGPAL Sr. Vizepräsident, Fernlicht GlobalDie Insight Partners lieferten aufschlussreiche, gut strukturierte Marktforschung mit fundierter Fachkompetenz. Ihr Team war durchweg professionell und reaktionsschnell. Die benutzerfreundliche Website ermöglichte den Zugriff auf Branchenberichte. Wir empfehlen sie wärmstens für zuverlässige und hochwertige Forschungsdienstleistungen.
YUKIHIKO ADACHI Geschäftsführer, Deep Blue, LLC.Dies ist das erste Mal, dass ich einen Marktbericht von The Insight Partners erworben habe. Obwohl ich zunächst unsicher war, besuchte ich die Website und fühlte mich dann sicherer, das Risiko einzugehen und einen Marktbericht zu kaufen. Ich bin mit der Qualität des Berichts und dem Kundenservice rundum zufrieden. Ich hatte einige Fragen und Anmerkungen zum ersten Bericht, aber nach einigen E-Mail-Gesprächen mit dem Analysten bin ich überzeugt, dass ich einen Bericht habe, den ich als Input für unseren strategischen Planungsprozess verwenden kann. Vielen Dank, dass Sie sich die Zeit genommen und dies zu einer positiven Erfahrung gemacht haben. Ich werde Ihren Service auf jeden Fall weiterempfehlen und Sie werden meine erste Anlaufstelle sein, wenn wir weitere Marktdaten benötigen.
JOHN SUZUKI Präsident und Chief Executive Officer, Vorstandsmitglied, BK TechnologiesIch möchte mich für Ihre Unterstützung und die Professionalität bedanken, die Sie bei der Bearbeitung meiner Informationsanfrage zum IVD-Markt für Infektionskrankheiten in Nigeria gezeigt haben. Ich schätze Ihre Geduld, Ihre Beratung und die Tatsache, dass Sie bereit waren, einen Rabatt anzubieten, der uns schließlich den Abschluss eines Geschäfts ermöglichte. Ich freue mich darauf, The Insight Partners in Zukunft wieder zu beauftragen, dank des Eindrucks, den Sie bei dieser ersten Begegnung bei mir hinterlassen haben.
DR. CHIJIOKE ONYIA GESCHÄFTSFÜHRERIN, PineCrest Healthcare Ltd.Grund zum Kauf
- Fundierte Entscheidungsfindung
- Marktdynamik verstehen
- Wettbewerbsanalyse
- Kundeneinblicke
- Marktprognosen
- Risikominimierung
- Strategische Planung
- Investitionsbegründung
- Identifizierung neuer Märkte
- Verbesserung von Marketingstrategien
- Steigerung der Betriebseffizienz
- Anpassung an regulatorische Trends


