土壌水分センサー市場 - 2031 年の成長予測、統計、事実
過去データ : 2021-2022 | 基準年 : 2023 | 予測期間 : 2024-2031土壌水分センサー市場の規模と予測(2021年 - 2031年)、世界および地域のシェア、傾向、成長機会分析レポートの対象範囲:タイプ別(体積土壌水分センサーおよび土壌水分ポテンシャルセンサー)、エンドユーザー垂直(スポーツターフ、農業、造園およびグラウンドケア、林業およびその他)および地理
- ステータス : 公開されたデータ
- レポートコード : TIPTE100000366
- カテゴリー : エレクトロニクスおよび半導体
- ページ数 : 150
- 利用可能なレポート形式 :


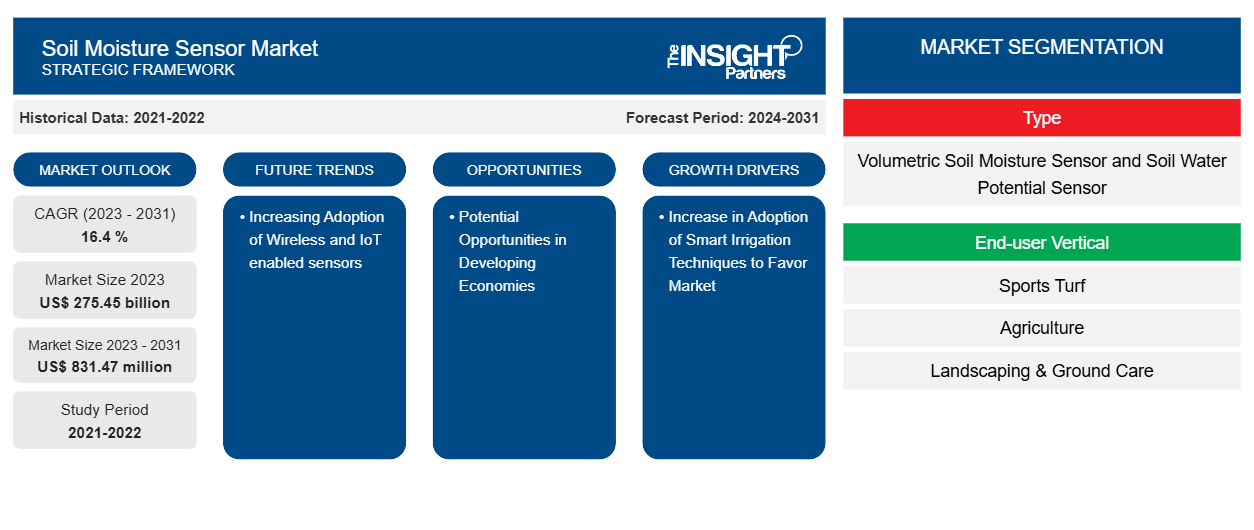
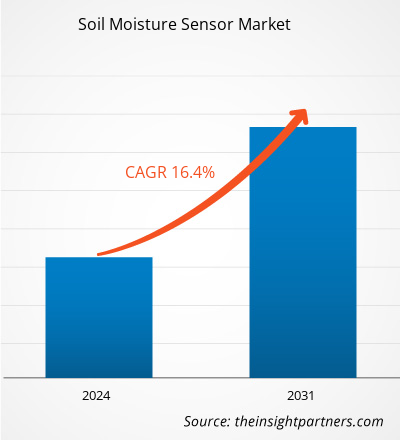
土壌水分センサーの市場規模は、2023 年の 2,754.5 億米ドルから 2031 年には 8 億 3,147 万米ドルに達すると予測されています。市場は 2023 年から 2031 年にかけて 16.4 % の CAGR を記録すると予想されています。土壌水分センサーの市場は、人口増加、耕作地の不足、食料価格の上昇、農業技術の進歩などの要因に大きく影響されます。
土壌水分センサー市場分析
農家は、持続可能な方法で資源を管理することの重要性を理解しています。環境と農業はどちらも土壌の質に大きく依存しています。農業において土壌の水分含有量を測定することで、作物生産の実現可能性と収益性を評価できます。その結果、世界中で土壌水分センサーの需要が高まっています。土壌水分センサーは、農業収穫高予測、バイオレメディエーション、埋立地管理、廃水再生、灌漑制御、早期干ばつ警報システムなどで広く使用されています。
土壌水分センサー市場の概要
土壌の水分含有量は、土壌水分センサーを使用して測定されます。土壌水分含有量は、リモート センシングを含むさまざまな実験室および現場技術を使用して測定できますが、土壌水分センサー デバイスを使用するのが最も効率的で迅速な方法です。水道局は、水使用効率化プログラムの実装を通じて、一貫性があり測定可能な節水を達成するという課題に長い間直面してきました。景観を保護するために設計されたプログラムは、伝統的に、灌漑のスケジュール、灌漑システムの維持、および地域環境に適した植物の選択に関する指導に重点を置いてきました。これらの取り組みにより節水が実現したとはいえ、景観灌漑の効率性には、まだ改善の余地が大いにあります。
要件に合わせてレポートをカスタマイズする
このレポートの一部、国レベルの分析、Excelデータパックなど、あらゆるレポートを無料でカスタマイズできます。また、スタートアップや大学向けのお得なオファーや割引もご利用いただけます。
土壌水分センサー市場:戦略的洞察
-
このレポートの主要な市場動向を入手してください。この無料サンプルには、市場動向から見積もりや予測に至るまでのデータ分析が含まれます。
土壌水分センサー市場の推進要因と機会
スマート灌漑技術の採用増加が市場を有利にする
現在、世界中の国々が直面している主な問題の 1 つは、水不足です。地球上の淡水資源の約 60% は、農業用灌漑用水の主な使用者である農業によって消費されていると考えられています。そのため、農業で使用される水の量を効果的に制御するシステムが必要です。ここでは、より効果的な灌漑戦略を適用して水の消費量を減らし、農業の収穫量を増やすスマート灌漑システムが不可欠です。土壌水分センサーは、作物がいつ、どこで、どのくらいの水を必要とするかを把握するのに役立ちます。この情報は、農家がより多くの作物を生産するのに役立ちます。これらのセンサーの設置は簡単で、.
発展途上国における潜在的な機会。
食糧安全保障は、環境悪化が深刻な脅威となっている発展途上国では特に重要です。中国、インド、ブラジルなどの発展途上国では、農業が主な収入源の 1 つです。急速に増加する人口に食糧生産の需要を合わせるために、これらの国では利用可能な土地を有効に活用する必要があります。土壌水分含有量は作物の生産量を決定する上で重要であるため、これらの発展途上国では土壌水分センサーの必要性が高まることが予想されます。
土壌水分センサー市場レポートのセグメンテーション分析
土壌水分センサー市場分析の導出に貢献した主要なセグメントは、タイプとエンドユーザーの垂直です。
- タイプに基づいて、土壌水分センサー市場は、体積土壌水分センサーと土壌水分ポテンシャルセンサーに分けられます。
- エンドユーザーの垂直別に見ると、市場はスポーツ用芝生、農業、造園およびグラウンドケア、林業、その他に分類されます。
土壌水分センサー市場シェアの地域別分析
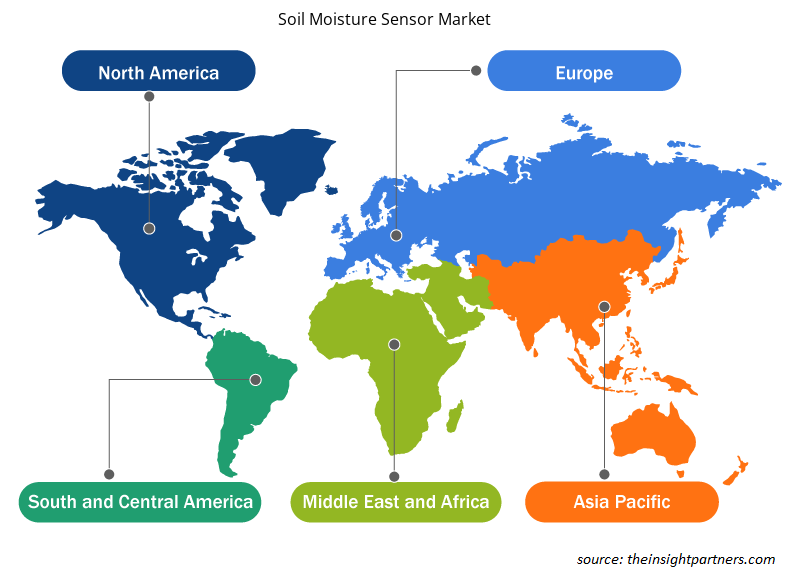
土壌水分センサー市場レポートの地理的範囲は、主に北米、アジア太平洋、ヨーロッパ、中東およびアフリカ、南米/中南米の5つの地域に分かれています。北米は土壌水分センサー市場を支配してきました。北米地域のさまざまな業界でのハイテク採用の傾向は、土壌水分センサー市場の成長を後押ししています。デジタルツールの採用の増加や政府機関による高い技術支出などの要因が、北米の土壌水分センサー市場の成長を牽引すると予想されています。さらに、米国とカナダの先進国では研究開発に重点が置かれているため、北米のプレーヤーは技術的に高度なソリューションを市場に投入せざるを得ません。さらに、米国には土壌水分センサー市場のプレーヤーが多数存在し、革新的なソリューションの開発にますます重点を置いています。これらすべての要因が、この地域の土壌水分センサー市場の成長に貢献しています。
土壌水分センサー市場の地域別分析
予測期間を通じて土壌水分センサー市場に影響を与える地域的な傾向と要因は、Insight Partners のアナリストによって徹底的に説明されています。このセクションでは、北米、ヨーロッパ、アジア太平洋、中東、アフリカ、南米、中米にわたる土壌水分センサー市場のセグメントと地理についても説明します。
- 土壌水分センサー市場の地域別データを入手
土壌水分センサー市場レポートの範囲
| レポート属性 | 詳細 |
|---|---|
| 2023年の市場規模 | 2,754.5億米ドル |
| 2031年までの市場規模 | 8億3,147万米ドル |
| 世界のCAGR(2023年~2031年) | 16.4 % |
| 履歴データ | 2021-2022 |
| 予測期間 | 2024-2031 |
| 対象セグメント |
タイプ別
|
| 対象地域と国 |
北米
|
| 市場リーダーと主要企業プロフィール |
|
市場プレーヤーの密度:ビジネスダイナミクスへの影響を理解する
土壌水分センサー市場は、消費者の嗜好の変化、技術の進歩、製品の利点に対する認識の高まりなどの要因により、エンドユーザーの需要が高まり、急速に成長しています。需要が高まるにつれて、企業は提供を拡大し、消費者のニーズを満たすために革新し、新たなトレンドを活用し、市場の成長をさらに促進しています。
市場プレーヤー密度とは、特定の市場または業界内で活動している企業または会社の分布を指します。これは、特定の市場スペースに、その規模または総市場価値と比較して、どれだけの競合相手 (市場プレーヤー) が存在するかを示します。
土壌水分センサー市場で事業を展開している主要企業は次のとおりです。
- センテックテクノロジーズ
- イロメーターカンパニー株式会社
- デルタTデバイス株式会社
- スティーブンス水モニタリングシステムズ社
- トロ社
- 株式会社アクリマ
免責事項:上記の企業は、特定の順序でランク付けされていません。
- 土壌水分センサー市場のトップキープレーヤーの概要を入手
土壌水分センサー市場のニュースと最近の動向
土壌水分センサー市場は、重要な企業出版物、協会データ、データベースを含む一次調査と二次調査後の定性的および定量的データを収集することによって評価されます。以下は、市場の動向の一覧です。
- 2023 年 1 月、農業農場管理のデジタル ソリューションにおける世界的リーダーの 1 つである CropX Technologies は、カリフォルニアに拠点を置く精密灌漑会社である Tule Technologies の買収を発表しました。この買収により、CropX 農業農場管理システムに新しいデータ キャプチャ テクノロジーが導入され、カリフォルニアの点滴灌漑特産作物の市場が拡大します。
(出典:CropX Technologies、プレスリリース、2023年)
- 2022 年 10 月、Sensoterra は新しいアンテナ設計を採用した新世代のシングル デプス センサーを発売しました。新しく発売されたセンサーは、LoRaWAN 信号強度を 2 ~ 4 倍向上させ、精度の向上とともに耐久性も向上しています。
(出典:Sensoterra、プレスリリース、2022年)
土壌水分センサー市場レポートの対象範囲と成果物
「土壌水分センサー市場の規模と予測(2021〜2031年)」レポートでは、以下の分野をカバーする市場の詳細な分析を提供しています。
- 対象範囲に含まれるすべての主要市場セグメントの世界、地域、国レベルでの市場規模と予測
- 市場の動向(推進要因、制約、主要な機会など)
- 今後の主な動向
- 詳細なPEST/ポーターの5つの力とSWOT分析
- 主要な市場動向、主要プレーヤー、規制、最近の市場動向を網羅した世界および地域の市場分析
- 市場集中、ヒートマップ分析、主要プレーヤー、最近の動向を網羅した業界の状況と競争分析
- 詳細な企業プロフィール

Naveenは、カスタム、シンジケート、コンサルティングの各プロジェクトにおいて9年以上の実績を持つ、経験豊富な市場調査およびコンサルティングのプロフェッショナルです。現在はアソシエイトバイスプレジデントを務め、プロジェクトバリューチェーン全体にわたるステークホルダー管理を成功させ、100件以上の調査レポートと30件以上のコンサルティング案件を執筆しています。産業および政府機関のプロジェクトに幅広く携わり、クライアントの成功とデータに基づく意思決定に大きく貢献しています。
Naveenは、カルナータカ州VTUで電子通信工学の学位を取得し、マニパル大学でマーケティング&オペレーションズのMBAを取得しています。IEEEの会員として9年間活動し、会議や技術シンポジウムへの参加、セクションレベルおよび地域レベルでのボランティア活動に積極的に取り組んでいます。現職以前は、IndustryARCでアソシエイト戦略コンサルタント、Hewlett Packard(HP Global)で産業用サーバーコンサルタントを務めていました。
- 過去2年間の分析、基準年、CAGRによる予測(7年間)
- PEST分析とSWOT分析
- 市場規模価値/数量 - 世界、地域、国
- 業界と競争環境
- Excel データセット
お客様の声
Insight PartnersのSCADAシステム市場レポートは包括的で、現在のトレンドと将来の予測に関する貴重な洞察が含まれています。チームは終始、非常にプロフェッショナルで、対応が早く、サポートも充実していました。私たちは彼らのサービスに非常に満足しており、強くお勧めします。
ラン・ケデム パートナー, レアリテクノロジーズ株式会社非常に特殊なソフトウェア市場に関するレポートを依頼したところ、チームは数日でレポートを作成してくれました。情報は非常に関連性が高く、分かりやすくまとめられていました。その後、レポートにいくつか修正と追加を依頼しましたが、チームは非常に迅速に対応し、1週間も経たないうちに最終レポートを受け取ることができました。
ジャン=エルヴェ・ジェン 会長, フューチャー・アナリティカ重要な市場調査と予測のために、The Insight Partnersと協力しました。彼らは機会とリスクに関する明確な洞察を提供し、私たちの計画策定に役立ちました。彼らの調査は使いやすく、確かなデータに基づいており、賢明で自信に満ちた意思決定に役立ちました。彼らを強くお勧めします。
ピユーシュ・ナグパル 上級副社長, ハイビームグローバルInsight Partnersは、深い専門知識に基づき、洞察力に富み、構造化された市場調査を提供しました。チームは終始プロフェッショナルで、対応力も抜群でした。ユーザーフレンドリーなウェブサイトにより、業界レポートへのアクセスもスムーズでした。信頼性の高い高品質な調査サービスをお探しなら、Insight Partnersを強くお勧めします。
安達幸彦 最高経営責任者(CEO), ディープブルーLLC。The Insight Partnersから市場レポートを購入するのは今回が初めてです。最初は不安でしたが、ウェブサイトを見て、リスクを負ってでも購入してみようという気持ちになりました。レポートの品質とカスタマーサービスには大変満足しています。最初のレポートにはいくつか質問やコメントがありましたが、アナリストとメールで何度かやり取りした結果、戦略策定プロセスへのインプットとして活用できるレポートが完成しました。貴重なお時間を割いていただき、貴重な体験をさせていただき、誠にありがとうございました。他の方にもぜひお勧めしたいですし、今後さらに市場データが必要になった際には、まずThe Insight Partnersにご連絡させていただきます。
ジョン・スズキ 社長兼最高経営責任者、取締役, BKテクノロジーズナイジェリアの感染症IVD市場に関する情報提供依頼に対し、ご対応いただいた際、ご尽力とプロフェッショナルな姿勢に深く感謝申し上げます。忍耐強く、的確なアドバイスをいただき、また、最終的に取引成立に至った割引のご提供にも深く感謝申し上げます。今回の最初の出会いで得た強い印象のおかげで、今後もThe Insight Partnersとの連携を心待ちにしております。
チジオケ博士 オニア マネージングディレクター, パインクレストヘルスケア株式会社購入理由
- 情報に基づいた意思決定
- 市場動向の理解
- 競合分析
- 顧客インサイト
- 市場予測
- リスク軽減
- 戦略計画
- 投資の正当性
- 新興市場の特定
- マーケティング戦略の強化
- 業務効率の向上
- 規制動向への対応


 無料サンプルを入手 - 土壌水分センサー市場