
Strategie di mercato dei sistemi di distribuzione automatizzata, principali attori, opportunità di crescita, analisi e previsioni entro il 2027
Previsioni di mercato dei sistemi di distribuzione automatizzata fino al 2027 - Impatto del Covid-19 e analisi globale per operazione (sistemi decentralizzati e sistemi centralizzati), applicazione (distribuzione automatizzata ambulatoriale e distribuzione automatizzata per pazienti ricoverati) e utente finale (farmacie al dettaglio, farmacie ospedaliere e altre) e area geografica
- Stato : Edito
- Codice del report : TIPHE100000837
- Categoria : Scienze della vita
- Numero di pagine : 155
- Formati di report disponibili :


- Data dell'ultimo aggiornamento : June 12, 2024

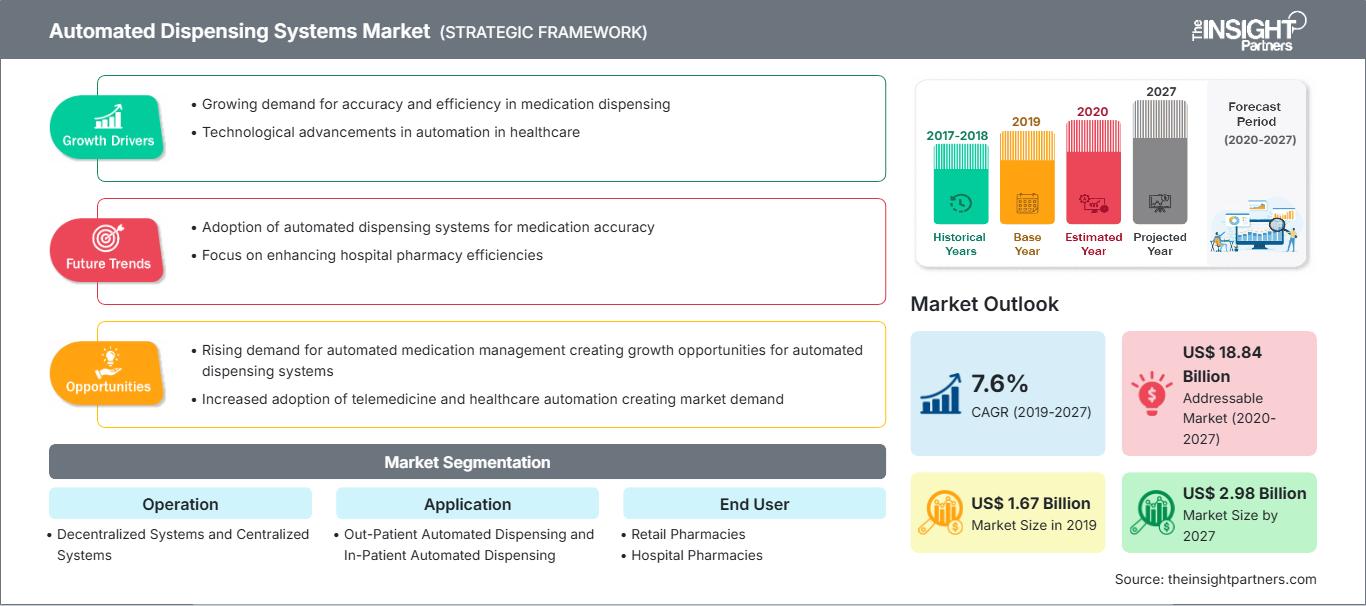
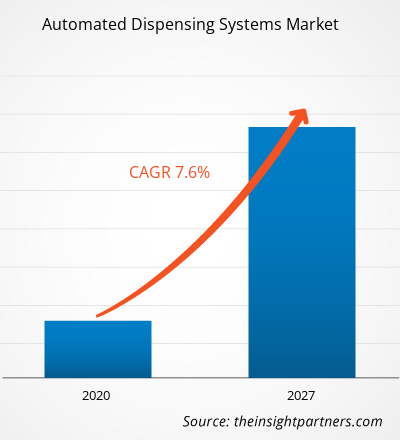
Si prevede che il mercato dei sistemi di distribuzione automatizzata raggiungerà i 2.980,38 milioni di dollari entro il 2027, rispetto ai 1.665,78 milioni di dollari del 2019; si stima una crescita a un CAGR del 7,6% tra il 2020 e il 2027.
I sistemi di distribuzione automatizzata, noti anche come armadietti automatici per farmaci, sono dispositivi elettronici per la conservazione e la distribuzione dei farmaci, utilizzati principalmente in ambito sanitario. Questi sistemi aiutano a tracciare e controllare la distribuzione dei farmaci; sono protetti da password autenticate e dati biometrici per il controllo dell'inventario e la sicurezza dei farmaci contro i furti. Questi sistemi sono stati evidenziati come uno dei potenziali strumenti per migliorare l'efficienza operativa e la sicurezza dei pazienti. Inoltre, sono ora ampiamente utilizzati, tra gli altri, in cliniche e case di cura. I sistemi di dispensazione automatizzata contribuiscono a trasformare gli ospedali in istituzioni più sicure, efficienti ed efficaci.
Il mercato globale dei sistemi di dispensazione automatizzata è trainato da fattori quali l'aumento degli errori di somministrazione dei farmaci e l'aumento della popolazione geriatrica. Tuttavia, i problemi associati ai sistemi di dispensazione automatizzata, come l'inserimento di programmi errati, i guasti delle apparecchiature e altri, possono ostacolare la crescita del mercato. Inoltre, i mercati emergenti stanno creando opportunità di crescita per gli operatori del mercato.
Personalizza questo rapporto in base alle tue esigenze
Potrai personalizzare gratuitamente qualsiasi rapporto, comprese parti di questo rapporto, o analisi a livello di paese, pacchetto dati Excel, oltre a usufruire di grandi offerte e sconti per start-up e università
Mercato dei sistemi di distribuzione automatizzati: Approfondimenti strategici
-
Ottieni le principali tendenze chiave del mercato di questo rapporto.Questo campione GRATUITO includerà l'analisi dei dati, che vanno dalle tendenze di mercato alle stime e alle previsioni.
Approfondimenti di mercato
Errori di somministrazione dei farmaci in aumento
Una somministrazione irrazionale, inappropriata e inefficace dei farmaci può portare a gravi errori terapeutici che possono danneggiare i pazienti. Alcuni degli errori terapeutici più comuni sono la somministrazione di un farmaco sbagliato, la somministrazione di una quantità di farmaco errata, la somministrazione di un farmaco con dosaggio errato e l'omissione di un articolo. Circa il 75% degli errori terapeutici è causato da distrazioni, poiché gli operatori sanitari sono impegnati in più attività come la visita dei pazienti, i colloqui con i consulenti, i colloqui con i familiari dei pazienti e le conversazioni con gli assicuratori.
Ogni anno, la Food and Drug Administration (FDA) statunitense riceve oltre 100.000 segnalazioni relative ad errori terapeutici. Inoltre, secondo lo studio "Errori di somministrazione dei farmaci" Pubblicato su StatPearls a giugno 2020, ogni anno negli Stati Uniti muoiono tra le 7.000 e le 9.000 persone a causa di errori terapeutici. Analogamente, secondo le stime pubblicate nello studio "Prevalence and Economic Burden of Medication Errors in the NHS In England" del 2018, ogni anno si verificano circa 237 milioni di errori terapeutici nel NHS e le reazioni avverse ai farmaci (ADR) evitabili causano centinaia di decessi.
Approfondimenti basati sull'operatività
In base all'operatività, il mercato dei sistemi di distribuzione automatizzata è segmentato in sistemi decentralizzati e sistemi centralizzati. Il segmento dei sistemi centralizzati ha detenuto una quota di mercato maggiore nel 2019 a causa di fattori quali la crescente necessità di ridurre i costi, garantire la disponibilità dei farmaci e modernizzare l'allocazione delle risorse. Inoltre, si prevede che i sistemi decentralizzati registreranno un CAGR maggiore nel mercato durante il periodo di previsione.
Approfondimenti basati sulle applicazioni
In base all'applicazione, il mercato dei sistemi di distribuzione automatica è segmentato in distribuzione automatica per pazienti ricoverati e distribuzione automatica per pazienti ambulatoriali. Il segmento della distribuzione automatica per pazienti ricoverati ha detenuto una quota di mercato maggiore nel 2019; tuttavia, si prevede che la distribuzione automatica per pazienti ambulatoriali registrerà un CAGR più elevato durante il periodo di previsione.
Approfondimenti basati sull'utente finale
In base all'utente finale, il mercato dei sistemi di distribuzione automatica è segmentato in farmacie ospedaliere, farmacie al dettaglio e altri. Il segmento delle farmacie ospedaliere ha detenuto la quota di mercato maggiore nel 2019; tuttavia, si prevede che il segmento delle farmacie al dettaglio registrerà il CAGR più elevato del mercato durante il periodo di previsione.
Il lancio e l'approvazione di prodotti sono le strategie comunemente adottate dalle aziende per espandere la propria presenza globale e il proprio portafoglio prodotti; queste strategie le aiutano a soddisfare la crescente domanda dei consumatori. La collaborazione è una delle principali strategie adottate dai protagonisti del mercato dei sistemi di distribuzione automatizzati per ampliare la base clienti in tutto il mondo, consentendo loro anche di mantenere il proprio marchio a livello globale.
Approfondimenti regionali sul mercato dei sistemi di distribuzione automatizzati
Le tendenze regionali e i fattori che influenzano il mercato dei sistemi di distribuzione automatizzata durante il periodo di previsione sono stati ampiamente spiegati dagli analisti di The Insight Partners. Questa sezione illustra anche i segmenti di mercato e la distribuzione geografica dei sistemi di distribuzione automatizzata in Nord America, Europa, Asia-Pacifico, Medio Oriente e Africa, America meridionale e centrale.
Ambito del rapporto di mercato sui sistemi di distribuzione automatizzati
| Attributo del rapporto | Dettagli |
|---|---|
| Dimensioni del mercato in 2019 | US$ 1.67 Billion |
| Dimensioni del mercato per 2027 | US$ 2.98 Billion |
| CAGR globale (2019 - 2027) | 7.6% |
| Dati storici | 2017-2018 |
| Periodo di previsione | 2020-2027 |
| Segmenti coperti |
By Funzionamento
|
| Regioni e paesi coperti |
Nord America
|
| Leader di mercato e profili aziendali chiave |
|
Densità degli operatori del mercato dei sistemi di distribuzione automatizzati: comprendere il suo impatto sulle dinamiche aziendali
Il mercato dei sistemi di distribuzione automatizzati è in rapida crescita, trainato dalla crescente domanda degli utenti finali, dovuta a fattori quali l'evoluzione delle preferenze dei consumatori, i progressi tecnologici e una maggiore consapevolezza dei vantaggi del prodotto. Con l'aumento della domanda, le aziende stanno ampliando la propria offerta, innovando per soddisfare le esigenze dei consumatori e sfruttando le tendenze emergenti, alimentando ulteriormente la crescita del mercato.
- Ottieni il Mercato dei sistemi di distribuzione automatizzati Panoramica dei principali attori chiave
Mercato globale dei sistemi di distribuzione automatizzata: per operazione
- Sistemi decentralizzati
- Sistemi centralizzati
Mercato globale dei sistemi di distribuzione automatizzata: per applicazione
- Distribuzione automatizzata ambulatoriale
- Distribuzione automatizzata ospedaliera
Mercato globale dei sistemi di distribuzione automatizzata: per utente finale
- Farmacie al dettaglio
- Farmacie ospedaliere
- Altri
Mercato dei sistemi di distribuzione automatizzata: per Geografia
-
Nord America
- Stati Uniti
- Canada
- Messico
-
Europa
- Francia
- Germania
- Italia
- Regno Unito
- Spagna
- Resto d'Europa
-
Asia Pacifico (APAC)
- Cina
- India
- Corea del Sud
- Giappone
- Australia
- Resto dell'Asia Pacifico
-
Medio Oriente e Africa (MEA)
- Sudafrica
- Arabia Saudita
- Emirati Arabi Uniti
- Resto del Medio Oriente e Africa
-
Sud e Centro America
- Brasile
- Argentina
- Resto del Sud America
Profili aziendali
- Cerner Corporation
- Capsa Healthcare
- Omnicell, Inc
- BD
- ARxIUM
- Accu-Chart Plus Healthcare Systems, Inc
- Innovation Associates
- RxMedic Systems, Inc
- Swiss Log Holding Ltd
- Willach Pharmacy Solutions GmbH

Mrinal è un'analista di ricerca esperta con oltre 8 anni di esperienza nella consulenza e nell'intelligence di mercato nel settore delle scienze biologiche. Grazie a una mentalità strategica e a un costante impegno verso l'eccellenza, ha maturato una profonda competenza nelle previsioni farmaceutiche, nella valutazione delle opportunità di mercato e nello sviluppo di benchmark di settore. Il suo lavoro è incentrato sulla fornitura di insight fruibili che consentono ai clienti di prendere decisioni strategiche consapevoli.
Il punto di forza di Mrinal risiede nella capacità di tradurre complessi set di dati quantitativi in business intelligence significative. Il suo acume analitico è fondamentale per definire strategie di go-to-market (GTM) e individuare opportunità di crescita nei settori farmaceutico e dei dispositivi medici. In qualità di consulente di fiducia, si concentra costantemente sulla semplificazione dei processi di flusso di lavoro e sulla definizione di best practice, promuovendo così l'innovazione e l'efficienza operativa per i suoi clienti.
- Analisi completa delle dimensioni e delle previsioni di mercato
- Analisi dettagliata della segmentazione
- Valutazione approfondita delle dinamiche di mercato
- Approfondimenti a livello regionale e nazionale
- Analisi del panorama competitivo e benchmarking aziendale
- Business intelligence strategica
Testimonianze
Il report di mercato sui sistemi SCADA di Insight Partners è completo, con preziosi spunti sulle tendenze attuali e sulle previsioni future. Il team si è dimostrato altamente professionale, reattivo e disponibile in ogni fase del progetto. Siamo molto soddisfatti e consigliamo vivamente i loro servizi.
RAN KEDEM Partner, Reali Technologies LTDsHo richiesto un report su un mercato software molto specifico e il team lo ha prodotto in pochi giorni. Le informazioni erano molto pertinenti e ben presentate. Ho quindi richiesto alcune modifiche e aggiunte al report. Il team è stato ancora una volta molto reattivo e ho ricevuto il report finale in meno di una settimana.
JEAN-HERVE JENN Presidente, Future AnalyticaAbbiamo collaborato con The Insight Partners per un importante studio di mercato e una previsione. Ci hanno fornito informazioni chiare su opportunità e rischi, che ci hanno aiutato a definire i nostri piani. La loro ricerca è stata facile da usare e basata su dati solidi. Ci ha aiutato a prendere decisioni intelligenti e consapevoli. Li consigliamo vivamente.
PIYUSH NAGPAL Vicepresidente senior, Abbaglianti globaliInsight Partners ha fornito ricerche di mercato approfondite e ben strutturate, con una solida competenza nel settore. Il loro team si è dimostrato professionale e reattivo in ogni fase. Il sito web intuitivo ha reso l'accesso ai report di settore semplice e immediato. Li consigliamo vivamente per servizi di ricerca affidabili e di alta qualità.
YUKIHIKO ADACHI Amministratore delegato, Deep Blue, LLC.Questa è la prima volta che acquisto un report di mercato da The Insight Partners. Sebbene inizialmente fossi indeciso, ho visitato il loro sito web e mi sono sentito più a mio agio nell'acquistare un report di mercato. Sono completamente soddisfatto della qualità del report e del servizio clienti. Avevo diverse domande e commenti sul report iniziale, ma dopo un paio di conversazioni via email con il loro analista credo di avere un report che posso utilizzare come input per il nostro processo di pianificazione strategica. Grazie mille per aver dedicato del tempo extra e aver reso questa esperienza positiva. Consiglierò sicuramente il vostro servizio ad altri e sarete la mia prima persona a cui rivolgermi quando avremo bisogno di ulteriori dati di mercato.
GIOVANNI SUZUKI Presidente e Amministratore Delegato, Consigliere di Amministrazione, Tecnologie BKDesidero esprimere la mia gratitudine per il supporto e la professionalità dimostrati nel rispondere alla mia richiesta di informazioni sul mercato dei dispositivi medici in vitro per malattie infettive in Nigeria. Apprezzo la vostra pazienza, la vostra guida e la vostra disponibilità a offrirmi uno sconto, che alla fine ci ha permesso di concludere l'affare. Non vedo l'ora di collaborare con The Insight Partners in futuro, grazie anche all'impressione che mi avete lasciato dopo questo primo incontro.
Dott. Chijioke AMMINISTRATORE DELEGATO DI ONYIA, PineCrest Healthcare Ltd.Motivo dell'acquisto
- Processo decisionale informato
- Comprensione delle dinamiche di mercato
- Analisi competitiva
- Analisi dei clienti
- Previsioni di mercato
- Mitigazione del rischio
- Pianificazione strategica
- Giustificazione degli investimenti
- Identificazione dei mercati emergenti
- Miglioramento delle strategie di marketing
- Aumento dell'efficienza operativa
- Allineamento alle tendenze normative


