アフリカ燃料ディスペンサー市場 - 2030年の成長予測、統計および事実

  • Report Code : TIPRE00038844
  • Category : Manufacturing and Construction
  • Status : Published
  • No. of Pages : 156
Buy Now

Africa Fuel Dispenser Market Report - Share and Trends by 2030

Buy Now

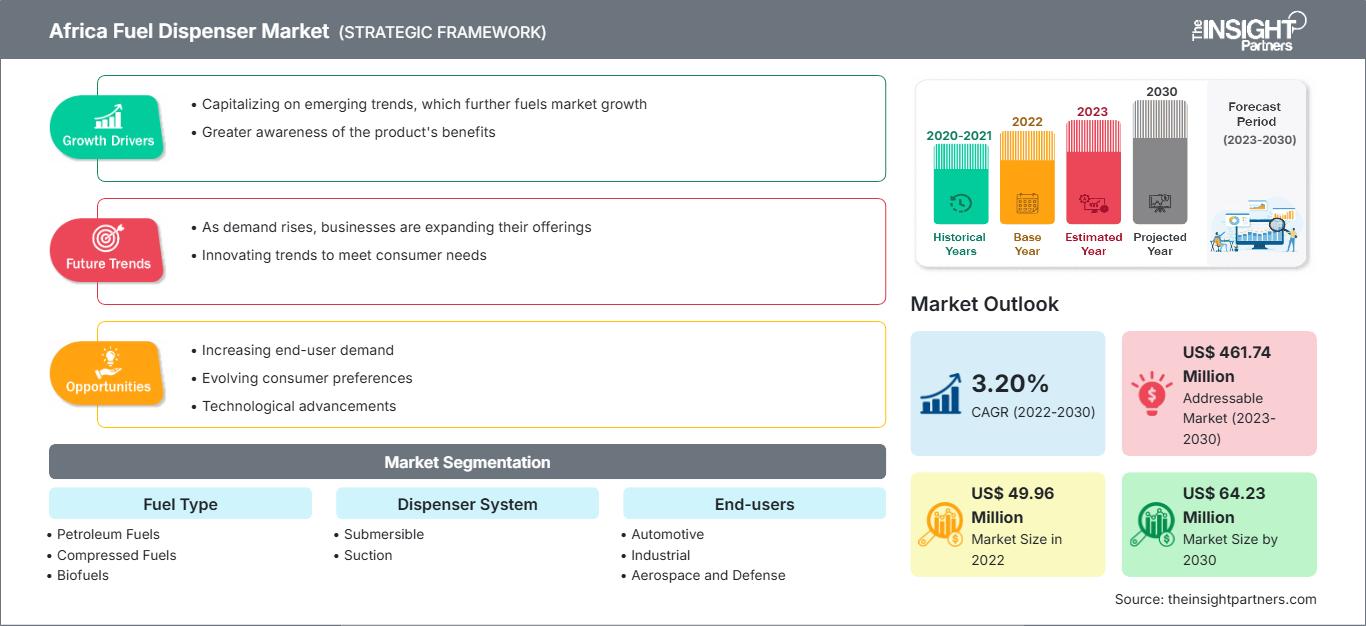
アフリカの燃料ディスペンサー市場は、2022 年に 4,996 万米ドルと評価され、2030 年までに 6,423 万米ドルに達すると予測されています。 2022年から2030年の間に3.20%のCAGRを記録すると予想されています。
アナリストの視点:
アフリカの燃料ディスペンサー市場はナイジェリアとエジプトが独占しており、2022年の市場シェアはそれぞれ34.60%と20.19%でした。ナイジェリアとエジプトの経済は、この地域でトップクラスの経済大国の一つです。ナイジェリアの天然ガス埋蔵量は、2022 年で約 208 兆 6,200 億立方フィートでした。ナイジェリア政府は、自動車および輸送部門での採用を目的として圧縮天然ガスに多額の投資を行っています。エジプトは自動車を圧縮天然ガス(CNG)に転換するために重要な措置を講じた。たとえば、2021 年 1 月にエジプト政府は、圧縮天然ガスを燃料とする自動車の台数を増やす計画を発表しました。エジプトの天然ガス生産量は自給自足であると考えられています。
市場概要:
燃料ディスペンサーはガソリン、ディーゼル、またはその他の種類の燃料を自動車に安全かつ効率的に注入するための不可欠なガソリンスタンド設備です。燃料を適切に計量して供給し、消費者が受け取った金額のみを支払うことを保証します。
堅調な経済成長と都市化の進展によって促進されたアフリカの燃料需要の急増により、アフリカの燃料ディスペンサー市場は新たな高みに押し上げられようとしています。経済が拡大するにつれて、さまざまな分野でエネルギー消費が同時に急増しています。都市化によりこの需要が増大し、洗練された燃料流通インフラが必要になります。都市の中心部と経済活動の拠点の増加により、効率的な交通ネットワークの必要性が高まり、それによってアフリカの燃料ディスペンサー市場の成長が促進されます。都市部では自動車や公共交通機関への依存度が高まっており、増大する燃料要件を満たす上で燃料供給システムが重要な役割を果たしていることが浮き彫りになっています。多くのアフリカ諸国における燃料小売インフラの近代化は、地域全体のアフリカの燃料ディスペンサー市場に大きな影響を与え、推進する準備ができている戦略的転換を表しています。

市場の推進力:
アフリカにおける燃料需要の急増が促進堅調な経済成長と都市化の進行により、アフリカの燃料ディスペンサー市場を新たな高みに押し上げる準備ができています。経済が拡大するにつれて、さまざまな分野でエネルギー消費も比例して急増しています。都市化によりこの需要が増大し、洗練された燃料流通インフラが必要になります。都市の中心部や経済活動の拠点の増加により、効率的な交通ネットワークの必要性が高まり、燃料ディスペンサーの需要が高まっています。都市部では自動車や公共交通機関への依存度が高まっており、増大する燃料要件を満たす上で燃料供給システムが果たす重要な役割が浮き彫りになっています。以下の表は、2022 年を通じて南アフリカからの一定の燃料需要を示しています。この傾向は、今後数年間でアフリカの燃料ディスペンサー市場に有望な成長機会を提供すると予想されます。
1 月から 12 月までの南アフリカの燃料販売量 / 消費量 (2022 年) )
量(百万リットル)
製品名
第1四半期 - 1月から3月
第2四半期 - 4月から6月
第3四半期 - 7月から9月
第4四半期 - 10月から12月
総計
ディーゼル (全グレード)
3231.73
3133.18
3243.82
3108.58
12717.32
ガソリン (全グレード)
2341.86
2236.06
2215.98
2390.95
9184.86
ジェット燃料
348.61
337.00
366.94
425.58
1478.14
パラフィン
305.53
299.68
300.79
271.88
1177.89
炉油
146.34
144.65
138.67
164.36
594.04
LPG
90.98
86.75
68.72
76.92
323.38
航空ガソリン
1.49
1.23
0.90
1.06
4.69
総計
6466.58
6238.57
6335.84
6439.36
25480.37
同時に、大陸全体に広がる工業化により、シームレスかつ継続的な燃料供給の必要性が高まっています。経済発展に不可欠な要素である産業は、製造プロセスと輸送のための信頼できるエネルギー源を必要としています。この産業活動の高まりにより、工業地帯の近くに燃料ディスペンサーを戦略的に配置する必要性が高まっています。アフリカの経済情勢はダイナミックに進化しており、これはアフリカの燃料ディスペンサー市場の利害関係者にとって戦略的な機会をもたらしています。先端技術への投資と急増する需要に対応するための燃料流通ネットワークの拡大は、この地域の経済発展の軌道と一致しています。経済成長、都市化、工業化の結びつきが燃料ディスペンサーの需要を促進する中、積極的な業界関係者は、アフリカ全体のイノベーション、インフラ開発、持続可能な経済発展を促進し、このアフリカ燃料ディスペンサー市場の成長を活用する立場にあります。
セグメント別。分析:
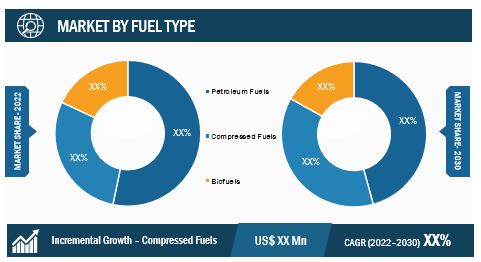
アフリカの燃料ディスペンサー市場は、さまざまな種類の燃料が特徴であり、それぞれが独自の需要と地域の好みに対応しています。燃料の種類には、石油燃料、圧縮燃料、バイオ燃料などがあります。この区分は、大陸のダイナミックなエネルギー情勢と、よりクリーンで持続可能な燃料オプションへの進行中の移行を反映しています。ディーゼル燃料ディスペンサーは、輸送、産業、農業部門をサポートする上で重要な役割を果たし続けています。ディーゼルに対する一貫した需要は、さまざまな車両や機械に動力を供給する上でのディーゼルの重要性を浮き彫りにしています。ガソリン用の燃料ディスペンサーは、依然として自家用車や商用車に不可欠です。代替燃料への関心が高まっているにもかかわらず、ガソリンは特に都市部で大きな市場シェアを維持しています。よりクリーンな代替手段としての CNG の採用が注目を集めています。エジプトなどのアフリカ諸国は、CNG インフラ開発をリードしており、CNG を搭載した車両の数が増加し、給油所のネットワークが拡大しています。エタノール混合燃料はますます人気が高まっており、よりクリーンな代替燃料の需要に応えるバイオ燃料ディスペンサーが登場しています。サンバード・バイオエナジーによるザンビアにおけるキャッサバ原料の使用などの取り組みは、持続可能なバイオ燃料への関心の高まりを示しており、ザンビアのアフリカ燃料ディスペンサー市場シェアの成長を促進しています。
地域分析:
アフリカ燃料ディスペンサー市場は、以下の国々が独占していました。ナイジェリアとエジプトは、2022 年の市場シェアがそれぞれ 34.60% と 20.19% になります。ナイジェリアとエジプトの経済は、この地域のトップ経済国の一つです。さらに、ナイジェリアの海運産業は急速に発展しています。ナイジェリアの海上貿易は、国の石油・ガス産業と直接関係しています。アフリカ最大の石油生産国であるナイジェリアは、原油、精製石油、液化天然ガス(LNG)などの石油製品を海上ルートで輸出しています。ナイジェリアはアフリカ最大の船舶保有国で、291隻、総重量794万トンの船舶を保有している。ナイジェリア所有の船舶は船舶価値で 30 位にランクされ、世界の船舶価値の 0.56% を占めています。その結果、ナイジェリアの海洋部門における成長アフリカ燃料ディスペンサー市場シェアが上昇しています。
ナイジェリアとエジプトを除けば、アルジェリアとケニアは需要が成長しているいくつかの注目すべきアフリカ諸国です。アルジェリアはアフリカ最大の原油と天然ガスの生産国です。アルジェリアには、2023 年初めの時点で推定 159 兆立方フィートの天然ガス確認埋蔵量があります。アルジェリアは 2021 年に前年と比較してより多くの天然ガスを生産しました。ケニアはアフリカで最も急速に発展している経済国の一つです。 2023 年第 3 四半期のケニアの GDP は、2022 年の同四半期の 4.3% 成長と比較して年率 5.9% 増加しました。国の燃料需要が高まるにつれて、燃料消費量も継続的に増加しています。このような燃料消費量の増加により、アフリカの燃料ディスペンサー市場の成長が促進されます。
主要企業の分析:
タイガーポンプ。エハド燃料装置; FTIグループ株式会社; SAMD;スマートフロー。ガリレオテクノロジーSA;イーグルスターエナジーテクノロジー株式会社;ドーバー給油所;プロワルコ;
最近の開発:
アフリカの燃料ディスペンサー市場の企業は、合併や買収などの無機的および有機的な戦略を高度に採用しています。この市場イニシアチブは、アフリカの燃料ディスペンサー市場プレーヤーが世界中に拠点を拡大し、増大する顧客の需要に応えるために採用した戦略です。市場関係者は、先進的な機能とテクノロジーを自社の製品に統合することによる製品とサービスの強化に主に焦点を当てています。主要企業による最近の開発のいくつかを以下に示します。

ニュース
2022年4月
ヘルメリッヒ・アンド・ペイン(H&P)は、ガリレオ・テクノロジーズに3,300万米ドルを投資し、同社の独自の技術プラットフォームを強化しました。エネルギーサプライチェーンの脱炭素化に向けて。
Report Coverage
Report Coverage

Revenue forecast, Company Analysis, Industry landscape, Growth factors, and Trends

Segment Covered
Segment Covered

This text is related
to segments covered.

Regional Scope
Regional Scope

North America, Europe, Asia Pacific, Middle East & Africa, South & Central America

Country Scope
Country Scope

This text is related
to country scope.

Frequently Asked Questions


What is the future trend for Africa fuel dispenser market?

The Africa fuel dispenser market is experiencing a notable trend as key players are actively launching new clean fuel dispensers, marking a significant shift toward environmentally friendly and sustainable technologies. This trend reflects the industry's commitment to meeting the rising demand for cleaner energy solutions, aligning with global environmental initiatives.

Which country to dominate the Africa fuel dispenser market in the forecast period?

The Africa fuel dispenser market was dominated by Nigeria and Egypt, with market shares of 34.60% and 20.19%, respectively, in 2022. Nigeria and Egypt’s economies are among the top economies in the region. Nigeria's natural gas deposit is estimated at 208.62 trillion cubic feet as of 2022. The Nigerian government is heavily investing in compressed natural gas for adoption in the automotive and transportation sectors.

Who are the major vendors in the Africa fuel dispenser market?

TSG Group, Dover Fueling Solutions, SAMD Africa, Prowalco, Smartflow, and Gilbarco Veeder Root are the top key market players operating in the Africa fuel dispenser market.

What are market opportunities for the Africa fuel dispenser market?

The prospect of rural market expansion offers a significant avenue for growth in the fuel dispenser market in Africa, presenting a unique opportunity to address the fueling needs of underserved populations in remote areas. This strategic expansion into rural regions aligns with broader economic development goals and provides tangible benefits for both fuel retailers and the local communities.

What are reasons behind Africa fuel dispenser market growth?

The surging demand for fuel in Africa, catalyzed by robust economic growth and increased urbanization, is poised to propel the fuel dispenser market to new heights. As economies expand, there is a proportional surge in energy consumption across various sectors. Urbanization amplifies this demand, necessitating a sophisticated fuel distribution infrastructure.

The List of Companies - Africa Fuel Dispenser Market

  1. TSG Group
  2. Ehad Fuel Equipment
  3. FTI Group Ltd.
  4. SAMD
  5. Smartflow
  6. Galileo Technologies SA
  7. Eaglestar Energy Technology Co., Ltd.
  8. Dover Fuelling Stations
  9. Prowalco
  10. Gilbarco Veeder-Root

The Insight Partners performs research in 4 major stages: Data Collection & Secondary Research, Primary Research, Data Analysis and Data Triangulation & Final Review.

  1. Data Collection and Secondary Research:

As a market research and consulting firm operating from a decade, we have published and advised several client across the globe. First step for any study will start with an assessment of currently available data and insights from existing reports. Further, historical and current market information is collected from Investor Presentations, Annual Reports, SEC Filings, etc., and other information related to company’s performance and market positioning are gathered from Paid Databases (Factiva, Hoovers, and Reuters) and various other publications available in public domain.

Several associations trade associates, technical forums, institutes, societies and organization are accessed to gain technical as well as market related insights through their publications such as research papers, blogs and press releases related to the studies are referred to get cues about the market. Further, white papers, journals, magazines, and other news articles published in last 3 years are scrutinized and analyzed to understand the current market trends.

  1. Primary Research:

The primarily interview analysis comprise of data obtained from industry participants interview and answers to survey questions gathered by in-house primary team.

For primary research, interviews are conducted with industry experts/CEOs/Marketing Managers/VPs/Subject Matter Experts from both demand and supply side to get a 360-degree view of the market. The primary team conducts several interviews based on the complexity of the markets to understand the various market trends and dynamics which makes research more credible and precise.

A typical research interview fulfils the following functions:

  • Provides first-hand information on the market size, market trends, growth trends, competitive landscape, and outlook
  • Validates and strengthens in-house secondary research findings
  • Develops the analysis team’s expertise and market understanding

Primary research involves email interactions and telephone interviews for each market, category, segment, and sub-segment across geographies. The participants who typically take part in such a process include, but are not limited to:

  • Industry participants: VPs, business development managers, market intelligence managers and national sales managers
  • Outside experts: Valuation experts, research analysts and key opinion leaders specializing in the electronics and semiconductor industry.

Below is the breakup of our primary respondents by company, designation, and region:

Research Methodology

Once we receive the confirmation from primary research sources or primary respondents, we finalize the base year market estimation and forecast the data as per the macroeconomic and microeconomic factors assessed during data collection.

  1. Data Analysis:

Once data is validated through both secondary as well as primary respondents, we finalize the market estimations by hypothesis formulation and factor analysis at regional and country level.

  • Macro-Economic Factor Analysis:

We analyse macroeconomic indicators such the gross domestic product (GDP), increase in the demand for goods and services across industries, technological advancement, regional economic growth, governmental policies, the influence of COVID-19, PEST analysis, and other aspects. This analysis aids in setting benchmarks for various nations/regions and approximating market splits. Additionally, the general trend of the aforementioned components aid in determining the market's development possibilities.

  • Country Level Data:

Various factors that are especially aligned to the country are taken into account to determine the market size for a certain area and country, including the presence of vendors, such as headquarters and offices, the country's GDP, demand patterns, and industry growth. To comprehend the market dynamics for the nation, a number of growth variables, inhibitors, application areas, and current market trends are researched. The aforementioned elements aid in determining the country's overall market's growth potential.

  • Company Profile:

The “Table of Contents” is formulated by listing and analyzing more than 25 - 30 companies operating in the market ecosystem across geographies. However, we profile only 10 companies as a standard practice in our syndicate reports. These 10 companies comprise leading, emerging, and regional players. Nonetheless, our analysis is not restricted to the 10 listed companies, we also analyze other companies present in the market to develop a holistic view and understand the prevailing trends. The “Company Profiles” section in the report covers key facts, business description, products & services, financial information, SWOT analysis, and key developments. The financial information presented is extracted from the annual reports and official documents of the publicly listed companies. Upon collecting the information for the sections of respective companies, we verify them via various primary sources and then compile the data in respective company profiles. The company level information helps us in deriving the base number as well as in forecasting the market size.

  • Developing Base Number:

Aggregation of sales statistics (2020-2022) and macro-economic factor, and other secondary and primary research insights are utilized to arrive at base number and related market shares for 2022. The data gaps are identified in this step and relevant market data is analyzed, collected from paid primary interviews or databases. On finalizing the base year market size, forecasts are developed on the basis of macro-economic, industry and market growth factors and company level analysis.

  1. Data Triangulation and Final Review:

The market findings and base year market size calculations are validated from supply as well as demand side. Demand side validations are based on macro-economic factor analysis and benchmarks for respective regions and countries. In case of supply side validations, revenues of major companies are estimated (in case not available) based on industry benchmark, approximate number of employees, product portfolio, and primary interviews revenues are gathered. Further revenue from target product/service segment is assessed to avoid overshooting of market statistics. In case of heavy deviations between supply and demand side values, all thes steps are repeated to achieve synchronization.

We follow an iterative model, wherein we share our research findings with Subject Matter Experts (SME’s) and Key Opinion Leaders (KOLs) until consensus view of the market is not formulated – this model negates any drastic deviation in the opinions of experts. Only validated and universally acceptable research findings are quoted in our reports.

We have important check points that we use to validate our research findings – which we call – data triangulation, where we validate the information, we generate from secondary sources with primary interviews and then we re-validate with our internal data bases and Subject matter experts. This comprehensive model enables us to deliver high quality, reliable data in shortest possible time.

Your data will never be shared with third parties, however, we may send you information from time to time about our products that may be of interest to you. By submitting your details, you agree to be contacted by us. You may contact us at any time to opt-out.

Trends and growth analysis reports related to Manufacturing and Construction : READ MORE..