
データバス市場分析と予測:規模、シェア、成長、トレンド2031年
データバス市場の規模と予測(2021年 - 2031年)、世界および地域別のシェア、トレンド、成長機会分析レポートの対象範囲:コンポーネント別[ハードウェア(ケーブルとコネクタ、アセンブリまたはターミネータ、データバスカプラ、インターフェースカードまたはボード、その他)およびソフトウェア]、タイプ別(ARINC 429または629、MIL-STD 1533、その他)、アプリケーション別(海洋、自動車、商用航空、軍用航空)、および地域別(北米、ヨーロッパ、アジア太平洋、中東およびアフリカ、南米および中米)
- ステータス : 出版
- レポートコード : TIPTE100000505
- カテゴリー : エレクトロニクスおよび半導体
- ページ数 : 250
- 利用可能なレポート形式 :


- 最終更新日 : July 03, 2025

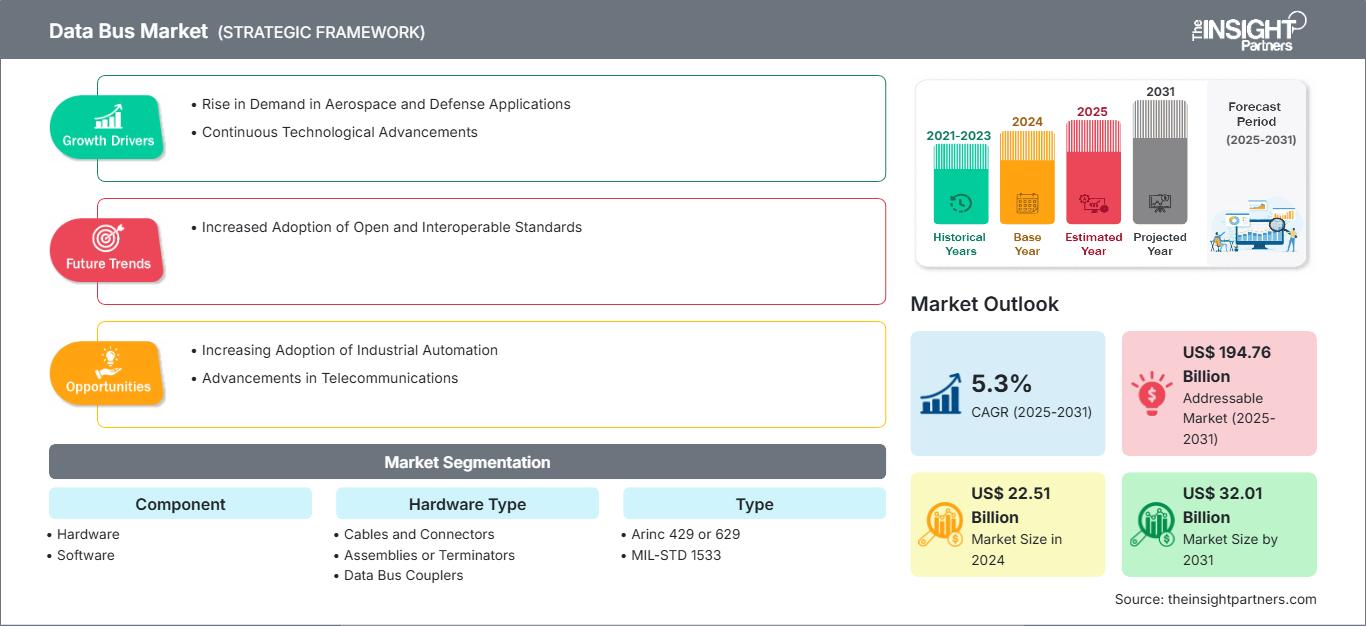
データバス市場規模は2024年に225億1,000万米ドルと評価され、2031年には320億1,000万米ドルに達すると見込まれています。また、2025年から2031年にかけて5.3%のCAGRで成長すると予測されています。オープンで相互運用可能な標準規格の採用増加は、新たな市場トレンドを生み出すと見込まれます。
データバス市場分析
航空宇宙および防衛アプリケーションにおける需要の増加や継続的な技術進歩などの要因が、データバス市場を牽引しています。産業オートメーションの採用増加と通信の進歩により、市場は予測期間中に成長すると予想されています。オープンで相互運用可能な標準規格の採用増加は、市場における主要なトレンドの1つになると予想されます。ただし、実装コストが高いことが、データバス市場の成長を妨げる可能性があります。
データバス市場の概要
データバスは、コンピュータまたはデジタルシステム内の重要なサブシステムであり、中央処理装置(CPU)、メモリ、周辺機器などのさまざまなコンポーネント間のデータ転送を容易にします。バイナリ情報(ビット)を伝送する一連の平行ワイヤまたは電気経路で構成され、システムのアーキテクチャと要件に応じて、どちらの方向にもデータを転送できます。データバスの幅(ビット単位で測定:8ビット、16ビット、32ビット、64ビットなど)によって、同時に転送できるデータの量が決まり、システムの全体的なパフォーマンスとデータスループットに直接影響します。バスが広いほど、一度に転送できるデータ量が多くなり、ハードウェア要素間の処理と通信が高速化されます。データの行き先に関する情報を運ぶアドレスバスや、操作を管理するための信号を運ぶ制御バスとは異なり、データバスはデータの実際の移動を専門に担っています。現代のコンピューティングシステムでは、データバスはシステムクロックと命令セットの指示の下、アドレスバスや制御バスと連携して動作し、コンピュータアーキテクチャ全体にわたって同期された、正確で効率的なデータ通信を確保しています。
要件に合わせてレポートをカスタマイズ
レポートの一部、国レベルの分析、Excelデータパックなどを含め、スタートアップ&大学向けに特別オファーや割引もご利用いただけます(無償)
データバス市場: 戦略的洞察
-
このレポートの主要な市場動向を入手してください。この無料サンプルには、市場動向から見積もりや予測に至るまでのデータ分析が含まれます。
データバス市場の推進要因と機会
航空宇宙および防衛アプリケーションにおける需要の増加
データバス市場は、ミッションクリティカルな環境における安全で高速な通信の需要の高まりを主な要因として、急速に拡大しています。MIL-STD-1553Bプロトコルは、その起源が数十年前に遡るにもかかわらず、その決定論的なパフォーマンスと実証済みの堅牢性により、特に障害が許されないアプリケーションにおいて新たな重要性を見出し続けています。1553Bデータバストランスフォーマーは、単なるレガシーコンポーネントではなく、冗長性、EMI耐性、障害分離が最重要視される環境における最新のデジタル通信を実現する手段です。これらのトランスフォーマーの継続的な採用は、オープンアーキテクチャとソフトウェア定義機能が標準になりつつある航空宇宙および防衛システムの拡張性とモジュール化のトレンドを支えています。このように、航空宇宙および防衛アプリケーションにおけるデータバスの需要の高まりは、データバス市場の成長を後押しします。
継続的な技術進歩
世界のデータバス市場を牽引しているのは、高性能コンピューティングとAIベースのデータ転送システムにおけるボトルネックの解決に焦点を当てた継続的な技術進歩です。最近の注目すべき例として、NEO Semiconductor社が2024年8月5日に発表した3D X-AIチップ技術が挙げられます。これは、AI処理を3D DRAMに直接統合することで、AIワークロードにおけるデータバスの混雑を緩和するように設計された画期的なイノベーションです。このイノベーションは単なるハードウェアのアップグレードではありません。これは、生成AIや機械学習環境で実行されるような計算負荷の高いタスクにおいて、高帯域幅メモリ(HBM)とGPU間でデータを管理するパラダイムシフトを表しています。
AI、自律システム、データセンター、高度なコンピューティングなどの分野で処理速度とデータ量が増加するにつれ、より効率的なデータバスシステムの必要性はかつてないほど高まっています。NEOのソリューションは、従来のデータバスへの負担を軽減するとともに、ハイブリッドバスアーキテクチャ、インテリジェントメモリシステム、組み込み処理への市場のシフトを強化し、あらゆる分野でイノベーションを推進するトレンドとなっています。また、このような組み込み AI メモリ アーキテクチャを補完または統合できる適応型データ バス技術のさらなる研究開発を促進します。
データ バス市場レポートのセグメンテーション分析
データ バス市場分析の導出に貢献した主要なセグメントは、コンポーネント、タイプ、およびアプリケーションです。
- コンポーネントに基づいて、市場はハードウェアとソフトウェアに分かれています。ハードウェア セグメントは、2024 年に大きなデータ バス市場シェアを占めました。
- タイプでは、市場は ARINC 429/629、MIL-STD-1553、その他に分類されています。MIL-STD-1553 セグメントは、2024 年に最大のデータ バス市場シェアを占めました。
- アプリケーションに基づいて、市場は海洋、自動車、商用航空、軍用航空に分類されています。 2024年、軍用航空部門がデータバス市場で最大のシェアを占めました。
データバス市場の地域別シェア分析
- データバス市場は、北米、ヨーロッパ、アジア太平洋(APAC)、中東およびアフリカ(MEA)、南米および中米の5つの主要地域に分割されています。2024年には北米が市場を支配しました。ヨーロッパは世界のデータバス市場に2番目に大きな貢献者であり、アジア太平洋がそれに続きます。
- 北米は世界のデータバス市場で支配的な地位を占めており、世界最大の防衛および航空宇宙産業の本拠地である米国が主に牽引しています。ロッキード・マーティン、レイセオン・テクノロジーズ、ノースロップ・グラマン、ボーイングなどの大手企業の存在は、特に軍用航空、無人航空機(UAV)、宇宙探査の分野で、最先端のデータバスシステムへの持続的な投資を促進しています。米国国防総省は、ミッションクリティカルなアプリケーションにおける安全でフォールトトレラントなデータ通信のために、MIL-STD-1553などの厳格な規格を義務付けています。北米はまた、NASA、DARPA、連邦航空局(FAA)などの機関の支援を受け、イーサネットベースおよびハイブリッドバスアーキテクチャのイノベーションの中心地となっています。さらに、米国とカナダでは、コネクテッドカー市場の成長と先進運転支援システム(ADAS)の統合により、CAN、FlexRay、車載イーサネットなどのデータバスの採用が増加しています。活発な研究開発活動、防衛関連企業の成熟したエコシステム、そして強力な規制の枠組みにより、北米は先進データバスシステムの技術開発と商用化の両方において、世界的リーダーとしての地位を確立しています。
- 急速な工業化、防衛予算の増加、航空宇宙産業と自動車産業の拡大を背景に、アジア太平洋地域はデータバス技術の急成長を遂げ、戦略的に重要な市場として台頭しています。中国、インド、日本、韓国は、国内製造能力の向上と防衛近代化への重点化により、最前線に立っています。例えば、インドでは「Make in India」と「Atmanirbhar Bharat」の取り組みにより、防衛航空機、海軍プラットフォーム、衛星開発を含む国産プログラムが生まれ、MIL-STD-1553およびARINC準拠のデータバスシステムに対する需要が高まっています。DRDO、ISRO、HALなどの組織は、国内外の技術パートナーと緊密に協力し、データ通信インフラの強化に取り組んでいます。中国では、商用航空宇宙およびハイテク軍事プラットフォームの急速な成長により、高度なデータバスアーキテクチャの現地生産と統合が増加しています。
データバス市場レポートの範囲
データバス市場のニュースと最近の動向
データバス市場は、主要な企業出版物、協会データ、データベースなどの一次調査および二次調査を経て、定性および定量データを収集することで評価されています。データバス市場における主要な開発動向を以下にいくつかご紹介します。
- キーサイトとSPHEREAは、航空宇宙・防衛分野のお客様にテスト機能の向上を提供するために提携しました。この新たな提携では、キーサイトの高性能電子機器テストおよび計測システムに関する専門知識と、SPHEREAの設計・統合能力を活用し、信頼性の高い技術に基づいたローカルソリューションをお客様に提供します。(出典:キーサイト、プレスリリース、2025年5月)
- エマーソンは、データ収集(DAQ)製品の最新ラインナップとして、NI cDAQ-9187およびcDAQ-9183 EthernetシャーシとNI 9204入力モジュールを発表しました。 NI FlexLogger DAQソフトウェアプラグイン用のGitHubリポジトリとともに、これらの新しいソリューションは、Ethernet経由で高性能テストおよび計測システムを導入するための費用対効果の高いオプションを提供します。
(出典: Emerson、プレスリリース、2025年2月)
データバス市場レポートの対象範囲と成果物
「データバス市場の規模と予測(2021~2031年)」では、以下の分野を網羅した詳細な市場分析を提供しています。
- 対象範囲に含まれるすべての主要市場セグメントにおける、世界、地域、国レベルでのデータバス市場の規模と予測
- データバス市場の動向、および推進要因、制約、主要な機会などの市場動向
- 詳細なPESTおよびSWOT分析
- 主要な市場動向、世界および地域の枠組み、主要プレーヤー、規制、および最近の市場動向を網羅したデータバス市場分析
- 市場集中、データバス市場のヒートマップ分析、主要プレーヤー、最近の動向
- 詳細な企業プロファイル
データバス市場の地域別分析
予測期間全体を通してデータバス市場に影響を与える地域的な傾向と要因については、The Insight Partnersのアナリストが詳細に解説しています。このセクションでは、北米、ヨーロッパ、アジア太平洋、中東・アフリカ、中南米におけるデータバス市場のセグメントと地域についても解説しています。
データバス市場レポートの範囲
| レポート属性 | 詳細 |
|---|---|
| の市場規模 2024 | US$ 22.51 Billion |
| 市場規模別 2031 | US$ 32.01 Billion |
| 世界的なCAGR (2025 - 2031) | 5.3% |
| 過去データ | 2021-2023 |
| 予測期間 | 2025-2031 |
| 対象セグメント |
By コンポーネント
|
| 対象地域と国 |
北米
|
| 市場リーダーと主要企業の概要 |
|
データバス市場のプレーヤー密度:ビジネスダイナミクスへの影響を理解する
データバス市場は、消費者の嗜好の変化、技術の進歩、製品メリットへの認知度の高まりといった要因によるエンドユーザー需要の高まりに牽引され、急速に成長しています。需要の増加に伴い、企業は製品ラインナップの拡充、消費者ニーズへの対応のためのイノベーション、そして新たなトレンドの活用を進めており、これが市場の成長をさらに加速させています。
- 入手 データバス市場 主要プレーヤーの概要

Naveenは、カスタム、シンジケート、コンサルティングの各プロジェクトにおいて9年以上の実績を持つ、経験豊富な市場調査およびコンサルティングのプロフェッショナルです。現在はアソシエイトバイスプレジデントを務め、プロジェクトバリューチェーン全体にわたるステークホルダー管理を成功させ、100件以上の調査レポートと30件以上のコンサルティング案件を執筆しています。産業および政府機関のプロジェクトに幅広く携わり、クライアントの成功とデータに基づく意思決定に大きく貢献しています。
Naveenは、カルナータカ州VTUで電子通信工学の学位を取得し、マニパル大学でマーケティング&オペレーションズのMBAを取得しています。IEEEの会員として9年間活動し、会議や技術シンポジウムへの参加、セクションレベルおよび地域レベルでのボランティア活動に積極的に取り組んでいます。現職以前は、IndustryARCでアソシエイト戦略コンサルタント、Hewlett Packard(HP Global)で産業用サーバーコンサルタントを務めていました。
- 包括的な市場規模および予測分析
- 詳細なセグメンテーション分析
- 市場動向(ダイナミクス)の徹底的な評価
- 地域および国別のインサイト
- 競争環境および企業ベンチマーク
- 戦略的ビジネスインテリジェンス
お客様の声
Insight PartnersのSCADAシステム市場レポートは包括的で、現在のトレンドと将来の予測に関する貴重な洞察が含まれています。チームは終始、非常にプロフェッショナルで、対応が早く、サポートも充実していました。私たちは彼らのサービスに非常に満足しており、強くお勧めします。
ラン・ケデム パートナー, レアリテクノロジーズ株式会社非常に特殊なソフトウェア市場に関するレポートを依頼したところ、チームは数日でレポートを作成してくれました。情報は非常に関連性が高く、分かりやすくまとめられていました。その後、レポートにいくつか修正と追加を依頼しましたが、チームは非常に迅速に対応し、1週間も経たないうちに最終レポートを受け取ることができました。
ジャン=エルヴェ・ジェン 会長, フューチャー・アナリティカ重要な市場調査と予測のために、The Insight Partnersと協力しました。彼らは機会とリスクに関する明確な洞察を提供し、私たちの計画策定に役立ちました。彼らの調査は使いやすく、確かなデータに基づいており、賢明で自信に満ちた意思決定に役立ちました。彼らを強くお勧めします。
ピユーシュ・ナグパル 上級副社長, ハイビームグローバルInsight Partnersは、深い専門知識に基づき、洞察力に富み、構造化された市場調査を提供しました。チームは終始プロフェッショナルで、対応力も抜群でした。ユーザーフレンドリーなウェブサイトにより、業界レポートへのアクセスもスムーズでした。信頼性の高い高品質な調査サービスをお探しなら、Insight Partnersを強くお勧めします。
安達幸彦 最高経営責任者(CEO), ディープブルーLLC。The Insight Partnersから市場レポートを購入するのは今回が初めてです。最初は不安でしたが、ウェブサイトを見て、リスクを負ってでも購入してみようという気持ちになりました。レポートの品質とカスタマーサービスには大変満足しています。最初のレポートにはいくつか質問やコメントがありましたが、アナリストとメールで何度かやり取りした結果、戦略策定プロセスへのインプットとして活用できるレポートが完成しました。貴重なお時間を割いていただき、貴重な体験をさせていただき、誠にありがとうございました。他の方にもぜひお勧めしたいですし、今後さらに市場データが必要になった際には、まずThe Insight Partnersにご連絡させていただきます。
ジョン・スズキ 社長兼最高経営責任者、取締役, BKテクノロジーズナイジェリアの感染症IVD市場に関する情報提供依頼に対し、ご対応いただいた際、ご尽力とプロフェッショナルな姿勢に深く感謝申し上げます。忍耐強く、的確なアドバイスをいただき、また、最終的に取引成立に至った割引のご提供にも深く感謝申し上げます。今回の最初の出会いで得た強い印象のおかげで、今後もThe Insight Partnersとの連携を心待ちにしております。
チジオケ博士 オニア マネージングディレクター, パインクレストヘルスケア株式会社購入理由
- 情報に基づいた意思決定
- 市場動向の理解
- 競合分析
- 顧客インサイト
- 市場予測
- リスク軽減
- 戦略計画
- 投資の正当性
- 新興市場の特定
- マーケティング戦略の強化
- 業務効率の向上
- 規制動向への対応


